American restaurant chain BJ’s Restaurants (NASDAQ: BJRI) met Wall Street’s revenue expectations in Q1 CY2026, with sales up 2.9% year on year to $358.1 million. Its non-GAAP profit of $0.57 per share was 5.8% below analysts’ consensus estimates.
Is now the time to buy BJ's? Find out by accessing our full research report, it’s free.
BJ's (BJRI) Q1 CY2026 Highlights:
- Revenue: $358.1 million vs analyst estimates of $357 million (2.9% year-on-year growth, in line)
- Adjusted EPS: $0.57 vs analyst expectations of $0.61 (5.8% miss)
- Adjusted EBITDA: $37.75 million vs analyst estimates of $37.21 million (10.5% margin, 1.4% beat)
- EBITDA guidance for the full year is $145 million at the midpoint, below analyst estimates of $146 million
- Operating Margin: 3%, down from 4.3% in the same quarter last year
- Locations: 219 at quarter end, in line with the same quarter last year
- Same-Store Sales rose 2.4% year on year, in line with the same quarter last year
- Market Capitalization: $776.9 million
“Our Q1 results underscore the continued momentum of our business, marked by our seventh consecutive quarter of sales and traffic growth, along with increased profitability,” commented Lyle Tick, Chief Executive Officer and President.
Company Overview
Founded in 1978 in California, BJ’s Restaurants (NASDAQ: BJRI) is a chain of restaurants whose menu features classic American dishes, often with a twist.
Revenue Growth
Reviewing a company’s long-term sales performance reveals insights into its quality. Any business can experience short-term success, but top-performing ones enjoy sustained growth for years.
With $1.41 billion in revenue over the past 12 months, BJ's is a mid-sized restaurant chain, which sometimes brings disadvantages compared to larger competitors benefiting from better brand awareness and economies of scale.
As you can see below, BJ’s sales grew at a sluggish 3.2% compounded annual growth rate over the last seven years as its restaurant footprint remained unchanged.
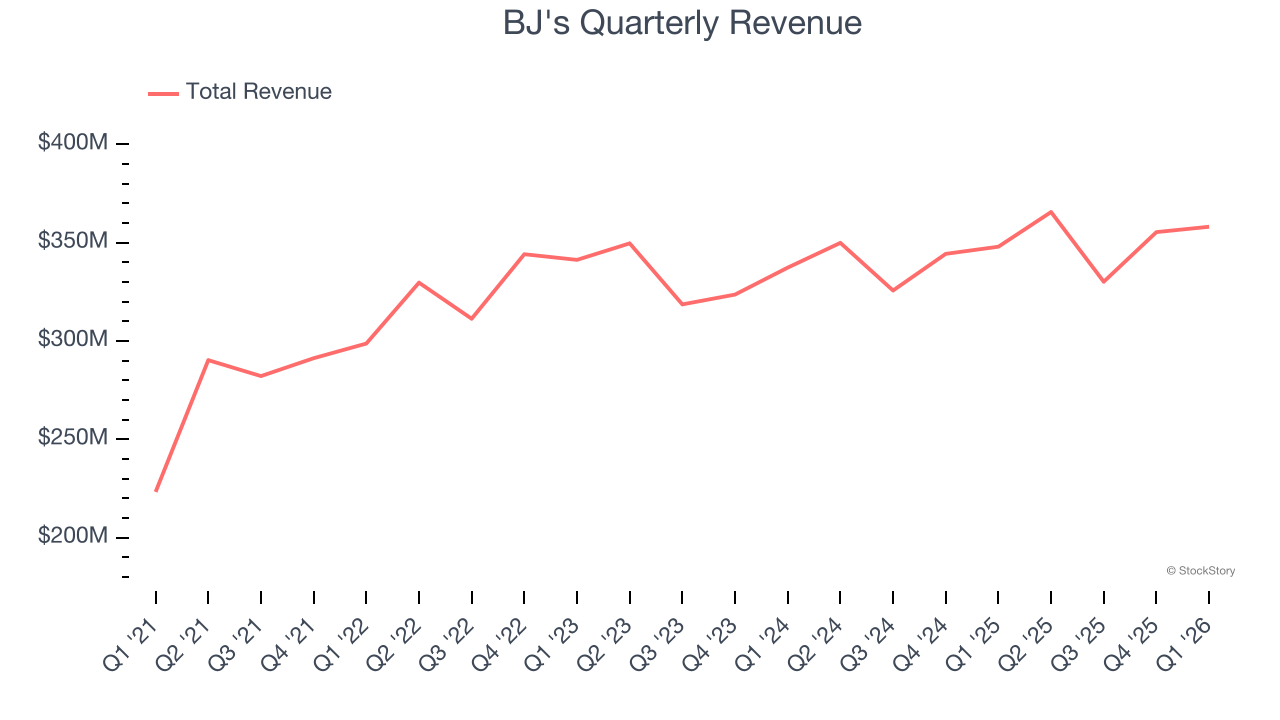
This quarter, BJ's grew its revenue by 2.9% year on year, and its $358.1 million of revenue was in line with Wall Street’s estimates.
Looking ahead, sell-side analysts expect revenue to grow 2.8% over the next 12 months, similar to its seven-year rate. This projection is underwhelming and suggests its newer menu offerings will not catalyze better top-line performance yet.
ALSO WORTH WATCHING: Nvidia’s Quiet Partner. Nvidia’s chips cost a hundred grand. The connectors that make them work cost even more. One company makes them all.
Every AI server needs specialized infrastructure the chip companies don’t make. High-speed cables. Power connectors. Thermal sensors. This 90-year-old company built a monopoly on it. The AI boom just started. This stock is still flying under the radar. Claim The Stock Ticker Here for FREE.
Restaurant Performance
Number of Restaurants
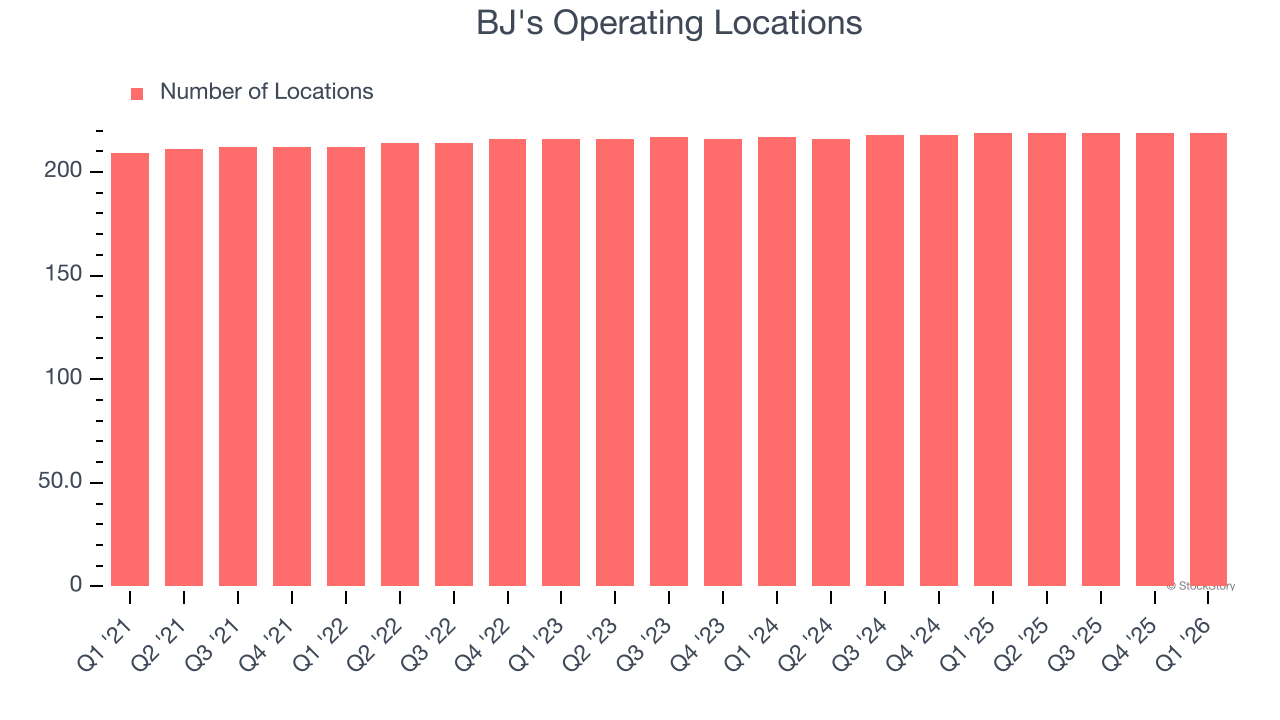
BJ's listed 219 locations in the latest quarter and has kept its restaurant count flat over the last two years while other restaurant businesses have opted for growth.
When a chain doesn’t open many new restaurants, it usually means there’s stable demand for its meals and it’s focused on improving operational efficiency to increase profitability.
Same-Store Sales
A company's restaurant base only paints one part of the picture. When demand is high, it makes sense to open more. But when demand is low, it’s prudent to close some locations and use the money in other ways. Same-store sales gives us insight into this topic because it measures organic growth at restaurants open for at least a year.
BJ’s demand rose over the last two years and slightly outpaced the industry. On average, the company’s same-store sales have grown by 2.1% per year. Given its flat restaurant base over the same period, this performance stems from a mixture of higher prices and increased foot traffic at existing locations.
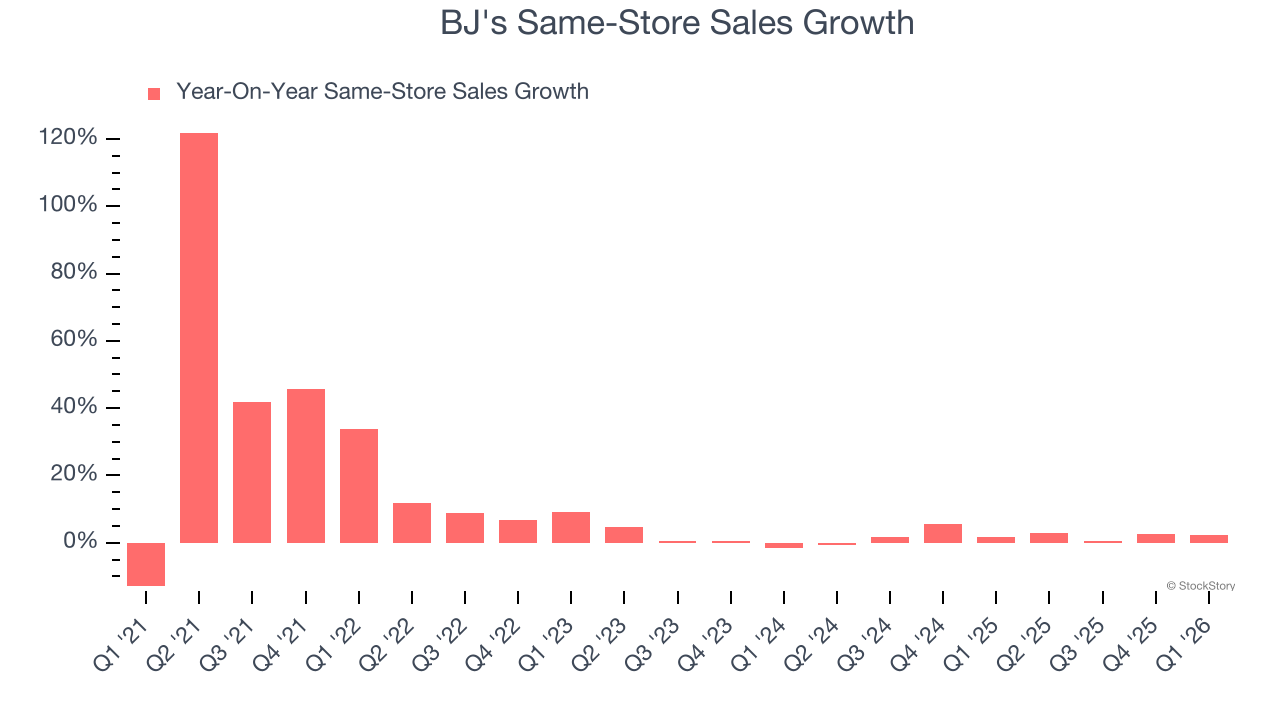
In the latest quarter, BJ’s same-store sales rose 2.4% year on year. This performance was more or less in line with its historical levels.
Key Takeaways from BJ’s Q1 Results
It was good to see BJ's meet analysts’ same-store sales expectations this quarter. We were also happy its EBITDA narrowly outperformed Wall Street’s estimates. On the other hand, its EPS missed and its full-year EBITDA guidance fell slightly short of Wall Street’s estimates. Zooming out, we think this was a mixed quarter. Investors were likely hoping for more, and shares traded down 4.1% to $36.74 immediately following the results.
Should you buy the stock or not? If you’re making that decision, you should consider the bigger picture of valuation, business qualities, as well as the latest earnings. We cover that in our actionable full research report which you can read here (it’s free).