Spotify Technology S.A. (NYSE: SPOT):
This press release features multimedia. View the full release here: https://www.businesswire.com/news/home/20220202005417/en/
(Graphic: Business Wire)
Dear Shareholders,
We ended 2021 with strong Q4 results, led by outperformance in MAUs, continued momentum in our subscription business, and meaningful advertising results. Looking back on not just this quarter, but the past few years, we are increasingly excited about the investments we have made and see meaningful progress within a number of our initiatives. As we move into 2022 and beyond, the opportunities in front of us are large and we see a tremendous amount of greenfield on the horizon.
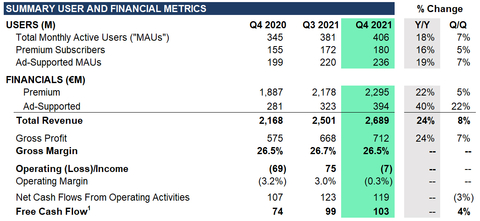
Fourth Quarter and Full Year 2021 Earnings Highlights
- MAUs grew 18% Y/Y to 406 million in Q4, near the top end of guidance range.
- Premium Subscribers grew 16% Y/Y to 180 million in Q4, led by strong promotional campaign performance.
- Premium ARPU grew 3% Y/Y in Q4 and 1% Y/Y on a constant currency basis.
- Ad-Supported Revenue reached a record 15% of Total Revenue in Q4.
- Gross Margin finished at 26.5% in Q4, above the top end of our guidance range.
- Announced the agreement to acquire Findaway and the acquisition of Whooshkaa in Q4.
MONTHLY ACTIVE USERS (“MAUs”)
Total MAUs grew 18% Y/Y to 406 million in the quarter, up from 381 million last quarter and near the top end of our guidance range. We saw double digit Y/Y growth in all regions with particular strength in the Rest of World, which was led by strong results in India and Indonesia. Latin America also outperformed expectations.
On December 1, 2021, we successfully launched the 7th annual year-end Spotify Wrapped campaign to users in 103 markets. Collectively, 120 million MAUs engaged with Wrapped content in Q4 (up 29% Y/Y) and there was strong Y/Y growth in engagement across all regions and demographics. The campaign trended worldwide with nearly 60 million shares of Wrapped stories and cards, triggering significant levels of consumption across our two personalized playlists (Your Top Songs and Your Artists Revealed) which were responsible for almost 8% of total on-platform consumption hours within 48 hours of launch.
PREMIUM SUBSCRIBERS
Our Premium Subscribers grew 16% Y/Y to 180 million in the quarter, up from 172 million last quarter and near the top end of the guidance range. All regions contributed to growth, led by Europe and Latin America on an absolute Q/Q basis. Additionally, we tested a shortened holiday promotional campaign for our Standard plan (4 weeks vs. 6 weeks in Q4 2020) which shifted typical gross intake seasonality. Despite the two fewer weeks, campaign performance exceeded expectations.
This quarter we also added several major promotional partnerships, including Xiaomi (Spotify preloads on the world’s second largest phone manufacturer), Shopee (offering 3 month trials with the number one eCommerce platform in Southeast Asia), Visa (offering 3 month trials in India for credit and debit cardholders), and TecToy (Spotify preloads on TecToy mobile devices in Brazil and 3 month trials available for TecToy customers who make an audio or technology portfolio product purchase). Additionally, we renewed our reseller partnership with KPN, the Netherlands' leading telecom operator.
FINANCIAL METRICS
Revenue
Revenue of €2,689 million grew 24% Y/Y in Q4 (or 20% Y/Y on a constant currency basis) and was above the top end of our guidance range due to significant strength in advertising and favorable FX movements. Premium Revenue grew 22% Y/Y to €2,295 million (or 18% Y/Y constant currency) while Ad-Supported Revenue was particularly strong, growing 40% Y/Y to €394 million (or 34% Y/Y constant currency).
Within Premium, average revenue per user (“ARPU”) of €4.40 in Q4 was up 3% Y/Y (or up 1% Y/Y constant currency). Excluding the impact of FX, we saw a benefit to ARPU primarily from our price increases.
Ad-Supported Revenue reached a record 15% of total revenues in the quarter and continued to benefit from higher sold impressions, increased CPMs, and growing demand within the Spotify Audience Network. Podcast revenue strength was led by the Spotify Audience Network, where we saw a significant increase in inventory in conjunction with increased CPMs. Additionally, podcast revenue benefited from strong growth across existing Spotify studios and our exclusive licensing deals.
During the quarter, we announced the acquisition of Whooshkaa, a podcast technology platform that offers a specialized tool for radio broadcasters to turn their existing audio content into on-demand podcast content. This technology will be integrated into the Megaphone suite which will bring more third-party content into the Spotify Audience Network, connect advertisers to more audiences, and allow radio broadcasters to expand their reach and increase monetization.
Gross Margin
Gross Margin finished at 26.5% in Q4, above the top end of our guidance range and flat versus the prior year period. The Gross Margin trend reflected a favorable revenue mix shift towards podcasts, marketplace activity, and Other Cost of Revenue efficiencies (e.g. payment fees, streaming delivery costs), which were offset by higher non-music and other content costs and publishing rate increases. As a reminder, our Q4 2020 Gross Margin benefited from adjustments to estimated music royalties that positively impacted Gross Margin by nearly 60 bps.
Premium Gross Margin was 29.2% in Q4, up 33 bps Y/Y, and Ad-Supported Gross Margin was 10.8% in Q4, or flat Y/Y. As a reminder, all content costs related to podcast investment are included in the Ad-Supported business for the current and historical periods.
Operating Expenses
Operating Expenses totaled €719 million in Q4, an increase of 12% Y/Y. Social Charges were above forecast given the increase in our share price during the quarter. Additionally, personnel costs came in lower than expected as well as certain marketing expenses. Excluding the impact of Social Charge movements, Operating Expenses were better than forecast and contributed to positive Operating Income in the quarter.
As a reminder, Social Charges are payroll taxes associated with employee salaries and benefits, including share-based compensation. We are subject to social taxes in several countries in which we operate, although Sweden accounts for the bulk of the social costs. We don’t forecast stock price changes in our guidance so upward or downward movements will impact our reported operating expenses.
At the end of Q4, our workforce consisted of 7,690 FTEs globally.
Free Cash Flow
Free Cash Flow was €103 million in Q4, a €29 million increase Y/Y primarily due to an increase in net income adjusted for non-cash items, partially offset by higher working capital needs arising from higher podcast-related payments and licensor payments. Capital expenditures decreased €19 million due to finalization of various office build-outs in New York City, Singapore, and Los Angeles.
At the end of Q4, we maintained a strong liquidity position with €3.6 billion in cash and cash equivalents, restricted cash, and short term investments.
PRODUCT AND PLATFORM UPDATES
Two-Sided Marketplace
The Two-Sided Marketplace exceeded our contribution expectations for Q4 and full year 2021 due to continued adoption of paid marketplace tools. Additionally, in October we announced a new integration with Shopify that enables artists to link their Shopify store to their Spotify for Artists account and post merchandise on their artist profile for fans around the world.
Podcasting
At the end of Q4, we had 3.6 million podcasts on the platform (up from 3.2 million at the end of Q3) and were pleased to see a double digit increase in the number of MAUs that engaged with podcast content relative to Q3. Among MAUs that engaged with podcasts in Q4, consumption trends remained strong (up 20% Y/Y on a per user basis) and podcast share of overall consumption hours on our platform reached another all-time high. We also expanded our paid podcast subscriptions to creators and listeners in 33 additional markets and enabled podcasts for users in Russia, Egypt, and Saudi Arabia.
Product Enhancements
During the quarter, we introduced several enhancements to our service aimed at driving user engagement, retention, and conversion. These included the rollout of lyrics on mobile, desktop, and smart TV platforms and extensions to our ubiquity strategy such as support for Alexa in Saudi Arabia and United Arab Emirates, a partnership with Peloton to match users with an instructor based on their listening taste, an audio playback widget with Vivo, and an integration with Apple’s SharePlay product which allows Spotify Premium users to share their favorite content over FaceTime to enjoy a shared listening experience.
Audiobooks
During the quarter, we also accelerated our entry into the audiobook space through the announcement of the agreement to acquire Findaway, a global leader in digital audiobook distribution. The closing of the transaction is subject to regulatory review and approval.
Q1 2022 OUTLOOK
We are re-aligning our current guidance practice to better reflect how we run the business. Since the vast majority of our initiatives are multi-year in nature and measured as such, we no longer plan to issue annual guidance. However, we intend to utilize quarterly guidance as checkpoints against our progress and will provide additional thoughts and perspective around 2022 expectations on our earnings call. As for quarterly guidance, going forward we will simplify our approach by providing a single estimate for each metric instead of a range of outcomes. Additionally, we plan to host an investor day later in 2022 to offer an update on the strength of our platform and our advancement towards our long-term operating goals.
The following forward-looking statements reflect Spotify’s expectations for Q1 2022 as of February 2, 2022 and are subject to substantial uncertainty. Given the extraordinary operating circumstances we currently face with respect to the impact of COVID-19, there is a greater likelihood of variances with respect to such point estimates than in typical quarters.
- Total MAUs: 418 million
- Total Premium Subscribers: 183 million
-
Total Revenue: €2.60 billion
- Assumes approximately 360 bps tailwind to growth Y/Y due to movements in foreign exchange rates
- Gross Margin: 25.0%
- Operating Profit/Loss: €(67) million
SHARE REPURCHASE PROGRAM
On August 20, 2021, Spotify announced a program to repurchase up to $1.0 billion of its ordinary shares. The repurchase program will expire on April 21, 2026. In Q4, the company repurchased 300,724 ordinary shares for €59 million under the Share Repurchase program at a weighted average cost of $222.42 per share. In 2021 the company repurchased a total of 458,234 ordinary shares for €89 million at a weighted average cost of $222.57 per share.
EARNINGS QUESTION & ANSWER SESSION
We will host a live question and answer session starting at 4:30 p.m. ET today on investors.spotify.com. Daniel Ek, our Founder and CEO, and Paul Vogel, our Chief Financial Officer, will be on hand to answer questions submitted through slido.com using the event code #SpotifyEarningsQ421. Participants also may join using the listen-only conference line by registering through the following site:
Direct Event Registration Portal: https://conferencingportals.com/event/txExvogt
We use investors.spotify.com and newsroom.spotify.com websites as well as other social media listed in the “Resources – Social Media” tab of our Investors website to disclose material company information.
Use of Non-IFRS Measures
To supplement our financial information presented in accordance with IFRS, we use the following non-IFRS financial measures: Revenue excluding foreign exchange effect, Premium revenue excluding foreign exchange effect, Ad-Supported revenue excluding foreign exchange effect, and Free Cash Flow. Management believes that Revenue excluding foreign exchange effect, Premium revenue excluding foreign exchange effect, and Ad-Supported revenue excluding foreign exchange effect are useful to investors because they present measures that facilitate comparison to our historical performance. However, Revenue excluding foreign exchange effect, Premium revenue excluding foreign exchange effect, and Ad-Supported revenue excluding foreign exchange effect should be considered in addition to, not as a substitute for or superior to, Revenue, Premium revenue, Ad-Supported revenue or other financial measures prepared in accordance with IFRS. Management believes that Free Cash Flow is useful to investors because it presents a measure that approximates the amount of cash generated that is available to repay debt obligations, to make investments, and for certain other activities that exclude certain infrequently occurring and/or non-cash items. However, Free Cash Flow should be considered in addition to, not as a substitute for or superior to, net cash flows (used in)/from operating activities or other financial measures prepared in accordance with IFRS. For more information on these non-IFRS financial measures, please see “Reconciliation of IFRS to Non-IFRS Results” table.
Forward Looking Statements
This shareholder letter contains estimates and forward-looking statements. All statements other than statements of historical fact are forward-looking statements. The words “may,” “might,” “will,” “could,” “would,” “should,” “expect,” “plan,” “anticipate,” “intend,” “seek,” “believe,” “estimate,” “predict,” “potential,” “continue,” “contemplate,” “possible,” and similar words are intended to identify estimates and forward-looking statements.
Our estimates and forward-looking statements are mainly based on our current expectations and estimates of future events and trends, which affect or may affect our businesses and operations. Although we believe that these estimates and forward-looking statements are based upon reasonable assumptions, they are subject to numerous risks and uncertainties and are made in light of information currently available to us. Many important factors may adversely affect our results as indicated in forward-looking statements. These factors include, but are not limited to: our ability to attract prospective users, retain existing users, and monetize our products and services; competition for users, user listening time, and advertisers; risks associated with our international operations and our ability to manage our growth; our emphasis on innovation and long-term user engagement over short-term results; our ability to predict, recommend, and play content that our users enjoy; our ability to be profitable or generate positive cash flow on a sustained basis; our ability to convince advertisers of the benefits of our advertising offerings; our ability to forecast or optimize advertising inventory amid emerging industry trends in digital advertising; our ability to generate revenues from podcasts and other non-music content; potential disputes or liabilities associated with content made available on our Service; risks relating to acquisitions, investments, and strategic alliances; the impact of the COVID-19 pandemic and other public health crises; our dependence upon third-party licenses for most of the content we stream; our lack of control over third-party content providers who are concentrated and can unilaterally affect our access to content; our ability to comply with complex license agreements; our ability to accurately estimate royalty payments under our license agreements and relevant statutes; the limitations on our operating flexibility due to financial commitments required under certain of our license agreements; our ability to identify the compositions and ownership thereof embodied in sound recordings in order to obtain licenses or comply with existing license agreements; assertions by third parties of infringement or other violations by us of their intellectual property rights; our ability to protect our intellectual property; the dependence of streaming on operating systems, online platforms, hardware, networks, regulations, and standards that we do not control; our ability to maintain user data security; undetected errors, bugs or vulnerabilities in our products; interruptions, delays, or discontinuations in service arising from our systems or systems of third parties; changes in laws or regulations affecting us; risks relating to privacy and data security; our ability to maintain, protect, and enhance our brand; our ability to achieve our net zero emissions target or make progress in other environmental, social, and governance initiatives; payment-related risks; our dependence on key personnel and ability to attract, retain, and motivate highly skilled employees; our ability to access to capital to support growth; risks relating to currency exchange rate fluctuations and foreign exchange controls; the impact of economic, social, or political conditions; our ability to accurately estimate user metrics and other estimates; our ability to manage and remediate attempts to manipulate streams and attempts to gain or provide unauthorized access to certain features of our Service; risks related to our Exchangeable Notes; tax-related risks; the concentration of voting power among our founders, which limits shareholders’ ability to influence our governance and business; and risks related to our status as a foreign private issuer and a Luxembourg company. A detailed discussion of these and other risks and uncertainties that could cause actual results and events to differ materially from our estimates and forward-looking statements is included in our filings with the U.S. Securities and Exchange Commission (“SEC”), including our Annual Report on Form 20-F filed with the SEC on February 5, 2021, as updated by subsequently filed Annual Reports or reports for our interim results on Form 6-K. We undertake no obligation to update forward-looking statements to reflect events or circumstances occurring after the date of this shareholder letter.
Rounding
Certain monetary amounts, percentages, and other figures included in this letter have been subject to rounding adjustments. The sum of individual metrics may not always equal total amounts indicated due to rounding.
Consolidated statement of operations
|
|||||||||||||||
|
|
Three months ended |
|
Twelve months ended |
|||||||||||
|
|
December 31,
|
|
September 30,
|
|
December 31,
|
|
December 31,
|
|
December 31,
|
|||||
Revenue |
|
2,689 |
|
|
2,501 |
|
|
2,168 |
|
|
9,668 |
|
|
7,880 |
|
Cost of revenue |
|
1,977 |
|
|
1,833 |
|
|
1,593 |
|
|
7,077 |
|
|
5,865 |
|
Gross profit |
|
712 |
|
|
668 |
|
|
575 |
|
|
2,591 |
|
|
2,015 |
|
Research and development |
|
253 |
|
|
208 |
|
|
232 |
|
|
912 |
|
|
837 |
|
Sales and marketing |
|
340 |
|
|
280 |
|
|
294 |
|
|
1,135 |
|
|
1,029 |
|
General and administrative |
|
126 |
|
|
105 |
|
|
118 |
|
|
450 |
|
|
442 |
|
|
|
719 |
|
|
593 |
|
|
644 |
|
|
2,497 |
|
|
2,308 |
|
Operating (loss)/income |
|
(7 |
) |
|
75 |
|
|
(69 |
) |
|
94 |
|
|
(293 |
) |
Finance income |
|
20 |
|
|
101 |
|
|
4 |
|
|
246 |
|
|
94 |
|
Finance costs |
|
(21 |
) |
|
(14 |
) |
|
(114 |
) |
|
(91 |
) |
|
(510 |
) |
Finance income/(costs) - net |
|
(1 |
) |
|
87 |
|
|
(110 |
) |
|
155 |
|
|
(416 |
) |
(Loss)/income before tax |
|
(8 |
) |
|
162 |
|
|
(179 |
) |
|
249 |
|
|
(709 |
) |
Income tax expense/(benefit) |
|
31 |
|
|
160 |
|
|
(54 |
) |
|
283 |
|
|
(128 |
) |
Net (loss)/income attributable to owners of the parent |
|
(39 |
) |
|
2 |
|
|
(125 |
) |
|
(34 |
) |
|
(581 |
) |
(Loss)/earnings per share attributable to owners of the parent |
|
|
|
|
|
|
|
|
|
|
|||||
Basic |
|
(0.20 |
) |
|
0.01 |
|
|
(0.66 |
) |
|
(0.18 |
) |
|
(3.10 |
) |
Diluted |
|
(0.21 |
) |
|
(0.41 |
) |
|
(0.66 |
) |
|
(1.03 |
) |
|
(3.10 |
) |
Weighted-average ordinary shares outstanding |
|
|
|
|
|
|
|
|
|
|
|||||
Basic |
|
191,952,473 |
|
|
191,485,473 |
|
|
189,852,424 |
|
|
191,298,397 |
|
|
187,583,307 |
|
Diluted |
|
192,144,654 |
|
|
194,551,862 |
|
|
189,852,424 |
|
|
193,943,455 |
|
|
187,583,307 |
|
Consolidated statement of financial position
|
||||||
|
|
December 31, 2021 |
|
December 31, 2020 |
||
Assets |
|
|
|
|
||
Non-current assets |
|
|
|
|
||
Lease right-of-use assets |
|
437 |
|
|
444 |
|
Property and equipment |
|
372 |
|
|
313 |
|
Goodwill |
|
894 |
|
|
736 |
|
Intangible assets |
|
89 |
|
|
97 |
|
Long term investments |
|
916 |
|
|
2,277 |
|
Restricted cash and other non-current assets |
|
77 |
|
|
78 |
|
Deferred tax assets |
|
13 |
|
|
15 |
|
|
|
2,798 |
|
|
3,960 |
|
Current assets |
|
|
|
|
||
Trade and other receivables |
|
621 |
|
|
464 |
|
Income tax receivable |
|
5 |
|
|
4 |
|
Short term investments |
|
756 |
|
|
596 |
|
Cash and cash equivalents |
|
2,744 |
|
|
1,151 |
|
Other current assets |
|
246 |
|
|
151 |
|
|
|
4,372 |
|
|
2,366 |
|
Total assets |
|
7,170 |
|
|
6,326 |
|
Equity and liabilities |
|
|
|
|
||
Equity |
|
|
|
|
||
Share capital |
|
— |
|
|
— |
|
Other paid in capital |
|
4,746 |
|
|
4,583 |
|
Treasury shares |
|
(260 |
) |
|
(175 |
) |
Other reserves |
|
853 |
|
|
1,687 |
|
Accumulated deficit |
|
(3,220 |
) |
|
(3,290 |
) |
Equity attributable to owners of the parent |
|
2,119 |
|
|
2,805 |
|
Non-current liabilities |
|
|
|
|
||
Exchangeable Notes |
|
1,202 |
|
|
— |
|
Lease liabilities |
|
579 |
|
|
577 |
|
Accrued expenses and other liabilities |
|
37 |
|
|
42 |
|
Provisions |
|
7 |
|
|
2 |
|
|
|
1,825 |
|
|
621 |
|
Current liabilities |
|
|
|
|
||
Trade and other payables |
|
793 |
|
|
638 |
|
Income tax payable |
|
23 |
|
|
9 |
|
Deferred revenue |
|
458 |
|
|
380 |
|
Accrued expenses and other liabilities |
|
1,841 |
|
|
1,748 |
|
Provisions |
|
22 |
|
|
20 |
|
Derivative liabilities |
|
89 |
|
|
105 |
|
|
|
3,226 |
|
|
2,900 |
|
Total liabilities |
|
5,051 |
|
|
3,521 |
|
Total equity and liabilities |
|
7,170 |
|
|
6,326 |
|
Consolidated statement of cash flows
|
|||||||||||||||
|
|
Three months ended |
|
Twelve months ended |
|||||||||||
|
|
December 31,
|
|
September 30,
|
|
December 31,
|
|
December 31,
|
|
December 31,
|
|||||
Operating activities |
|
|
|
|
|
|
|
|
|
|
|||||
Net (loss)/income |
|
(39 |
) |
|
2 |
|
|
(125 |
) |
|
(34 |
) |
|
(581 |
) |
Adjustments to reconcile net (loss)/income to net cash flows |
|
|
|
|
|
|
|
|
|
|
|||||
Depreciation of property and equipment and lease right-of-use assets |
|
25 |
|
|
24 |
|
|
21 |
|
|
94 |
|
|
86 |
|
Amortization of intangible assets |
|
8 |
|
|
9 |
|
|
8 |
|
|
33 |
|
|
25 |
|
Share-based compensation expense |
|
50 |
|
|
57 |
|
|
43 |
|
|
223 |
|
|
176 |
|
Finance income |
|
(20 |
) |
|
(101 |
) |
|
(4 |
) |
|
(246 |
) |
|
(94 |
) |
Finance costs |
|
21 |
|
|
14 |
|
|
114 |
|
|
91 |
|
|
510 |
|
Income tax expense/(benefit) |
|
31 |
|
|
160 |
|
|
(54 |
) |
|
283 |
|
|
(128 |
) |
Other |
|
3 |
|
|
(2 |
) |
|
4 |
|
|
6 |
|
|
7 |
|
Changes in working capital: |
|
|
|
|
|
|
|
|
|
|
|||||
Increase in trade receivables and other assets |
|
(63 |
) |
|
(102 |
) |
|
(94 |
) |
|
(245 |
) |
|
(187 |
) |
Increase in trade and other liabilities |
|
92 |
|
|
82 |
|
|
182 |
|
|
137 |
|
|
425 |
|
Increase/(decrease) in deferred revenue |
|
17 |
|
|
(4 |
) |
|
23 |
|
|
67 |
|
|
73 |
|
Increase/(decrease) in provisions |
|
8 |
|
|
(2 |
) |
|
— |
|
|
5 |
|
|
6 |
|
Interest paid on lease liabilities |
|
(13 |
) |
|
(13 |
) |
|
(12 |
) |
|
(50 |
) |
|
(55 |
) |
Interest received |
|
— |
|
|
1 |
|
|
1 |
|
|
3 |
|
|
4 |
|
Income tax paid |
|
(1 |
) |
|
(2 |
) |
|
— |
|
|
(6 |
) |
|
(8 |
) |
Net cash flows from operating activities |
|
119 |
|
|
123 |
|
|
107 |
|
|
361 |
|
|
259 |
|
Investing activities |
|
|
|
|
|
|
|
|
|
|
|||||
Business combinations, net of cash acquired |
|
(14 |
) |
|
— |
|
|
(194 |
) |
|
(115 |
) |
|
(336 |
) |
Purchases of property and equipment |
|
(16 |
) |
|
(25 |
) |
|
(35 |
) |
|
(85 |
) |
|
(78 |
) |
Purchases of short term investments |
|
(112 |
) |
|
(161 |
) |
|
(406 |
) |
|
(497 |
) |
|
(1,354 |
) |
Sales and maturities of short term investments |
|
88 |
|
|
63 |
|
|
505 |
|
|
375 |
|
|
1,421 |
|
Proceeds from sale of long term investment |
|
144 |
|
|
— |
|
|
— |
|
|
144 |
|
|
— |
|
Change in restricted cash |
|
— |
|
|
1 |
|
|
2 |
|
|
1 |
|
|
2 |
|
Other |
|
(3 |
) |
|
1 |
|
|
(4 |
) |
|
(10 |
) |
|
(27 |
) |
Net cash flows from/(used in) investing activities |
|
87 |
|
|
(121 |
) |
|
(132 |
) |
|
(187 |
) |
|
(372 |
) |
Financing activities |
|
|
|
|
|
|
|
|
|
|
|||||
Payments of lease liabilities |
|
(10 |
) |
|
(9 |
) |
|
(8 |
) |
|
(35 |
) |
|
(24 |
) |
Lease incentives received |
|
— |
|
|
7 |
|
|
7 |
|
|
7 |
|
|
20 |
|
Proceeds from exercise of stock options |
|
64 |
|
|
26 |
|
|
45 |
|
|
167 |
|
|
319 |
|
Proceeds from issuance of Exchangeable Notes, net of costs |
|
— |
|
|
— |
|
|
— |
|
|
1,223 |
|
|
— |
|
Proceeds from issuance of warrants |
|
— |
|
|
31 |
|
|
— |
|
|
31 |
|
|
— |
|
Repurchases of ordinary shares |
|
(65 |
) |
|
(24 |
) |
|
— |
|
|
(89 |
) |
|
— |
|
Payments for employee taxes withheld from restricted stock unit releases |
|
(14 |
) |
|
(12 |
) |
|
(11 |
) |
|
(54 |
) |
|
(30 |
) |
Net cash flows (used in)/from financing activities |
|
(25 |
) |
|
19 |
|
|
33 |
|
|
1,250 |
|
|
285 |
|
Net increase in cash and cash equivalents |
|
181 |
|
|
21 |
|
|
8 |
|
|
1,424 |
|
|
172 |
|
Cash and cash equivalents at beginning of the period |
|
2,512 |
|
|
2,440 |
|
|
1,182 |
|
|
1,151 |
|
|
1,065 |
|
Net foreign exchange gains/(losses) on cash and cash equivalents |
|
51 |
|
|
51 |
|
|
(39 |
) |
|
169 |
|
|
(86 |
) |
Cash and cash equivalents at period end |
|
2,744 |
|
|
2,512 |
|
|
1,151 |
|
|
2,744 |
|
|
1,151 |
|
Calculation of basic and diluted (loss)/earnings per share
|
|||||||||||||||
|
|
Three months ended |
|
Twelve months ended |
|||||||||||
|
|
December 31,
|
|
September 30,
|
|
December 31,
|
|
December 31,
|
|
December 31,
|
|||||
Basic (loss)/earnings per share |
|
|
|
|
|
|
|
|
|
|
|||||
Net (loss)/income attributable to owners of the parent |
|
(39 |
) |
|
2 |
|
|
(125 |
) |
|
(34 |
) |
|
(581 |
) |
Share used in computation: |
|
|
|
|
|
|
|
|
|
|
|||||
Weighted-average ordinary shares outstanding |
|
191,952,473 |
|
|
191,485,473 |
|
|
189,852,424 |
|
|
191,298,397 |
|
|
187,583,307 |
|
Basic (loss)/earnings per share attributable to owners of the parent |
|
(0.20 |
) |
|
0.01 |
|
|
(0.66 |
) |
|
(0.18 |
) |
|
(3.10 |
) |
|
|
|
|
|
|
|
|
|
|
|
|||||
Diluted loss per share |
|
|
|
|
|
|
|
|
|
|
|||||
Net (loss)/income attributable to owners of the parent |
|
(39 |
) |
|
2 |
|
|
(125 |
) |
|
(34 |
) |
|
(581 |
) |
Fair value gains on dilutive warrants |
|
(2 |
) |
|
(30 |
) |
|
— |
|
|
(53 |
) |
|
— |
|
Fair value gains on dilutive Exchangeable Notes |
|
— |
|
|
(52 |
) |
|
— |
|
|
(112 |
) |
|
— |
|
Net loss used in the computation of diluted loss per share |
|
(41 |
) |
|
(80 |
) |
|
(125 |
) |
|
(199 |
) |
|
(581 |
) |
Shares used in computation: |
|
|
|
|
|
|
|
|
|
|
|||||
Weighted-average ordinary shares outstanding |
|
191,952,473 |
|
|
191,485,473 |
|
|
189,852,424 |
|
|
191,298,397 |
|
|
187,583,307 |
|
Warrants |
|
192,181 |
|
|
154,889 |
|
|
— |
|
|
220,137 |
|
|
— |
|
Exchangeable Notes |
|
— |
|
|
2,911,500 |
|
|
— |
|
|
2,424,921 |
|
|
— |
|
Diluted weighted-average ordinary shares |
|
192,144,654 |
|
|
194,551,862 |
|
|
189,852,424 |
|
|
193,943,455 |
|
|
187,583,307 |
|
Diluted loss per share attributable to owners of the parent |
|
(0.21 |
) |
|
(0.41 |
) |
|
(0.66 |
) |
|
(1.03 |
) |
|
(3.10 |
) |
Reconciliation of IFRS to Non-IFRS Results
|
||||||||||
|
|
Three months ended |
|
Twelve months ended |
||||||
|
|
December 31,
|
|
December 31,
|
|
December 31,
|
|
December 31,
|
||
IFRS revenue |
|
2,689 |
|
|
2,168 |
|
9,668 |
|
|
7,880 |
Foreign exchange effect on 2021 revenue using 2020 rates |
|
79 |
|
|
|
|
(101 |
) |
|
|
Revenue excluding foreign exchange effect |
|
2,610 |
|
|
|
|
9,769 |
|
|
|
IFRS revenue year-over-year change % |
|
24 |
% |
|
|
|
23 |
% |
|
|
Revenue excluding foreign exchange effect year-over-year change % |
|
20 |
% |
|
|
|
24 |
% |
|
|
IFRS Premium revenue |
|
2,295 |
|
|
1,887 |
|
8,460 |
|
|
7,135 |
Foreign exchange effect on 2021 Premium revenue using 2020 rates |
|
62 |
|
|
|
|
(80 |
) |
|
|
Premium revenue excluding foreign exchange effect |
|
2,233 |
|
|
|
|
8,540 |
|
|
|
IFRS Premium revenue year-over-year change % |
|
22 |
% |
|
|
|
19 |
% |
|
|
Premium revenue excluding foreign exchange effect year-over-year change % |
|
18 |
% |
|
|
|
20 |
% |
|
|
IFRS Ad-Supported revenue |
|
394 |
|
|
281 |
|
1,208 |
|
|
745 |
Foreign exchange effect on 2021 Ad-Supported revenue using 2020 rates |
|
17 |
|
|
|
|
(21 |
) |
|
|
Ad-Supported revenue excluding foreign exchange effect |
|
377 |
|
|
|
|
1,229 |
|
|
|
IFRS Ad-Supported revenue year-over-year change % |
|
40 |
% |
|
|
|
62 |
% |
|
|
Ad-Supported revenue excluding foreign exchange effect year-over-year change % |
|
34 |
% |
|
|
|
65 |
% |
|
|
Free Cash Flow
|
|||||||||||||||
|
|
Three months ended |
|
Twelve months ended |
|||||||||||
|
|
December 31,
|
|
September 30,
|
|
December 31,
|
|
December 31,
|
|
December 31,
|
|||||
Net cash flows from operating activities |
|
119 |
|
|
123 |
|
|
107 |
|
|
361 |
|
|
259 |
|
Capital expenditures |
|
(16 |
) |
|
(25 |
) |
|
(35 |
) |
|
(85 |
) |
|
(78 |
) |
Change in restricted cash |
|
— |
|
|
1 |
|
|
2 |
|
|
1 |
|
|
2 |
|
Free Cash Flow |
|
103 |
|
|
99 |
|
|
74 |
|
|
277 |
|
|
183 |
|
1Free Cash Flow is a non-IFRS measure. See “Use of Non-IFRS Measures” and “Reconciliation of IFRS to Non-IFRS Results” for additional information.
View source version on businesswire.com: https://www.businesswire.com/news/home/20220202005417/en/
Contacts
Investor Relations:
Bryan Goldberg
Lauren Katzen
ir@spotify.com
Public Relations:
Dustee Jenkins
press@spotify.com