Consider the following timely questions.
- Will the U.S. and Iran reach a peace settlement in their current war?
- Will the Strait of Hormuz be closed again, and for how long?
- When will the stock market care? What about the bond market?
- Is there a way to capitalize on a violent move in either direction?
As I see it, the modern tools we have available offer us the opportunity to customize the “guardrails” around our portfolio. That’s my daily, weekly, monthly, and long-term mission.
I’ll portray “oil” here through the U.S. Oil Fund (USO) (USO), the most optionable ETF in the space tracking the price of that commodity. I see an opportunity that has the basic elements I find favorable:
- Defined downside
- Unlimited upside
- Known time frame
- Takes advantage of the recent moderation in USO’s volatility
Wait, an Oil ETF That Has Low Volatility?
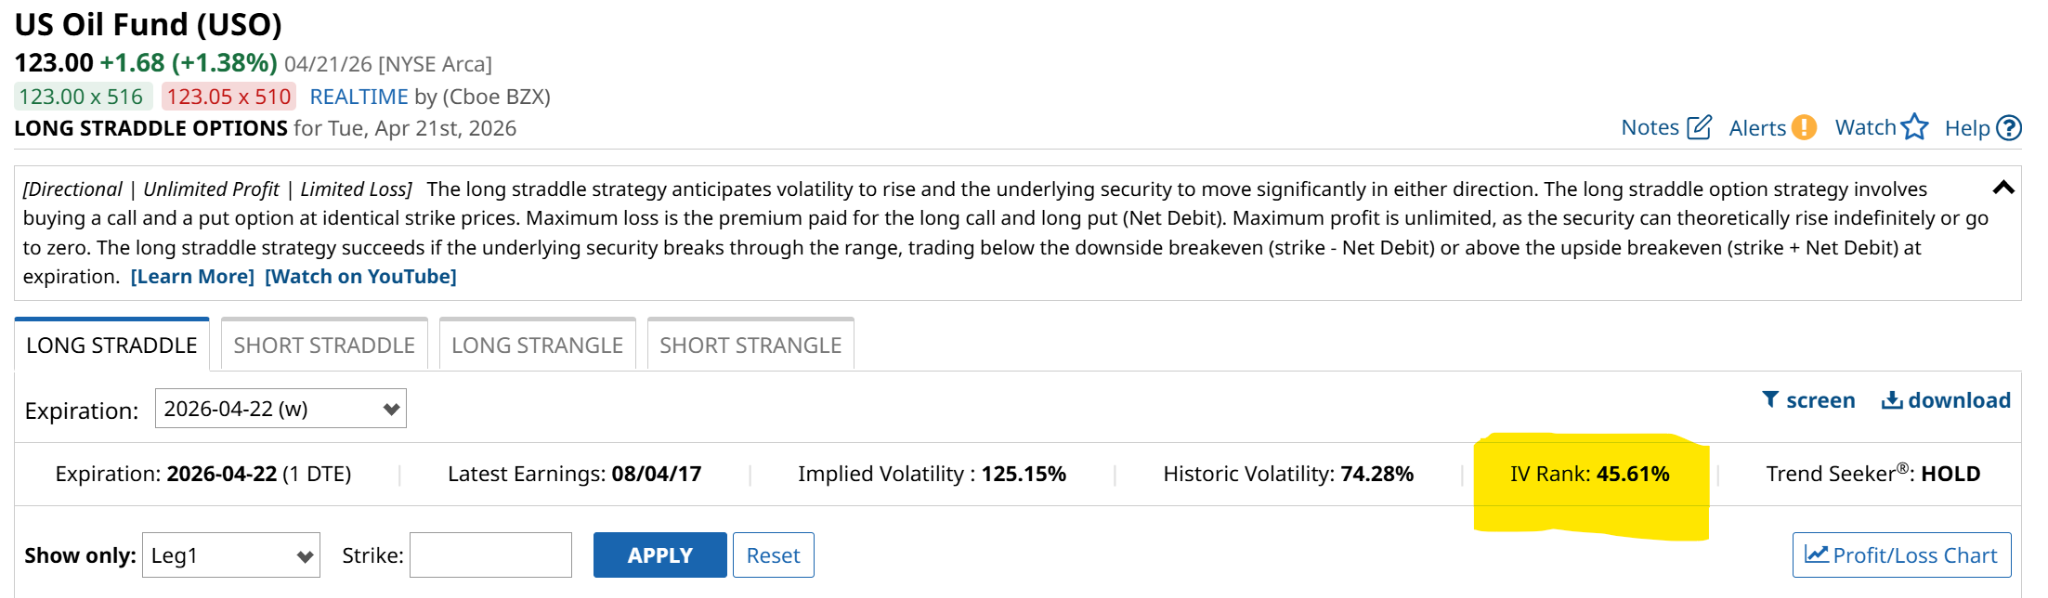
No, USO has not been a low-volatility ETF for a while. However, see that IV Rank in yellow above? It is around 45%. That’s very high for a stock or an ETF. But this is based on oil prices, after all. The key is that the IV rank near 50% and not at 100% indicates to me that this volatile ETF has moderated just enough recently, thanks to a pause in the Middle East hostilities.
That could change quickly. But for now, it is a foot in the door for those who would like to position to try to profit from EITHER a renewed spike in USO, OR a continuation of the recent decline. Let’s explore.
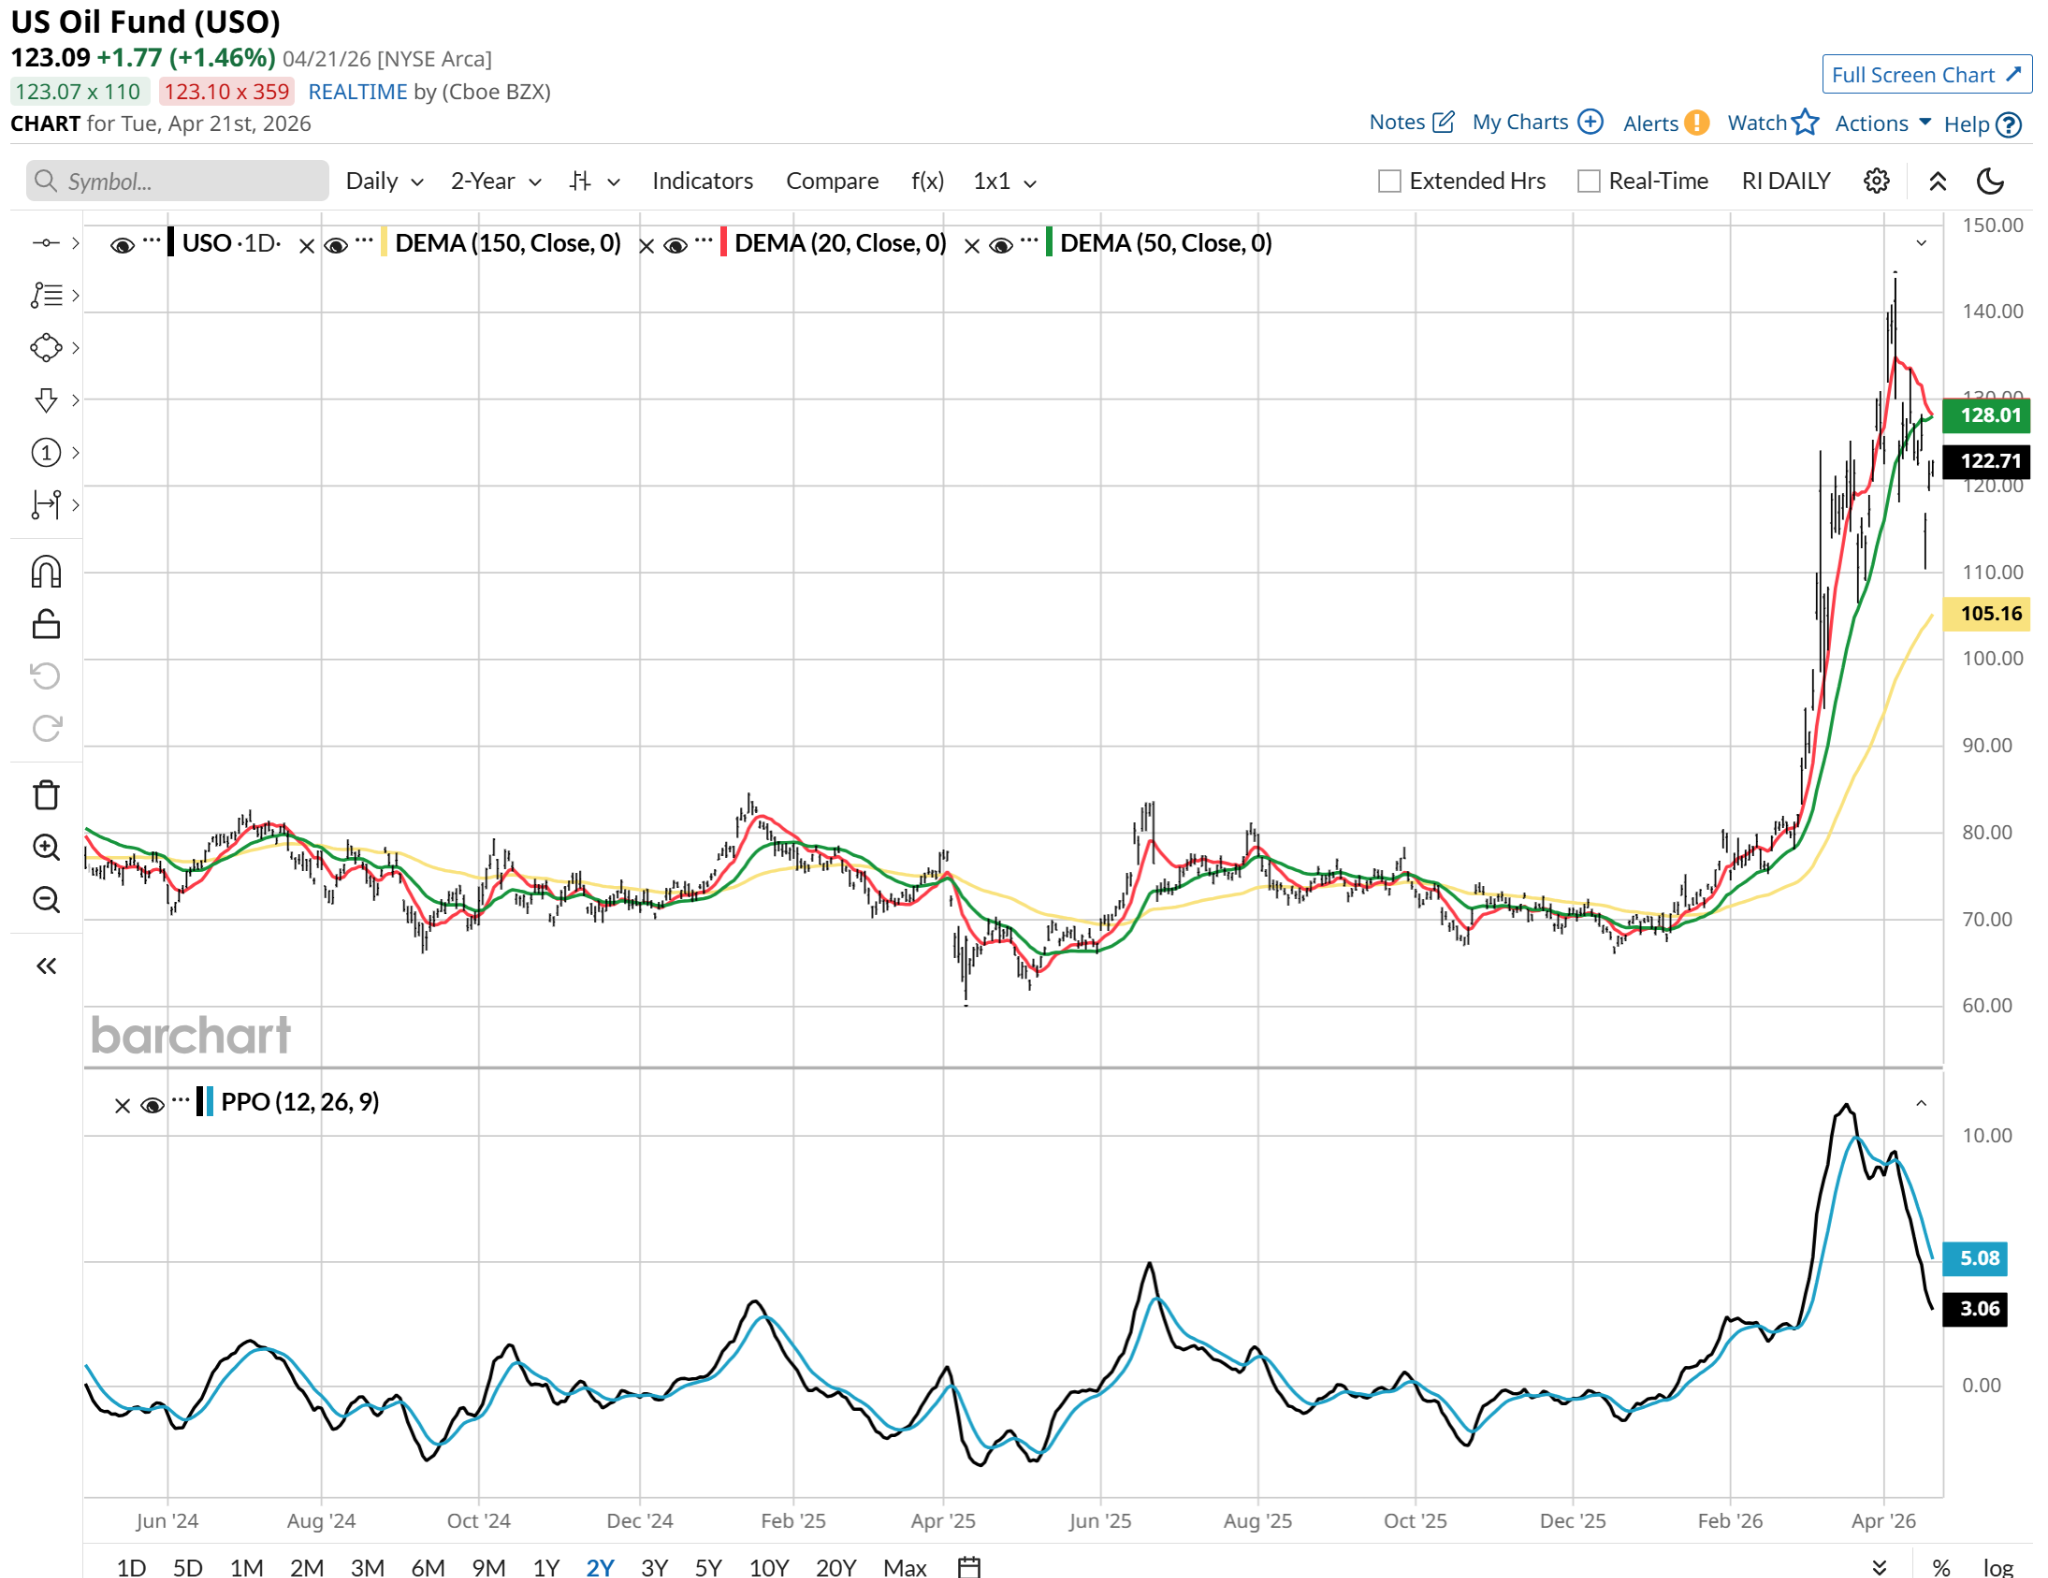
USO’s daily chart is hard to read. Not in a sense that the chart itself is difficult, but that we know this is a geopolitical football.
This chart shows a high and rolling over 20-day moving average, so it “should” drop. However, this is USO in April 2026. I don’t often say this, but throw the chart out. Because what is a better “bet” here is not the direction, but the volatility. It will probably be high again soon.
Here is the strategy I’m discussing. It's a “long strangle” (though I prefer “long combination” as it is less graphic) and I’ll show you some sample combinations below.
First, here’s a definition, straight from the Barchart.com page you’ll see for any security:
[Directional | Unlimited Profit | Limited Loss] The long strangle strategy anticipates volatility to rise and the underlying security to move significantly in either direction. The long strangle option strategy involves buying a call option and buying a put option at a lower strike price. Maximum loss is the premium paid for the long call and long put (Net Debit). Maximum profit is unlimited, as the security can theoretically rise indefinitely or go to zero. The long strangle strategy succeeds if the underlying security breaks through the range, trading below the downside breakeven (lower strike - Net Debit) or above the upside breakeven (higher strike + Net Debit) at expiration.
That brings me to a 2-hour chart that you see below, which is not something I show here often. But in the case of USO, it helps me define a potential near-term price range, based on where it’s been. At $122, I can see $140 as an upside price target, and about $108 on the downside. I’d call that “level one” in that it is relatively close to the current price.
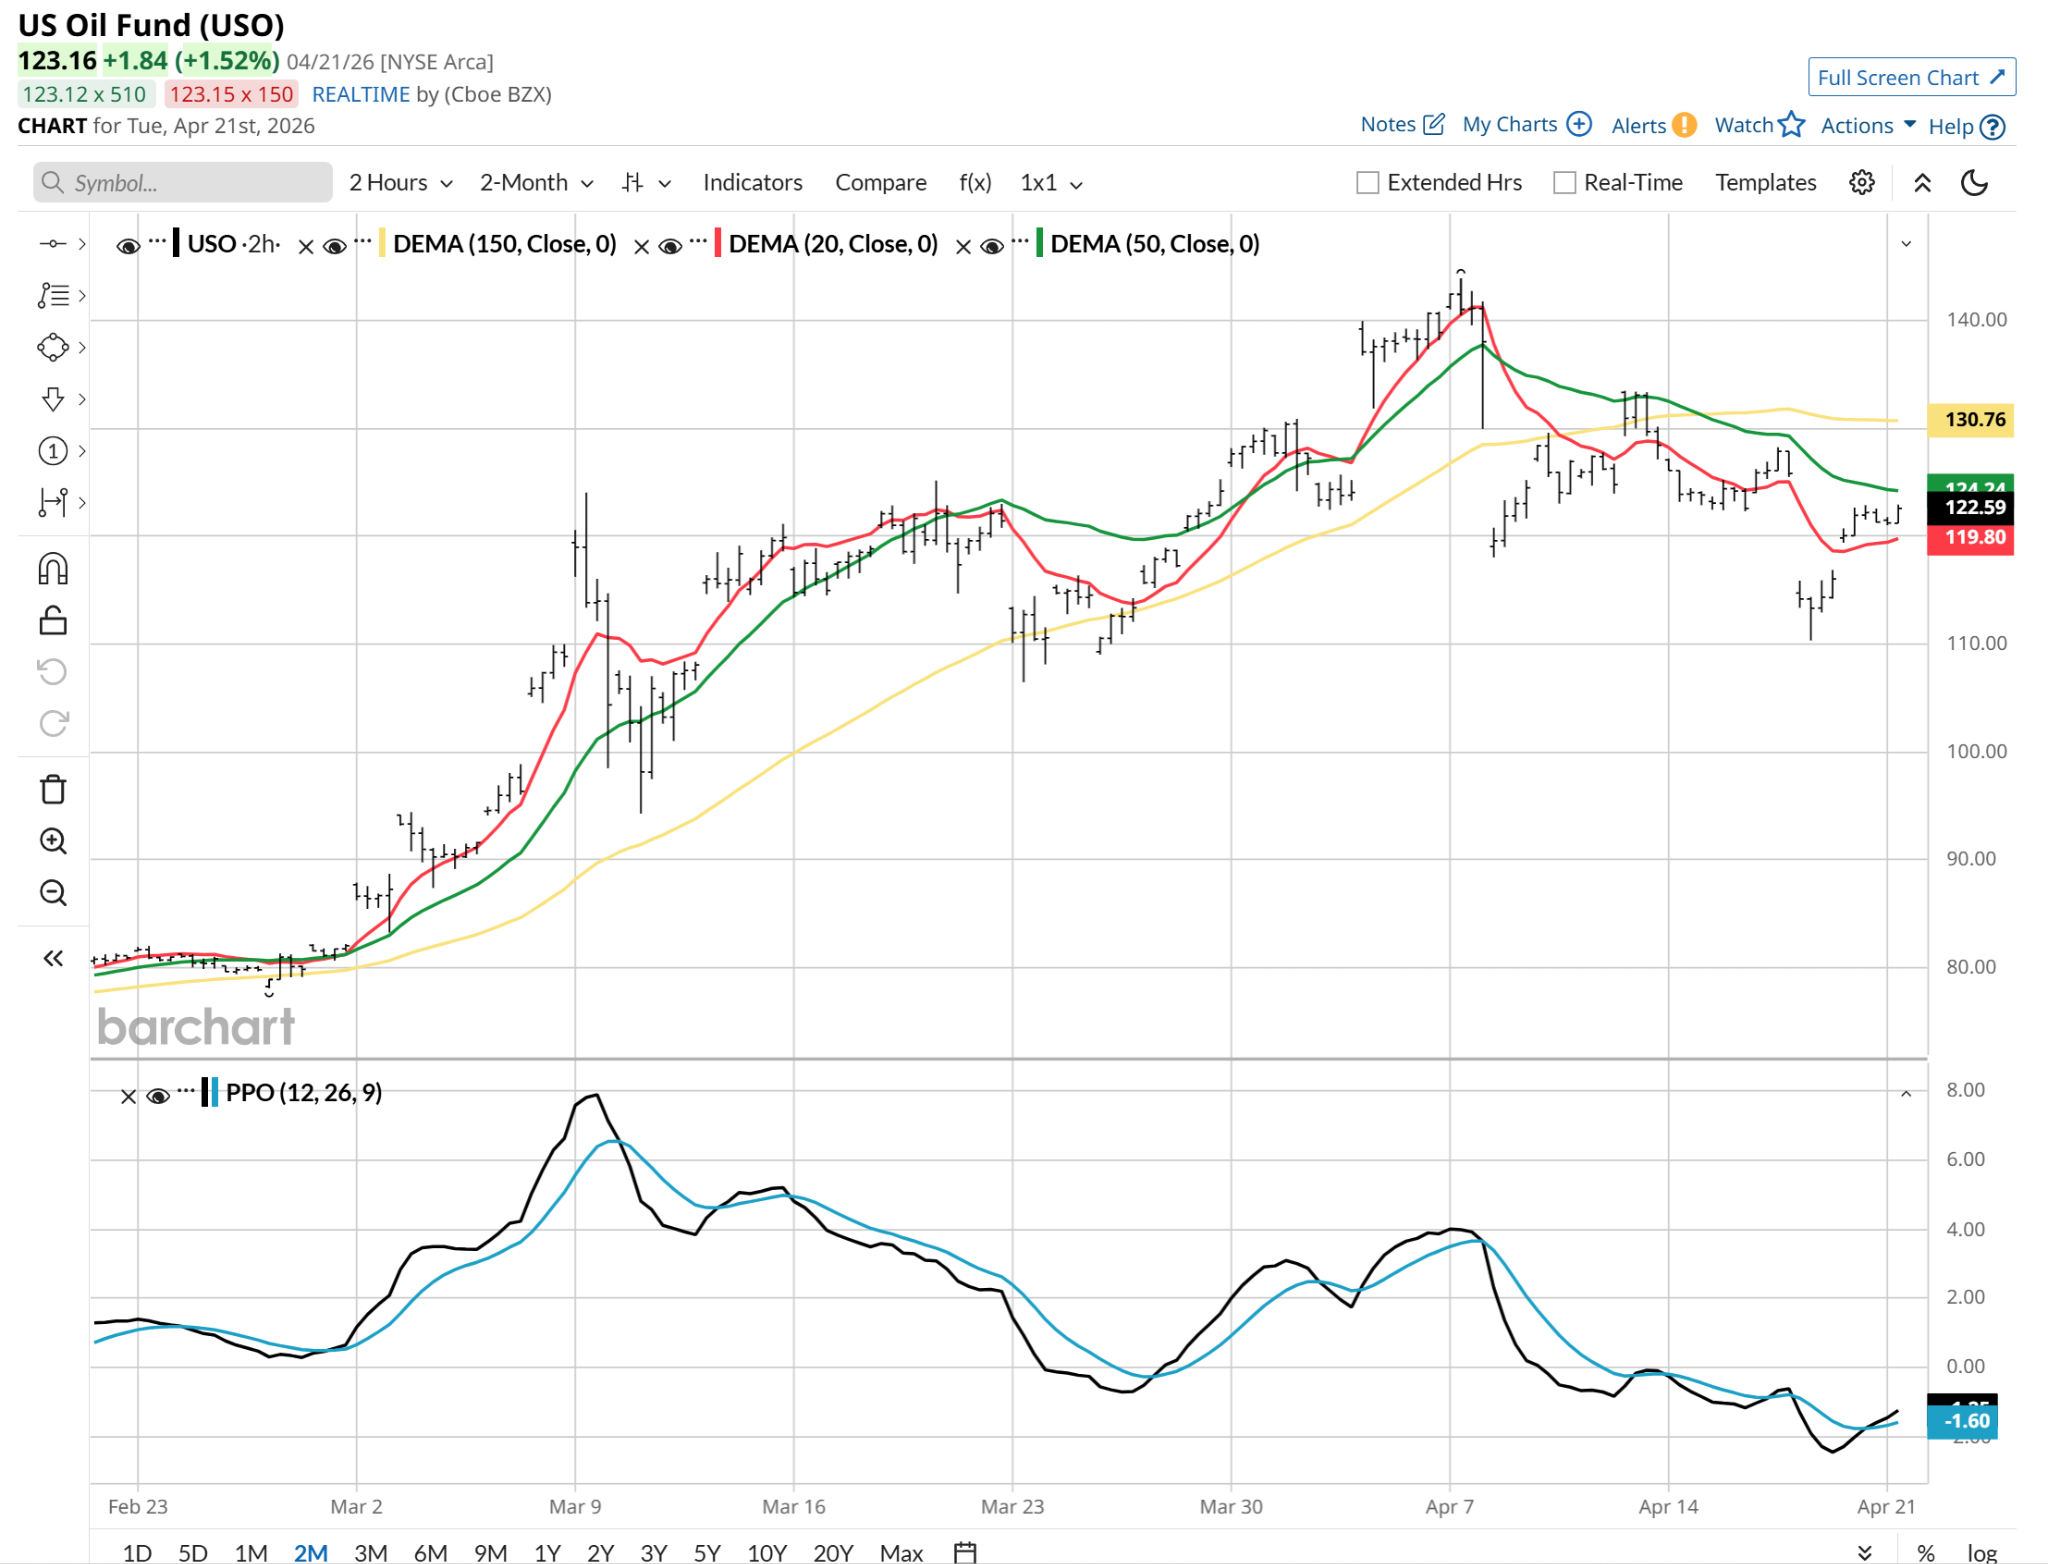
The other way to approach this is to decide that since it would cost less to go further out of the money to the upside (buying USO calls) and the downside (buying USO puts). That also serves to offset some of the high volatility. Moderated, but still high.
To be clear, this is a fixed risk/high return potential/high risk of losing what you put up strategy. The type of thing I look for when my current equity exposure is quite low. I call this “taking big shots with small amounts of money.”
In my mind, without looking at the options prices, those higher spread levels versus the $122 recent price would be perhaps $150 and $100, with about a 3-month outlook. Now, let’s see what’s possible, using the options tables.

There are many possibilities, but since this is about coaching on structure, not a specific trade (since the prices will change by the time you read this), I went with a round-number example. It is easier for me to explain and for you to visualize.

The strikes I chose were $125 for the call and $110 for the put. The cost of the options is still high, so the closer strike prices make up in part for the significant burden to put this on. The calls cost $14.50 (on 1 contact) and the puts cost $6.75, so that’s a $21.25 “bogie” to overcome.
Those BE (breakeven) levels tell the story. USO would have to go to $146.25 for the calls plus the cost of both options to be overcome. Alternatively, USO could fall to $88.75 and too would be a break-even situation. The probability of making a profit, shown toward the right, is about 40%.
Like I said, “big shots with small amounts of money.” This is less about “make a trade” and more about trying to identify where return can be had in a manic market, and how risky chasing that return is.
The important aspect of this setup is the defined worst-case scenario. The most one can lose is the cost of the options. And here, USO is not actually purchased, though it could be. As always, investing choices are about setting boundaries around what would be considered an “acceptable” outcome. Then taking your shots.
Rob Isbitts created the ROAR Score, based on his 40+ years of technical analysis experience. ROAR helps DIY investors manage risk and create their own portfolios. For Rob’s written research, check out ETFYourself.com.
On the date of publication, Rob Isbitts did not have (either directly or indirectly) positions in any of the securities mentioned in this article. All information and data in this article is solely for informational purposes. For more information please view the Barchart Disclosure Policy here.
More news from Barchart
- The Iran War Has Made Oil Prices a Moving Target. That’s Why This ETF and Option Combination Makes Sense.
- The QQQ Chart Hints at 2 Extremes: Either a Dot-Com Bubble Burst or a Technical Breakout Ahead
- Can Ethereum Make a Giant Comeback? Here’s the Bull Case.
- Save This Psychedelic Stock Watchlist After Trump’s Latest Executive Order