

Since May 2021, the S&P 500 has delivered a total return of 75.6%. But one standout stock has more than doubled the market - over the past five years, TETRA Technologies has surged 199% to $9.80 per share. Its momentum hasn’t stopped as it’s also gained 21.9% in the last six months thanks to its solid quarterly results, beating the S&P by 14.3%.
Is there a buying opportunity in TETRA Technologies, or does it present a risk to your portfolio? Dive into our full research report to see our analyst team’s opinion, it’s free.
Why Do We Think TETRA Technologies Will Underperform?
We’re glad investors have benefited from the price increase, but we're swiping left on TETRA Technologies for now. Here are three reasons we avoid TTI and a stock we'd rather own.
1. Long-Term Revenue Growth Shows Strong Momentum
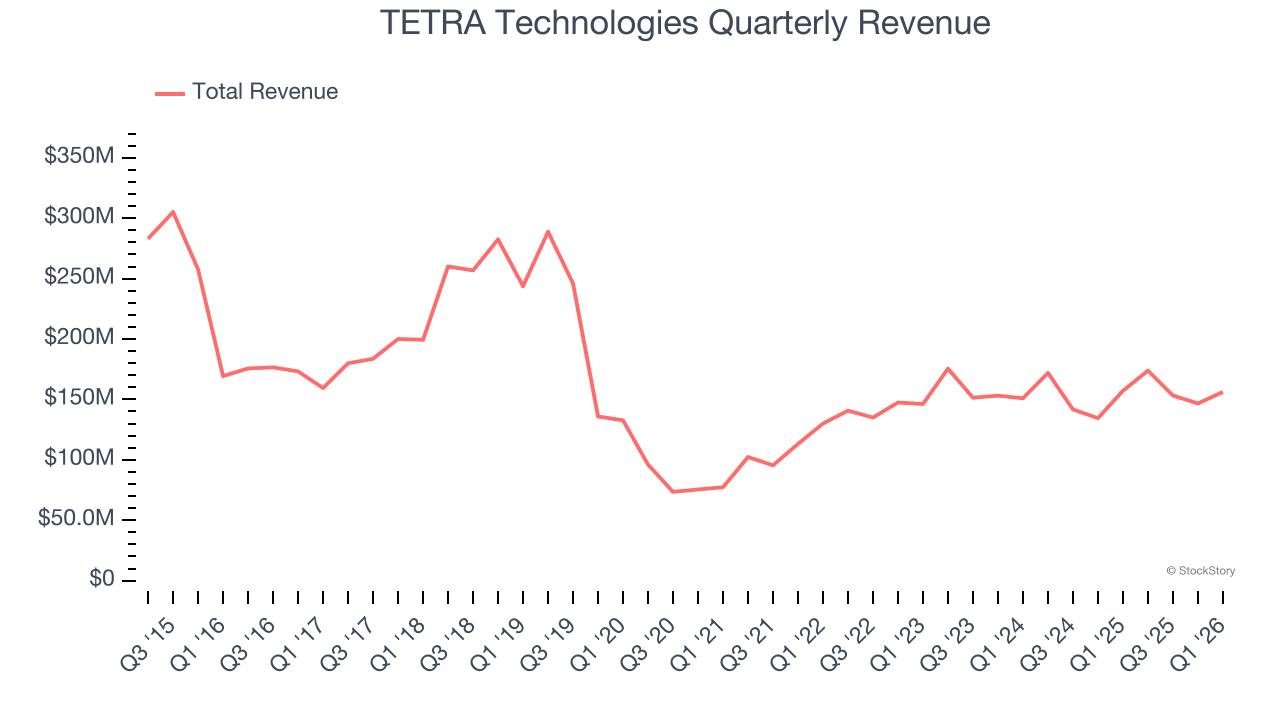
Cyclical sectors like Energy often flatter weaker operators during favorable price environments, but a longer-term lens separates those from businesses that can consistently perform across market cycles. Thankfully, TETRA Technologies’s 14.3% annualized revenue growth over the last five years was solid. Its growth beat the average energy upstream and integrated energy company and shows its offerings resonate with customers.
2. Fewer Distribution Channels Limit its Ceiling
The scale of a company’s revenue base is an important lens through which to view the topline, as it signals whether a producer has gone from a vulnerable commodity taker into a durable operating platform. Larger producers generate revenue across many wells, pads, takeaway routes, and geographies rather than relying on a single field or drilling program.
TETRA Technologies’s $630 million of revenue in the last year is pretty small for the industry, suggesting the company hasn’t hit a level of diversification where investors can sleep easy at night.
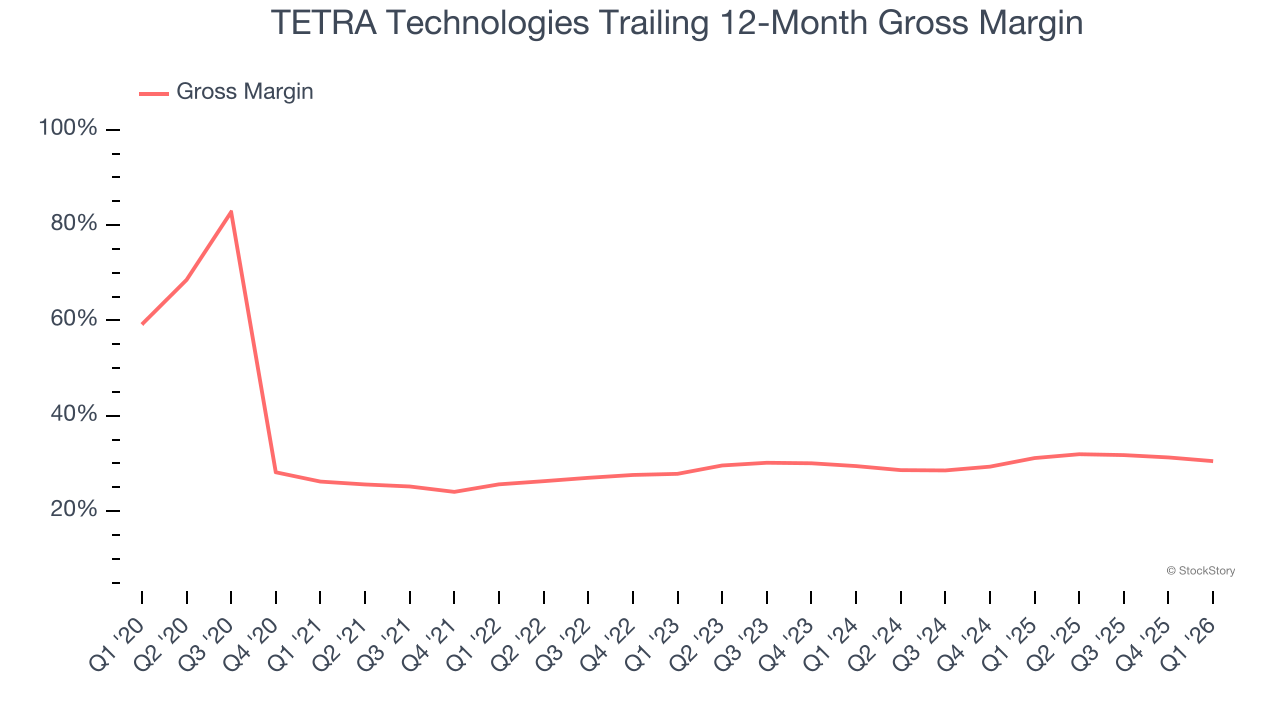
3. Low Gross Margin Reveals Weak Structural Profitability
In any given year, energy gross margins are heavily influenced by prices, hedging, and cost inflation, but over a full cycle these gross margins reveal which producers are structurally advantaged through superior “rock” quality, infrastructure access, and cost position.
TETRA Technologies, which averaged 29.1% gross margin over the last five years, exhibiting bottom-tier unit economics in the sector. It means the company will struggle at higher commodity prices than peers with better gross margins.
Final Judgment
We see the value of companies helping consumers, but in the case of TETRA Technologies, we’re out. With its shares outperforming the market lately, the stock trades at 39.4× forward P/E (or $9.80 per share). At this valuation, there’s a lot of good news priced in - you can find more timely opportunities elsewhere. We’d recommend looking at a top digital advertising platform riding the creator economy.
Stocks We Like More Than TETRA Technologies
WHILE YOU’RE HERE: Top 9 Market-Beating Stocks. The best stocks don't just beat the market once. They do it again. And again. Robust revenue growth, rising free cash flow, returns on capital that leave their competition in the dust. The market has already rewarded these businesses.
But our AI platform says the party isn't over. Find out which 9 stocks made the cut this week - FREE. Get Our Top 9 Market-Beating Stocks for Free HERE.
Stocks that have made our list include now familiar names such as Nvidia (+1,326% between June 2020 and June 2025) as well as under-the-radar businesses like the once-micro-cap company Tecnoglass (+1,754% five-year return). Find your next big winner with StockStory today.


