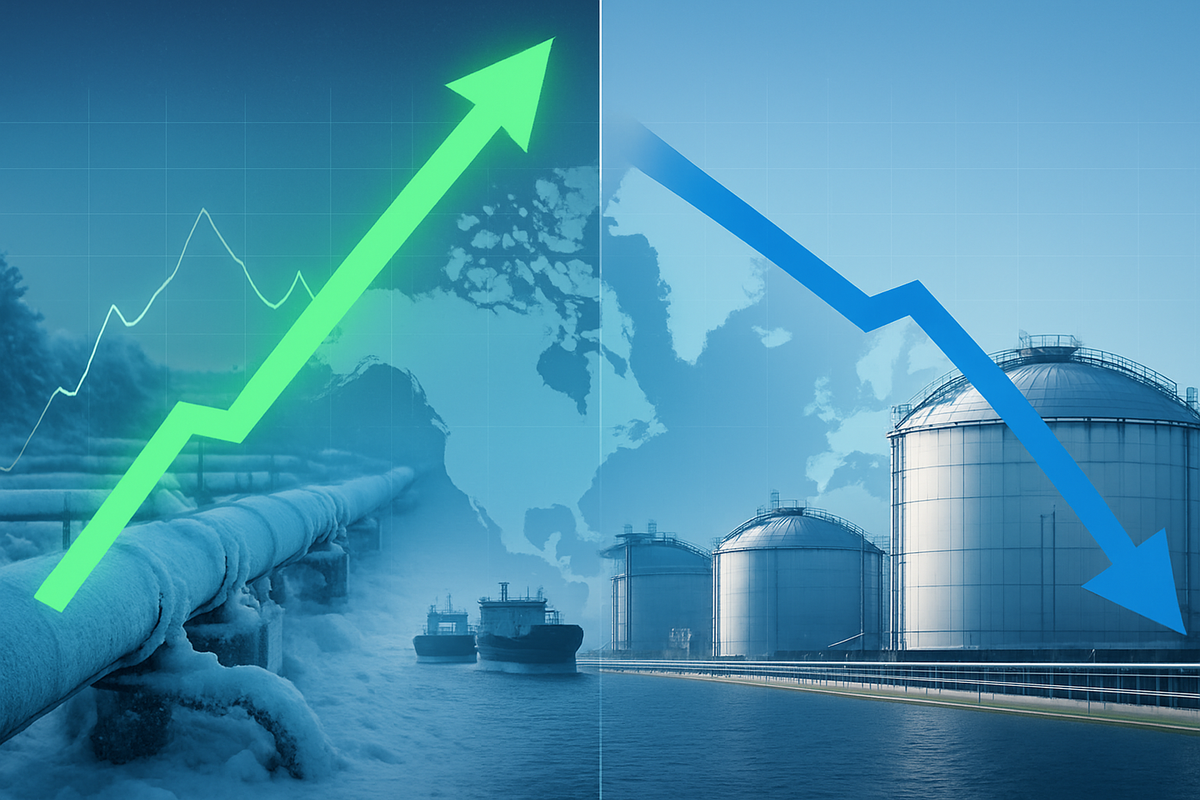
As the winter of 2026 reaches its midpoint, the global natural gas market has fractured into two starkly different realities. In the United States, Henry Hub futures have witnessed a dramatic 12.1% surge over the last two weeks, driven by a combination of unyielding Arctic weather and critical infrastructure bottlenecks. This domestic spike has caught many traders off guard, as unseasonably warm starts to previous winters had led to a sense of complacency regarding storage cushions.
Meanwhile, across the Atlantic, the European benchmark, Title Transfer Facility (TTF), has moved in the opposite direction, recording a simultaneous 9.0% drop. This divergence highlights a decoupling of regional markets that were previously tethered by the global LNG trade. While American consumers face rising heating bills, European markets are benefiting from a "storage surplus" strategy that has successfully insulated the continent from the worst effects of mid-winter volatility, even as geopolitical tensions simmer in the background.
The Anatomy of a Divergence: Weather, Maintenance, and Logistics
The recent 12.1% rally in U.S. natural gas prices is the result of a "perfect storm" of fundamental factors hitting the market simultaneously. An intensifying Arctic outbreak, fueled by a displaced polar vortex, has plunged much of the central and eastern United States into sub-freezing temperatures. This has sent residential and commercial heating demand to its highest levels in three years. According to the latest data, spot prices at the Henry Hub reached approximately $3.90 per MMBtu on January 20, 2026, a sharp reversal from the bearish sentiment that dominated the final quarter of 2025.
Compounding the weather-driven demand is a series of maintenance disruptions on key pipeline corridors. Essential winter maintenance on transmission lines in the Northeast and the Midwest has restricted the flow of gas from high-production basins, such as the Appalachian and Permian, to the high-demand urban centers. This localized scarcity has forced utilities to draw heavily on underground storage, leading to larger-than-expected weekly inventory withdrawals. The structural "bid" for gas is further bolstered by record LNG feedgas demand, with facilities operating at 18–19 billion cubic feet per day (Bcf/d) to meet long-term delivery contracts.
In stark contrast, Europe’s 9.0% price decline is a testament to aggressive inventory management and structural shifts in consumption. Despite localized cold spells in Scandinavia and parts of Central Europe, the continent entered the peak winter months with storage facilities nearly 85% full. As of mid-January, those levels remain a healthy 50–55%, providing a significant psychological and physical buffer for the market. Furthermore, the "demand destruction" seen in European heavy industry over the past two years has become permanent; many chemical and manufacturing plants have yet to return to full capacity, keeping a lid on the total volume of gas required to balance the grid.
Winners and Losers in a Split Market
The current price environment creates a complex landscape for public energy companies. Among the primary beneficiaries are major U.S. producers like EQT Corporation (NYSE: EQT) and Chesapeake Energy (NASDAQ: CHK), who are seeing their realized prices jump just as winter production reaches its seasonal peak. These companies, which have pivoted toward capital discipline and debt reduction, are now well-positioned to generate significant free cash flow from their unhedged volumes. Similarly, midstream players like Kinder Morgan (NYSE: KMI) are benefiting from increased utilization of their storage and pipeline assets as the grid struggles to move gas to frozen northern markets.
For the LNG exporters, the narrative is more nuanced. Cheniere Energy (NYSE: LNG) continues to profit from high utilization rates, but the narrowing spread between U.S. prices and European TTF prices could eventually squeeze the arbitrage profit for spot-market traders. However, since most of Cheniere’s capacity is tied to long-term take-or-pay contracts, the company remains insulated from short-term price fluctuations. On the flip side, European energy giants like Shell (NYSE: SHEL) and TotalEnergies (NYSE: TTE) are navigating a market where lower European prices hurt their upstream margins on the continent, even as they remain key players in the global logistics chain.
The clear "losers" in this scenario are U.S.-based industrial manufacturers and nitrogen fertilizer producers, such as CF Industries (NYSE: CF). Rising input costs for natural gas—a primary feedstock—are beginning to erode the competitive advantage these firms enjoyed when domestic gas was trading closer to the $2.50 mark. If the current price surge persists through the end of the first quarter, investors should expect to see margin pressure reflected in the upcoming earnings calls for energy-intensive sectors.
Geopolitical Friction and the Dallas Fed Outlook
The divergence in prices is occurring against a backdrop of significant geopolitical volatility. While the EU is on track to complete its phase-out of Russian gas by 2027, the market remains "nervous" about the transition. Rumors of shifting U.S. trade policies, including potential tariffs on European goods, have introduced a new layer of uncertainty. There is a growing concern among European diplomats that Washington could eventually use LNG export volumes as a lever in broader trade negotiations, adding a hidden "security premium" to global gas prices that prevents them from falling to pre-crisis levels.
Insights from the Q4 2025 Dallas Fed Energy Survey provide a window into how industry leaders are viewing this volatility. Executives from over 120 oil and gas firms indicated that they expect Henry Hub prices to average $4.19 per MMBtu by the end of 2026. This bullish outlook is rooted in the expectation that the "second mega-wave" of U.S. LNG export terminals will begin operations late this year and early next, effectively permanently linking U.S. production to the global hunger for energy. The survey suggests that the current 12.1% surge isn't just a weather-driven fluke, but rather the beginning of a structural shift toward a higher price floor.
Historically, natural gas was viewed as a regional commodity. However, the events of early 2026 demonstrate that while the infrastructure is now global, the drivers remain stubbornly local. The "Henry Hub-TTF spread," once a reliable indicator for global trade, has become increasingly sensitive to regional maintenance schedules and micro-climates. This shift mirrors the broader trend of "fragmented globalization," where trade continues but is subject to frequent and violent disruptions caused by domestic policy and environmental events.
The Road Ahead: Strategic Pivots and Storage Games
As the market looks toward the spring of 2026, the primary focus will shift from "heating demand" to "storage replenishment." If the U.S. ends the winter with significantly depleted inventories, the pressure on Henry Hub prices will likely continue into the injection season, forcing a strategic pivot for utilities that have grown accustomed to cheap summer gas. We may see a renewed interest in long-term hedging strategies from industrial consumers who were caught off-guard by this January’s 12.1% spike.
In Europe, the challenge will be maintaining the momentum of the green transition without sacrificing industrial competitiveness. If TTF prices remain depressed at the 9% lower level while U.S. prices rise, the "energy cost gap" between the two continents could narrow for the first time in years. This might provide a temporary reprieve for European manufacturers, but the long-term trend remains one of electrification. Watch for companies like Sempra (NYSE: SRE) to accelerate their Pacific-facing LNG projects as a way to bypass the Atlantic volatility and tap into the more stable (but higher-priced) Asian markets.
Short-term opportunities exist for algorithmic traders who can capitalize on the widening volatility between regional hubs. However, for the average investor, the narrative is one of resilience. The ability of the European market to withstand a 9% drop in the face of geopolitical tension suggests that the "energy crisis" of the early 2020s has resulted in a more robust, if more expensive, infrastructure.
Summary and Market Outlook
The current divergence in global natural gas prices serves as a stark reminder that the energy transition is not a linear process. The 12.1% surge in the U.S., contrasted against a 9.0% decline in Europe, highlights the uneven impact of weather and infrastructure on an increasingly interconnected global market. Key takeaways for the coming months include the persistence of U.S. supply constraints and the successful "buffer" created by European storage mandates.
Moving forward, the market will remain sensitive to the Dallas Fed’s forecasted $4.19 average for Henry Hub. Investors should keep a close eye on the weekly EIA storage reports in the U.S. and the progress of new LNG liquefaction trains on the Gulf Coast. As the "polar vortex" effect begins to wane in February, the focus will turn to whether these higher domestic prices are the "new normal" or merely a seasonal anomaly. For now, the "Great Divide" in gas prices remains the defining story of the 2026 energy market, signaling a year of high stakes and even higher volatility.
This content is intended for informational purposes only and is not financial advice.