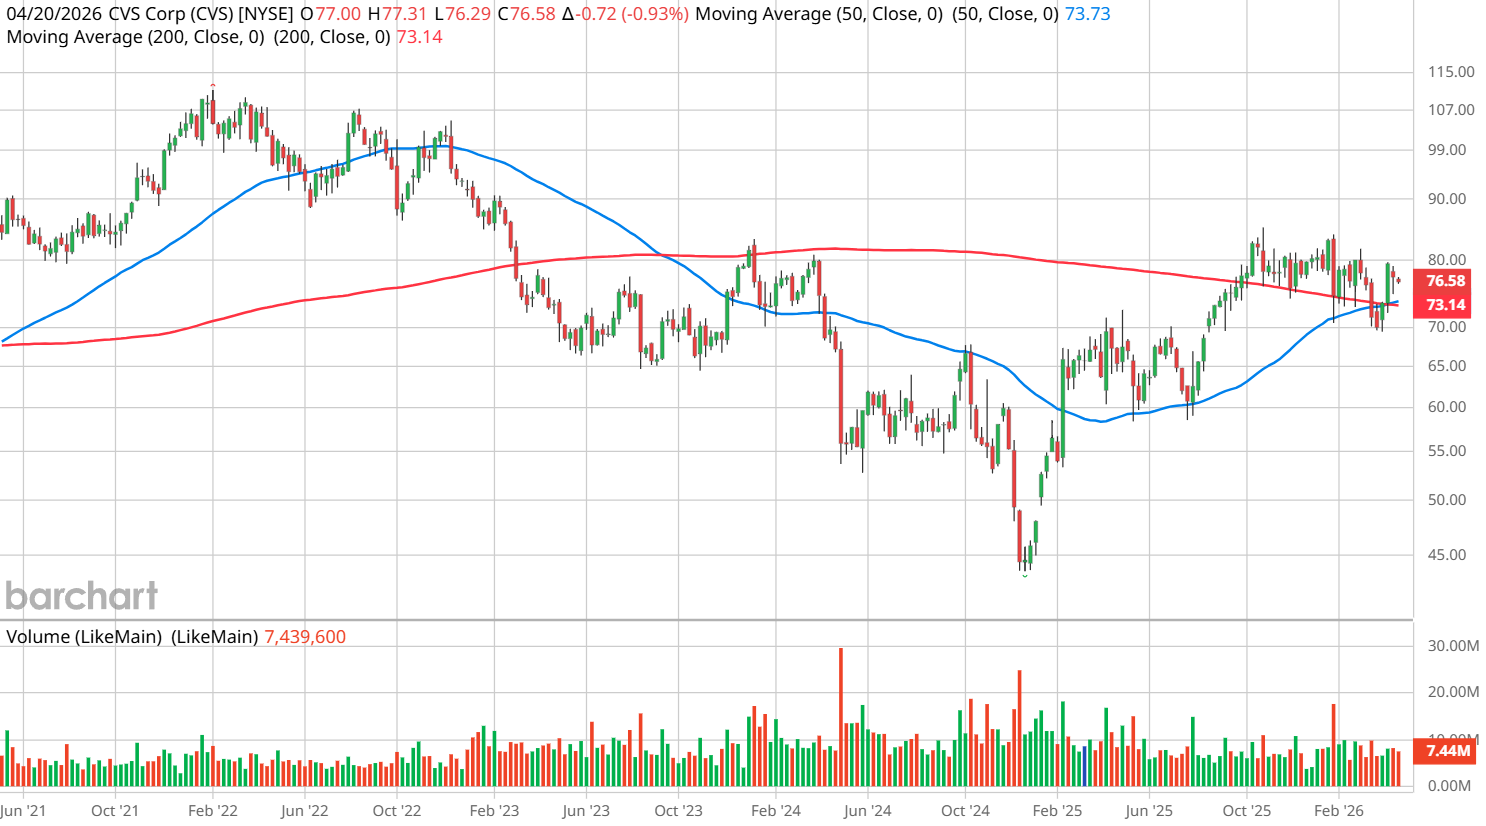
While an intriguing name given the relevance to the underlying industry, CVS Health (CVS) has been off to a frustrating run of performance recently. Since the beginning of this year, CVS stock has dipped 3.5%, a sharp contrast to the roughly 18% gain over the past 52 weeks. Currently, the Barchart Technical Opinion indicator rates shares as a Weak Sell, a consequence of the aforementioned technical slowdown. Still, there might be a contrarian play lurking here.
First, let’s consider the overall fundamental picture. As a business, CVS is no longer just a “corner drugstore.” Instead, it has evolved into an integrated healthcare ecosystem. Its Caremark pharmacy benefit manager (PBM) segment continues to show strong retention and customer conversions. Also, by combining the PBM unit with its primary care arm — known as Oak Street Health — and the insurance business (Aetna), CVS can capture profit at every leg of patient care.
Second, specific catalysts — such as the finalization of Medicare Advantage (MA) payment rates for next year — provided a pleasant boost for forward financial projections. Earlier, concerns about the possibility of near-zero increases in payment rates clouded the healthcare segment. Fortunately for CVS stock, the Centers for Medicare & Medicaid Services (CMS) inked a 2.5% increase in April, thereby significantly alleviating the margin pressure on Aetna.
It should also be noted that over 81% of Aetna’s MA members are in plans rated four stars or higher. As such, this qualifies CVS for substantial quality bonus payments, boosting the company’s bottom line.
Of course, these are well-known narratives that serve to augment the longer-term bullish case for CVS stock. However, for those seeking nearer-term rewards, the market may have flashed an intriguing signal.
A Quick Intro to the Inductive Methodology
Obviously, any effort to decipher what may happen in the unknown future is inherently speculative. By logical deduction, all such forecasts are necessarily inductive. Induction is simply a fancy term for pattern recognition. Philosophically, it relies on the uniformity of nature — the assumption that the future will behave like the past.
While the term isn’t always mentioned on a daily basis, we use induction frequently. For example, on your way to work, you may notice that highway patrol officers tend to hide in certain areas. Thus, when you approach these hot zones, you slow down accordingly. You recognized the signal and are simply playing the probability game, even though you don’t know with 100% certainty whether there’s a cop lurking or not.
It's the same principle in the market. In technical analysis, perhaps the most commonly cited pattern is the head and shoulders. When traders see this signal, they are taught there is a strong probability that the target security will tumble. That’s one form of induction.
Personally, I have shifted my methodology to a discretized inductive analysis. What this means is that we take the scalar signal of price and convert it into a discrete signal. Next, we isolate a specific quantified pattern and calculate a forward distribution based on past correlations.
Admittedly, it’s a clumsy description. The cleanest way to describe what I do is to take the last 10 weeks of stock behavior to understand what the probabilities may be about what happens over the next 10 weeks. Let’s run through the example of CVS stock.
Formulating a Trading Strategy
Using a dataset going back to January 2019, a random 10-week long position in CVS stock is likely to land between $76 and $79 (assuming a starting point of $76.58, Monday’s close). Probability density will likely peak at around $77.40. Just as importantly, out of 362 rolling 10-week sequences, 205 have landed above the aforementioned spot price.
In other words, the exceedance ratio of CVS stock currently stands at 56.6%, which is a decent stat. Those who decide to randomly hold shares for 10 weeks enjoy a modest likelihood of profitability.
However, we’re not interested in randomly holding CVS stock. Instead, we’re looking for favorably timed trades. In the last 10 weeks, CVS printed only three up weeks, leading to an overall downward slope. Under this specific sequence of events, the forward distribution over the next 10 weeks changes. From the same starting point of $76.58, we would expect shares to land between $75 and $81, with peak probability density clocking in at $77.50.
While there’s not much difference in peak density, the overall length of the distribution has gotten wider to the positive end. For those who want to play the long game, the odds on the reward curve have become more favorable, thus enticing a speculative approach.
It’s a risky and ambitious idea but I find the 77.50/80 bull call spread expiring June 18 appealing. For a relatively low net debit of $114, traders will be betting that CVS stock rises through the $80 strike at expiration. If it does, the maximum profit would be $136, a payout of over 119%. Breakeven lands at $78.64, helping to improve overall probabilistic credibility.
On the date of publication, Josh Enomoto did not have (either directly or indirectly) positions in any of the securities mentioned in this article. All information and data in this article is solely for informational purposes. For more information please view the Barchart Disclosure Policy here.
More news from Barchart
- Massive and Unusual Trading in Home Depot Call Options - Is the HD Stock Rally Over?
- Slow-Moving CVS Health (CVS) Stock Could Offer a Surprise for Bullish Options Traders
- Palo Alto Networks Stock Looks Cheap Ahead of Earnings - Shorting PANW Puts Works
- Nvidia and Google Options Highlight 2 Great Trades Ideas for Bulls Here