
It seems like just yesterday when I last wrote about the iShares Silver Trust ETF (SLV) and how its price was flying higher. It was 10 days ago. But it’s already time for an update, and to share an additional option strategy, one I executed personally during the frenetic holiday season melee that was SLV’s rise.
On Monday, silver prices and the SLV fell again, even faster than they rose, before turning back around. Once again, these modern markets, with the dominance of algorithmic trading and retail investor participation, have turned what used to be a months-long move into one which spans mere days.
Let’s take a look at the recent past, then look forward to get a sense of what the trade could be in this star ETF of 2025. Silver, and thus SLV, which tracks the metal’s price, has had a banner year. I’d call it a golden year, but you know, that would be confusing.
Even after Monday’s intraday 9%-10% pullback, SLV is up more than 140% during 2025, with just a few days left.
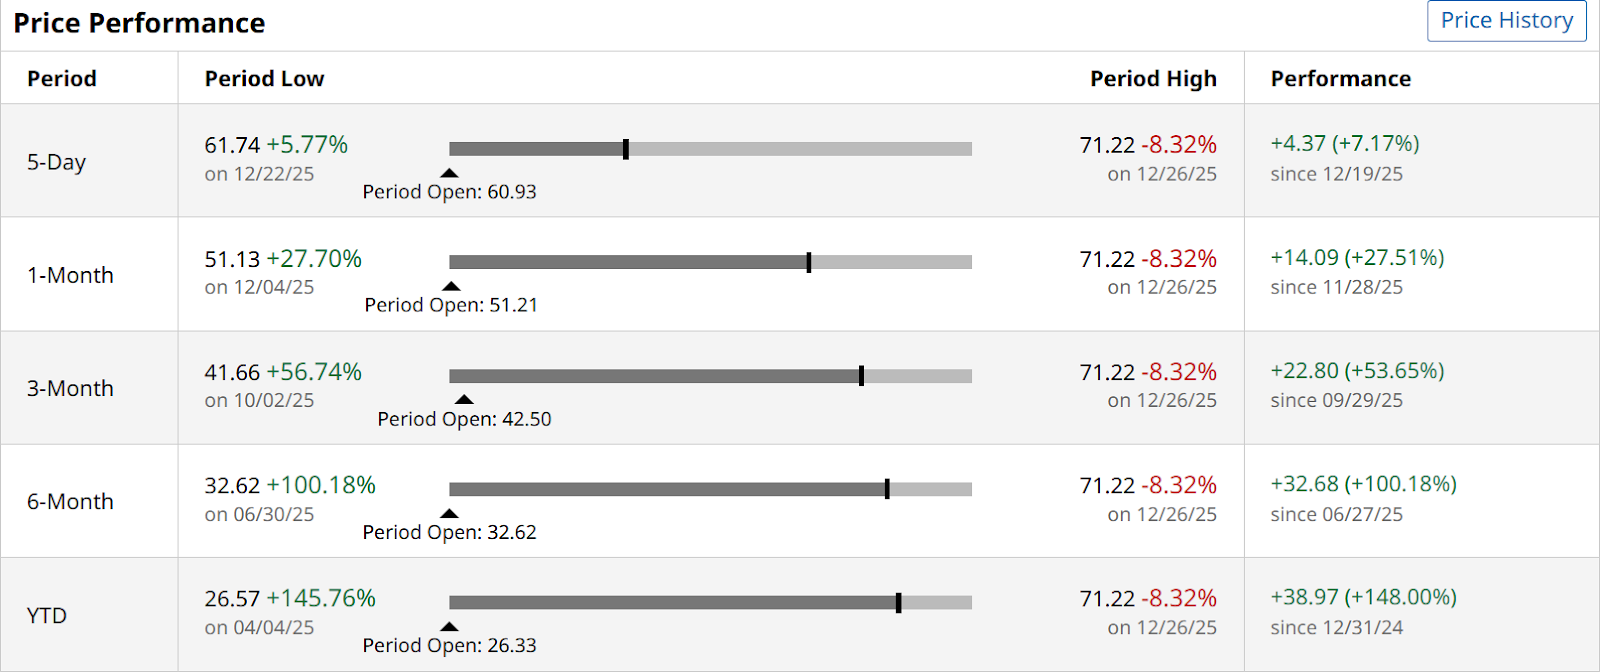
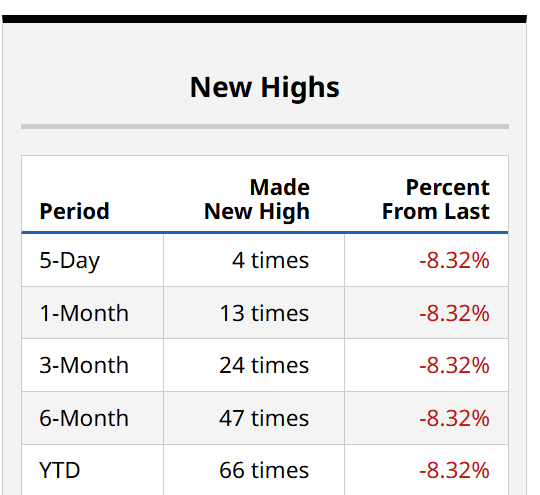
What’s more, it has made a new YTD high 66 times this year. That’s about every 4 days throughout the year, on average. That’s an uptrend!
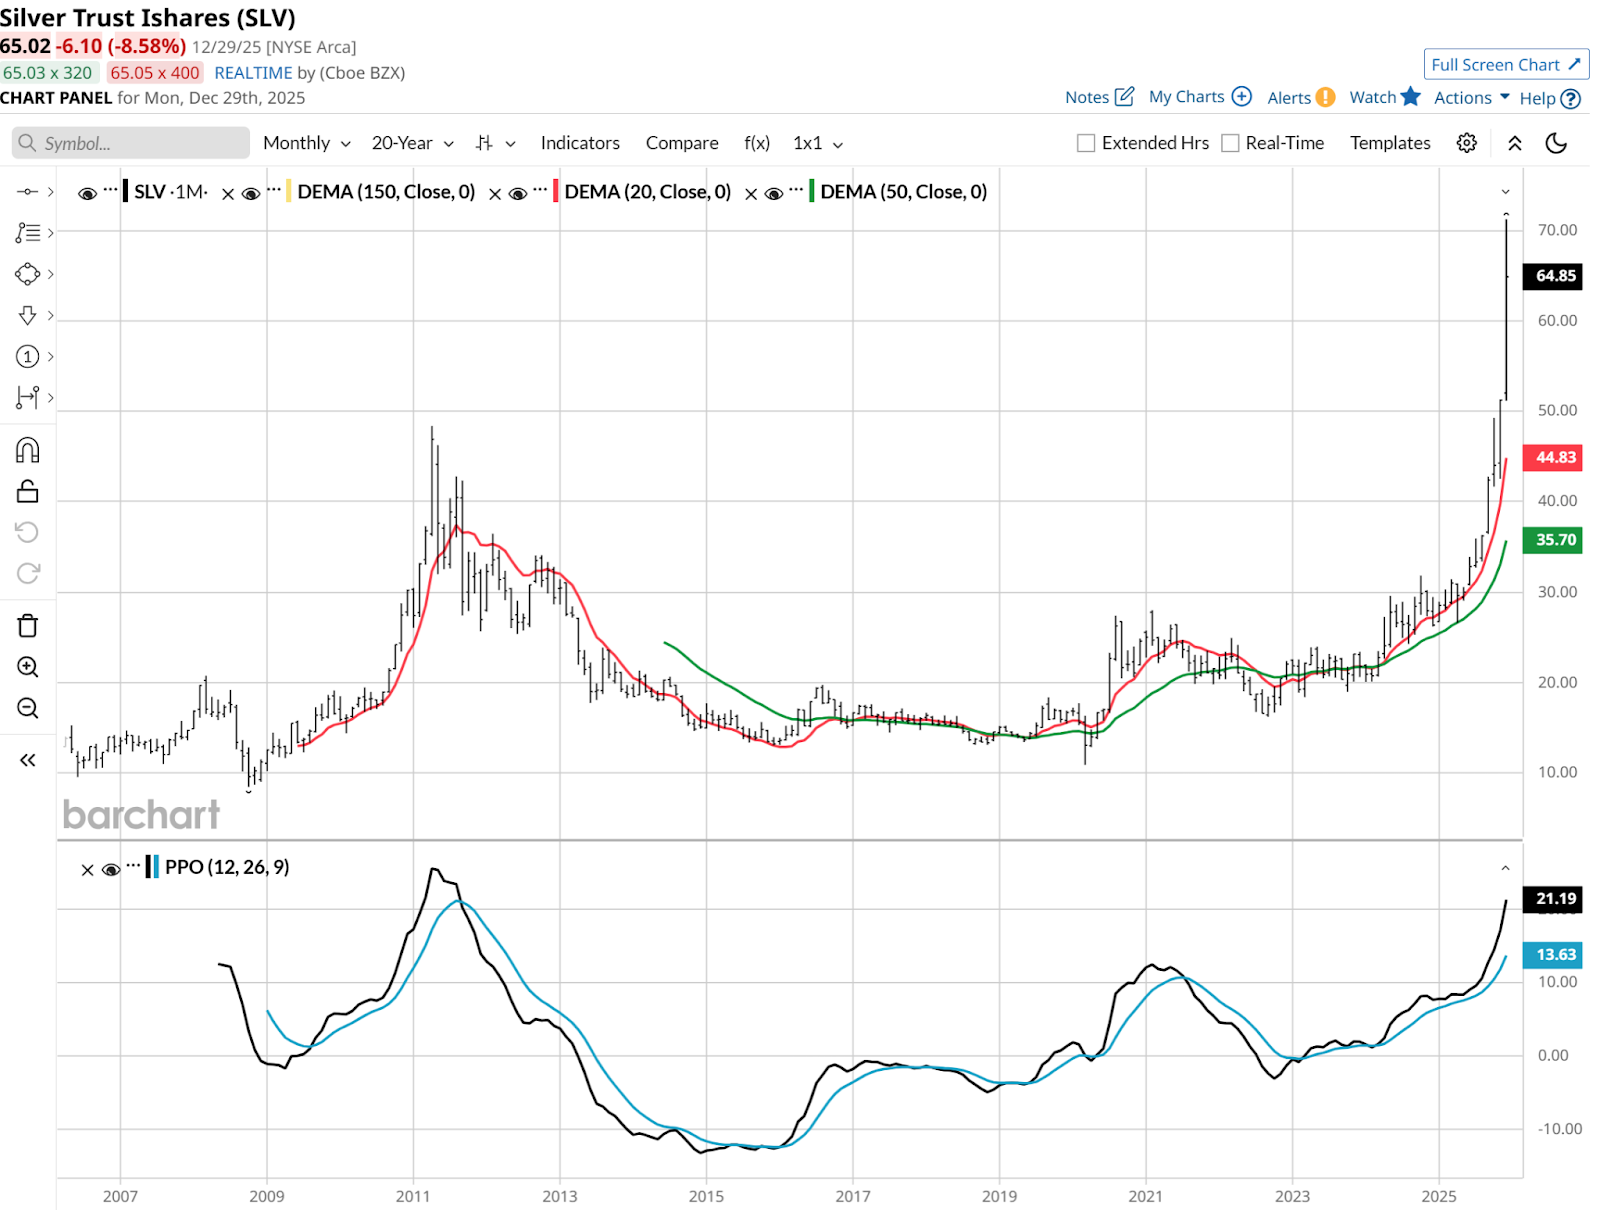
Here’s the daily chart, showing what I affectionately call the “Empire State Building” price trend. That’s because it has gone up in such a sharp fashion, it looks like the top of NYC’s famous building. The judges will also accept “that’s a move only King Kong could make,” climbing up to the top. Doubling in price since August made that picture possible.
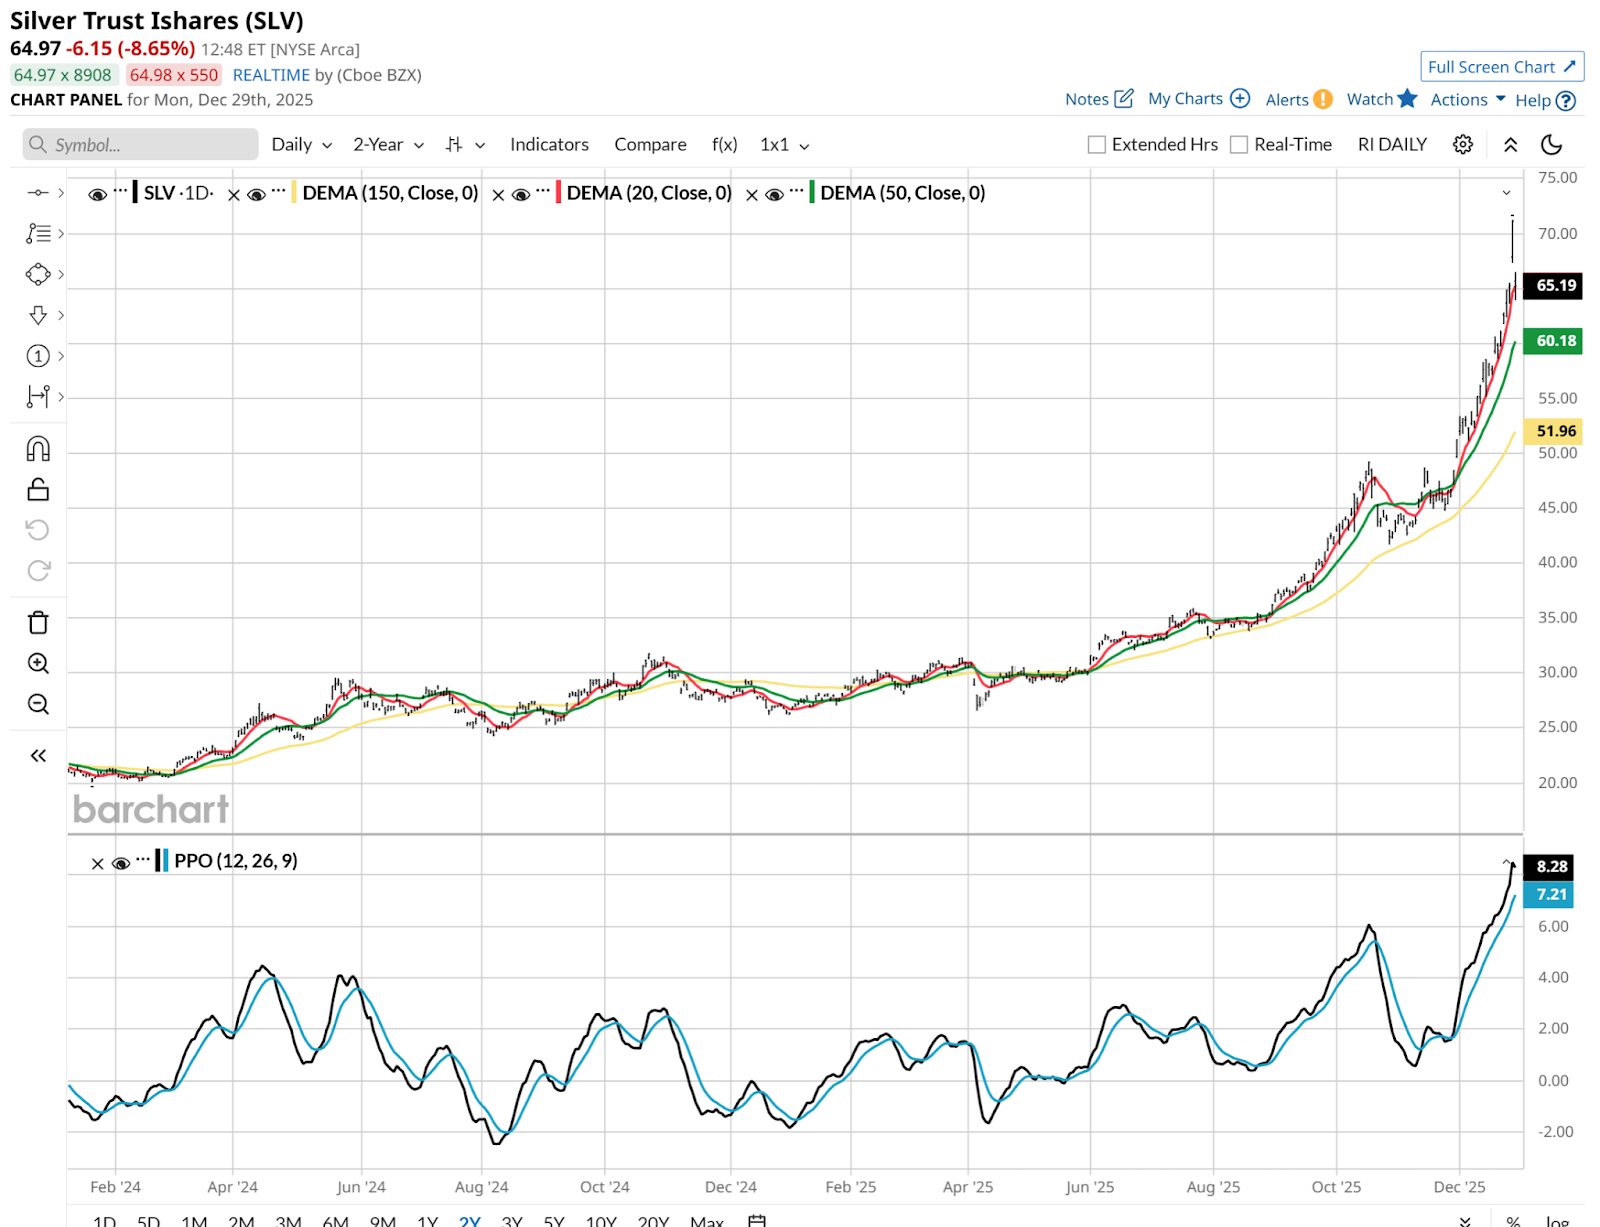
And now, it’s what I’d call a “stretched” chart. What’s more, it’s in uncharted territory, as I noted in my previous article on SLV. So as a technician, it is more difficult in a parabolic move like this. Specifically, one that took SLV about 50% above its previous all-time high price, which was way back in 2011.
SLV Has an Empire State Building Chart Pattern
Is this a breakdown, the other side of the Empire State Building pattern? Or, just one of those 10% pauses that refreshes, as they say?
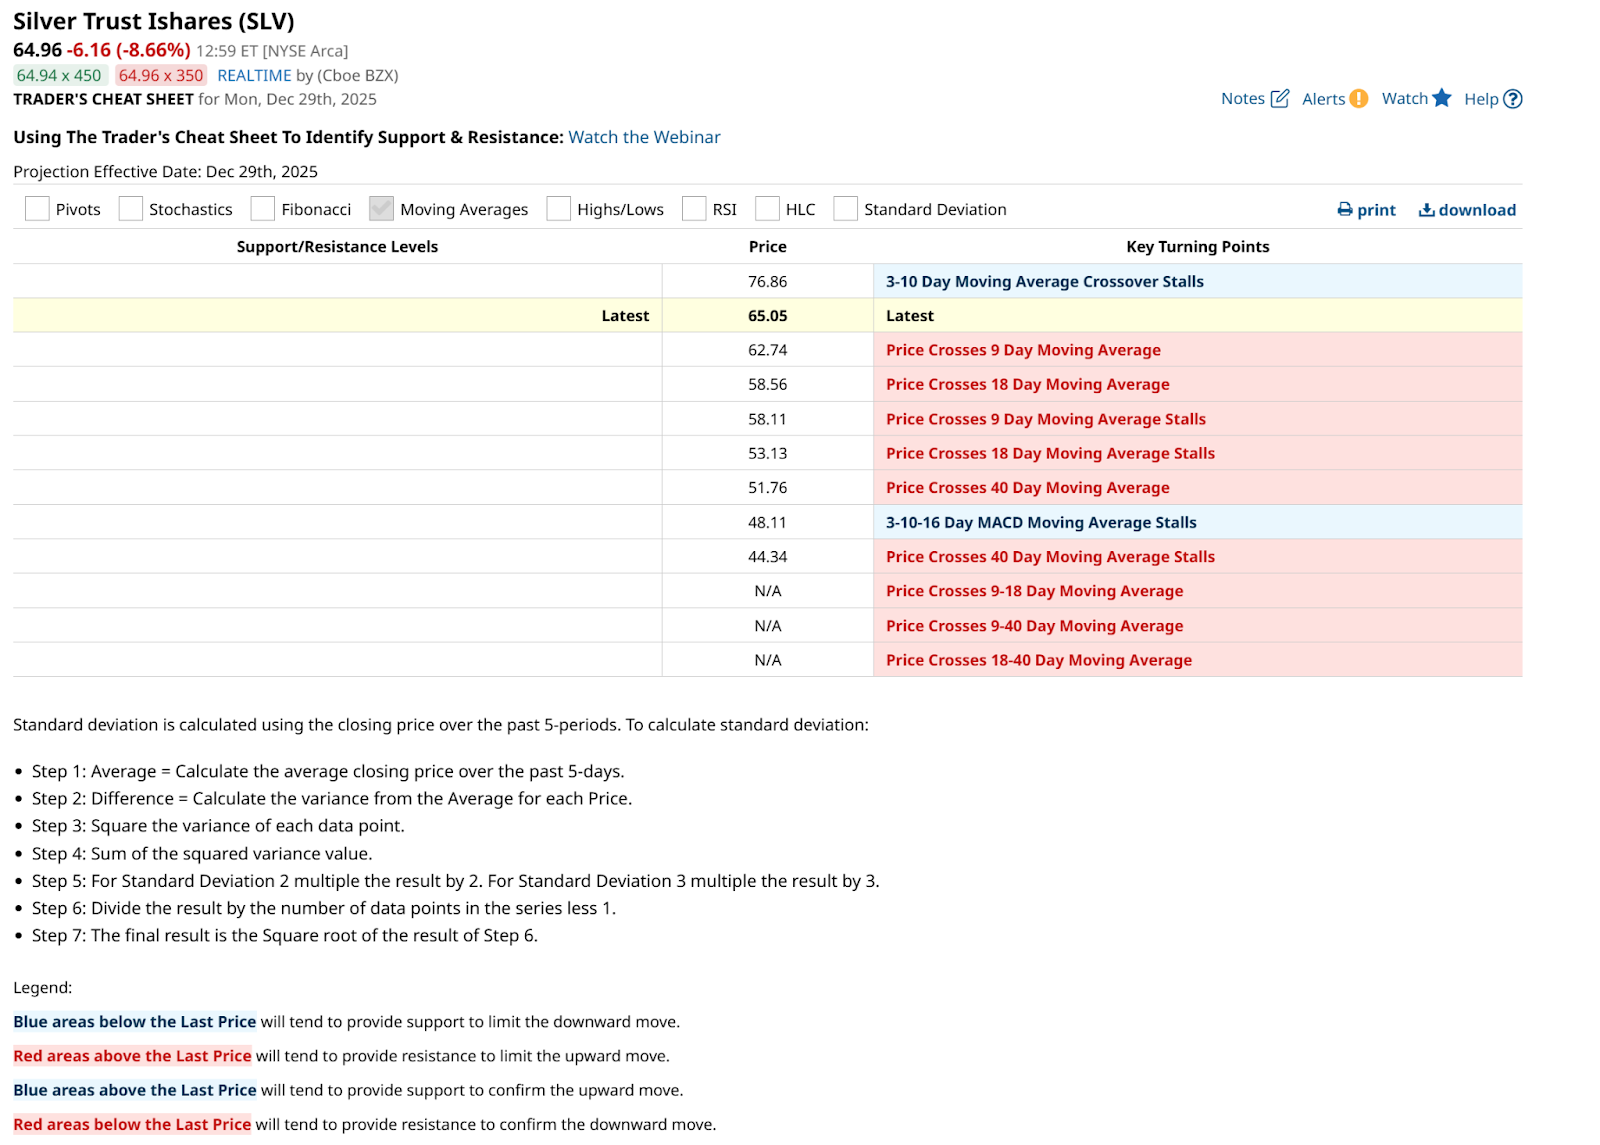
We see in this table below that a lot of moving average crosses occurred on Monday. So that at least needs to be respected. The flip side of that for SLV is that algos and retail investors don’t tend to “respect” what worked in the past as much these days. Otherwise, SLV would not have made the move it did.
I aim to be in the business not of predicting the future, but of evaluating a range of possible outcomes. And that leads me to this monthly chart which includes the aforementioned high from 2011. As I see it, this is very much a “can go either way” moment for SLV.
That’s not a cop out, it’s a case for managing risk, while trying to hang in there with SLV. In fact, in that SLV article from Dec. 19, I included this collar possibility. $76 cap, $60 floor, 20% upside, 6% downside and cost (rounded), and a 3/20/2026 expiration date.
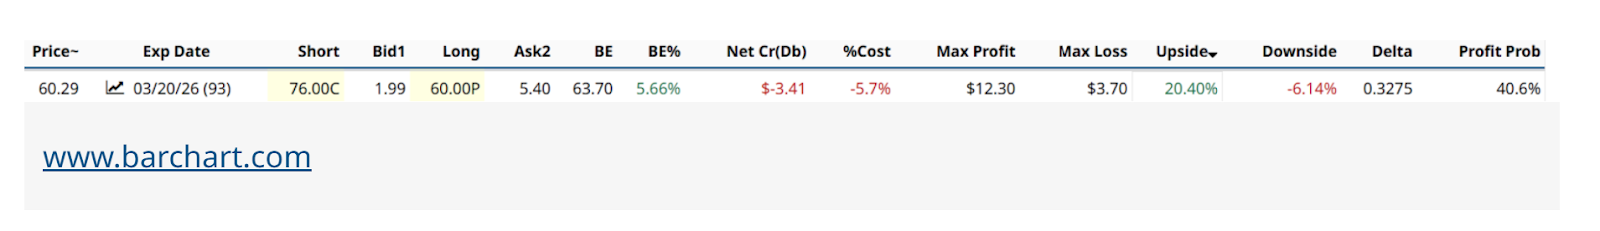
I have it updated below, as of mid-day Monday (12/29/25), but before we look at that, note the “BE” (break-even) price from above. It was $63.70.
This collar has nearly 3 months left, so it moves more slowly, even when the ETF price of SLV doesn’t. As I write this, SLV was around $65. So getting much closer to that $60 put strike, and far away from the $76 call strike.

The puts bought for $5.40 then would be worth $4.20 now, since they were on their way to worthless last week, as SLV surged upward. And the covered calls are actually now at $3.70 versus $1.99 from 10 days ago. So even though the ETF is now less at risk of being called away at $76 by March, the volatility spike has rendered this as an unrealized loss.
The Takeaway
To me, this is an outstanding case study. Not of the specifics, but of why a trader would consider a collar in the first place. Owning this over the past 10 days might have removed a lot of the emotion of potentially seeing SLV drop way back down, maybe to $50 or below. Because for about the next 12 weeks, the collar owner has the choice to sit and watch, to see if they end up getting a great advantage.
If SLV drops to $50, those puts are worth at least $10 a share. Not bad at all. And the $1.99 a share that the covered calls brought in would be on its way to being kept. And of course, the collar could be rolled at any time, one leg or the other.
So for an owner of that one, it could be a time to wait and see. If SLV is not in the portfolio, the elevated volatility produces nice return/risk tradeoffs like this:

In this collar example, one of many we can filter and run on Barchart.com to survey the playing field in depth, that same upside limit (which would be an all-time high) could be had versus a tightened up downside limit of $65, and for a shorter period of time (late January 2026).
Once again, collars can take risks. And that allows for some good sleeping, which we all deserve during this time of year.
Rob Isbitts, founder of Sungarden Investment Publishing, is a semi-retired chief investment officer. For more of Rob’s research and investor coaching work, see ETFYourself.com on Substack. To copy-trade Rob’s portfolios, check out the new Pi Trade app.
On the date of publication, Rob Isbitts did not have (either directly or indirectly) positions in any of the securities mentioned in this article. All information and data in this article is solely for informational purposes. For more information please view the Barchart Disclosure Policy here.
More news from Barchart
- Silver Linings Playbook: How to Speculate Safely, Even on Record-High Silver Prices
- Altria’s (MO) Unusual Options Activity Just Tipped Its Hand to a Hidden Multi-Dimensional Opportunity
- Apple is an Analyst Favorite, But AAPL Stock Has Been Flat - Shorting Puts Is the Best Play
- QuantumScape Gained 100% in 2025 and Is Set to Generate Revenue for the First Time in 2025. Options Data Suggests You Should Play QS Stock Like This for 2026.


