

Chart currently trades at $206.79 per share and has shown little upside over the past six months, posting a middling return of 3.7%.
Is now the time to buy GTLS? Or does the price properly account for its business quality and fundamentals? Find out in our full research report, it’s free.
Why Is GTLS a Good Business?
Installing the first bulk Co2 tank for McDonalds’s sodas, Chart (NYSE: GTLS) provides equipment to store and transport gasses.
1. Surging Backlog Locks In Future Sales
In addition to reported revenue, backlog is a useful data point for analyzing Gas and Liquid Handling companies. This metric shows the value of outstanding orders that have not yet been executed or delivered, giving visibility into Chart’s future revenue streams.
Chart’s backlog punched in at $5.89 billion in the latest quarter, and over the last two years, its year-on-year growth averaged 22.5%. This performance was fantastic and shows the company has a robust sales pipeline because it is accumulating more orders than it can fulfill. Its growth also suggests that customers are committing to Chart for the long term, enhancing the business’s predictability. 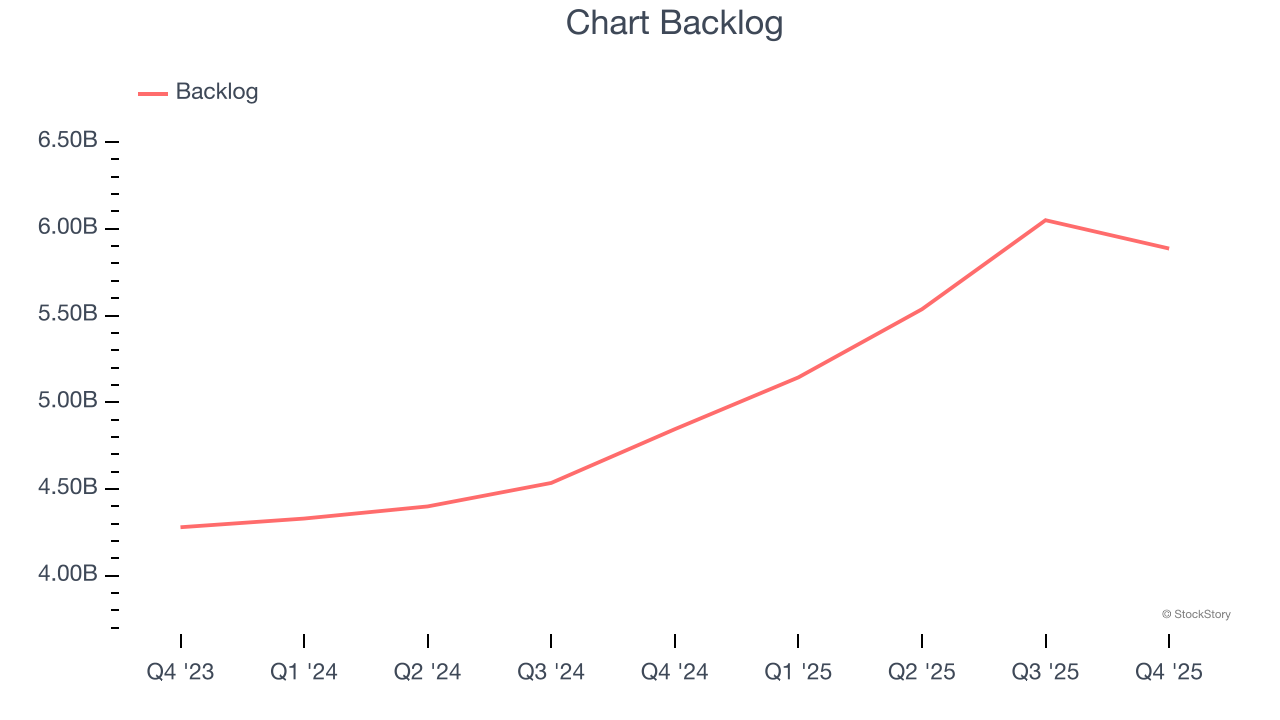
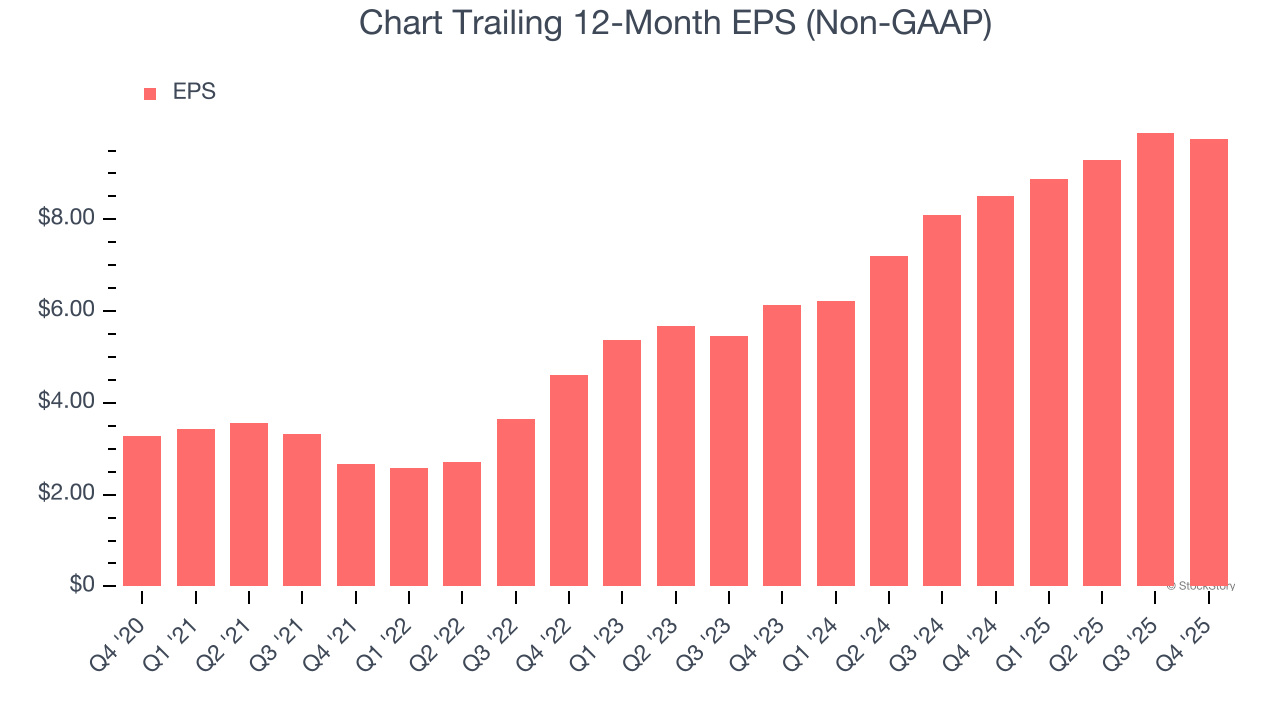
2. Outstanding Long-Term EPS Growth
We track the long-term change in earnings per share (EPS) because it highlights whether a company’s growth is profitable.
Chart’s EPS grew at an astounding 24.4% compounded annual growth rate over the last five years. This performance was better than most industrials businesses.
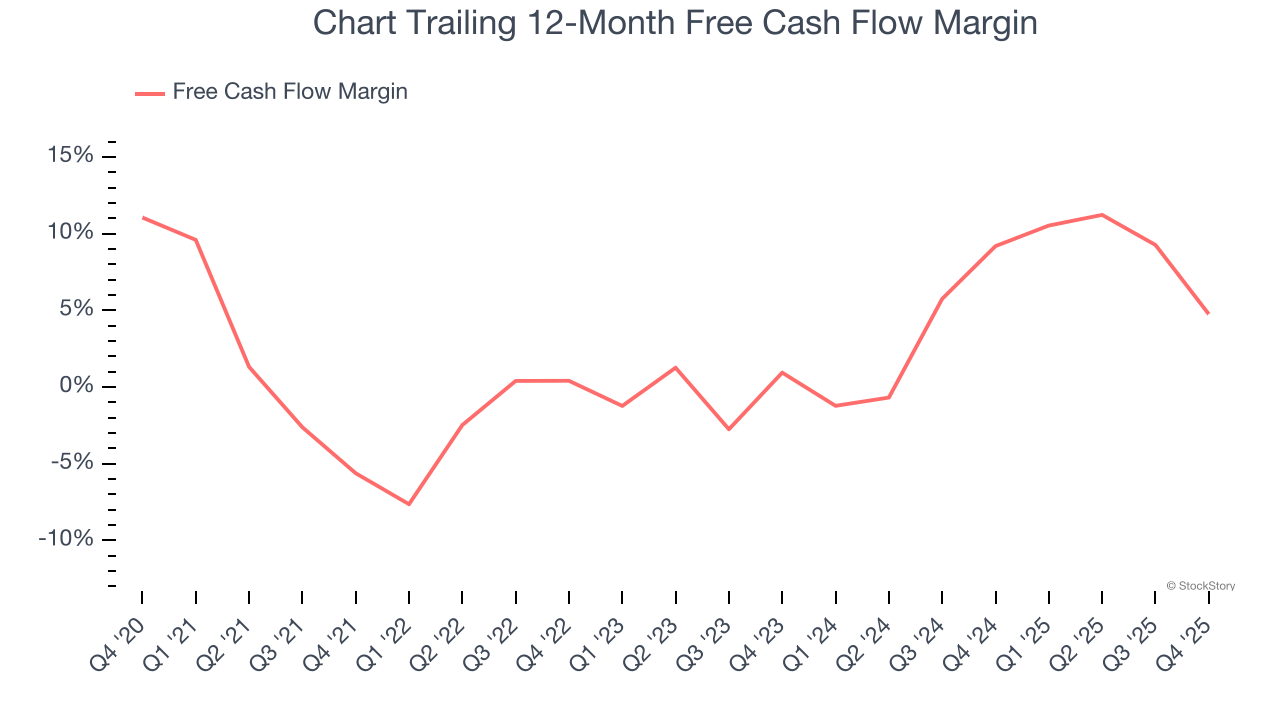
3. Increasing Free Cash Flow Margin Juices Financials
Free cash flow isn't a prominently featured metric in company financials and earnings releases, but we think it's telling because it accounts for all operating and capital expenses, making it tough to manipulate. Cash is king.
As you can see below, Chart’s margin expanded by 10.4 percentage points over the last five years. The company’s improvement shows it’s heading in the right direction, and we can see it became a less capital-intensive business because its free cash flow profitability rose more than its operating profitability. Chart’s free cash flow margin for the trailing 12 months was 4.8%.
Final Judgment
These are just a few reasons why we think Chart is a great business, but at $206.79 per share (or 15.9× forward P/E), is now the time to initiate a position? See for yourself in our comprehensive research report, it’s free.
Stocks We Like Even More Than Chart
WHILE YOU’RE HERE: Top 9 Market-Beating Stocks. The best stocks don't just beat the market once. They do it again. And again. Robust revenue growth, rising free cash flow, returns on capital that leave their competition in the dust. The market has already rewarded these businesses.
But our AI platform says the party isn't over. Find out which 9 stocks made the cut this week — FREE. Get Our Top 9 Market-Beating Stocks for Free HERE.
Stocks that have made our list include now familiar names such as Nvidia (+1,326% between June 2020 and June 2025) as well as under-the-radar businesses like the once-small-cap company Comfort Systems (+782% five-year return). Find your next big winner with StockStory today.


