
 Luxury fashion brand retailer Capri Holdings Limited (NASDAQ: CPRI) stock has fallen (-37%) for the year. With high end premium brands like Versace, Michael Kors, and Jimmy Choo, Capri Holdings caters to the higher-income demographic. It’s high-end consumers are helping drive double-digit sales gains while peers experience single-digit to negative top line growth suffering from inflationary pressures and rising logistics costs. These households tend to weather recessions and economic downturns more resiliently than lower-income households. This also enables Capri a longer runway to ride consumer spending trends. However, the Company lowered its forecasts opting to err on the side of caution despite achieving its highest revenues, gross margin, and EPS levels in its history. The Company was able to expand gross margins despite COVID-related restrictions in China, the Ukraine conflict, and higher supply chain costs at 14.2% above expectations. Shares are trading at just 6X forward earnings. While the Americas and EMEA showed 30% and 33% growth, Asia only showed 2% growth due to the COVID restrictions in China which led to nearly 40% of its stores operating on reduced hours or being closed. The lifting of lockdowns should result in a rebound in the second half of the calendar year. Prudent investors seeking a cheap entry in a luxury brand retailer can watch for opportunistic pullbacks in shares of Capri Holdings.
Q4 Fiscal 2022 Earnings Release
On June 1, 2022, Capri Holdings released its fiscal fourth-quarter 2022 results for the quarter ending March 2022. The Company reported earnings-per-share (EPS) of $1.02 excluding non-recurring items beating consensus analyst estimates for $0.82 by $0.20. Revenues grew 24.6% year-over-year (YoY) to $1.49 billion beating estimates for $1.41 billion. The Company authorized a new two-year $1 billion stock buyback program to replace its $500 million buyback program. Capri Holdings CEO John Idol commented, "Looking forward in fiscal 2023 we expect to achieve another year of record revenue and earnings per share. Longer term we are confident in our ability to resume double digit revenue increases as we move beyond the impact of current macro headwinds. The power of Versace, Jimmy Choo and Michael Kors as well as the proven resilience of the luxury market reinforce our optimism for the future and our ability to achieve $7 billion in revenue and a 20% operating margin over time."
Downside Guidance
Capri Holdings lowered its guidance for fiscal Q1 2023 EPS to $1.35 versus $1.45 consensus analyst estimates on revenues coming in at $1.3 billion versus $1.35 billion analyst estimates. The Company lowered fiscal full-year 2022 EPS to $6.85 versus $6.57 consensus analyst estimates on revenues of $5.95 billion compared to $6.08 billion analyst estimates.
Conference Call Takeaways
CEO Idol pointed out how the Company expertly navigated supply chain issues and COVID restrictions to pull in the strongest quarter in Company history. Revenues continued to rise 30% in the Americas and would have been higher if not for inventory restraints. Revenues rose 33% in the EMEA with robust domestic consumer demand despite the Ukraine turmoil. Asia showed the slowest growth at only 2% due to the COVID lockdowns in China as a strong start to the quarter quickly sank as nearly 40% of its stores were temporarily closed or had reduced operating hour. He believes the Company will move beyond macroeconomic headwinds and its brands will prove resilient in the luxury market as it sets goals to hit $7 billion in revenues on a 20% operating margin.
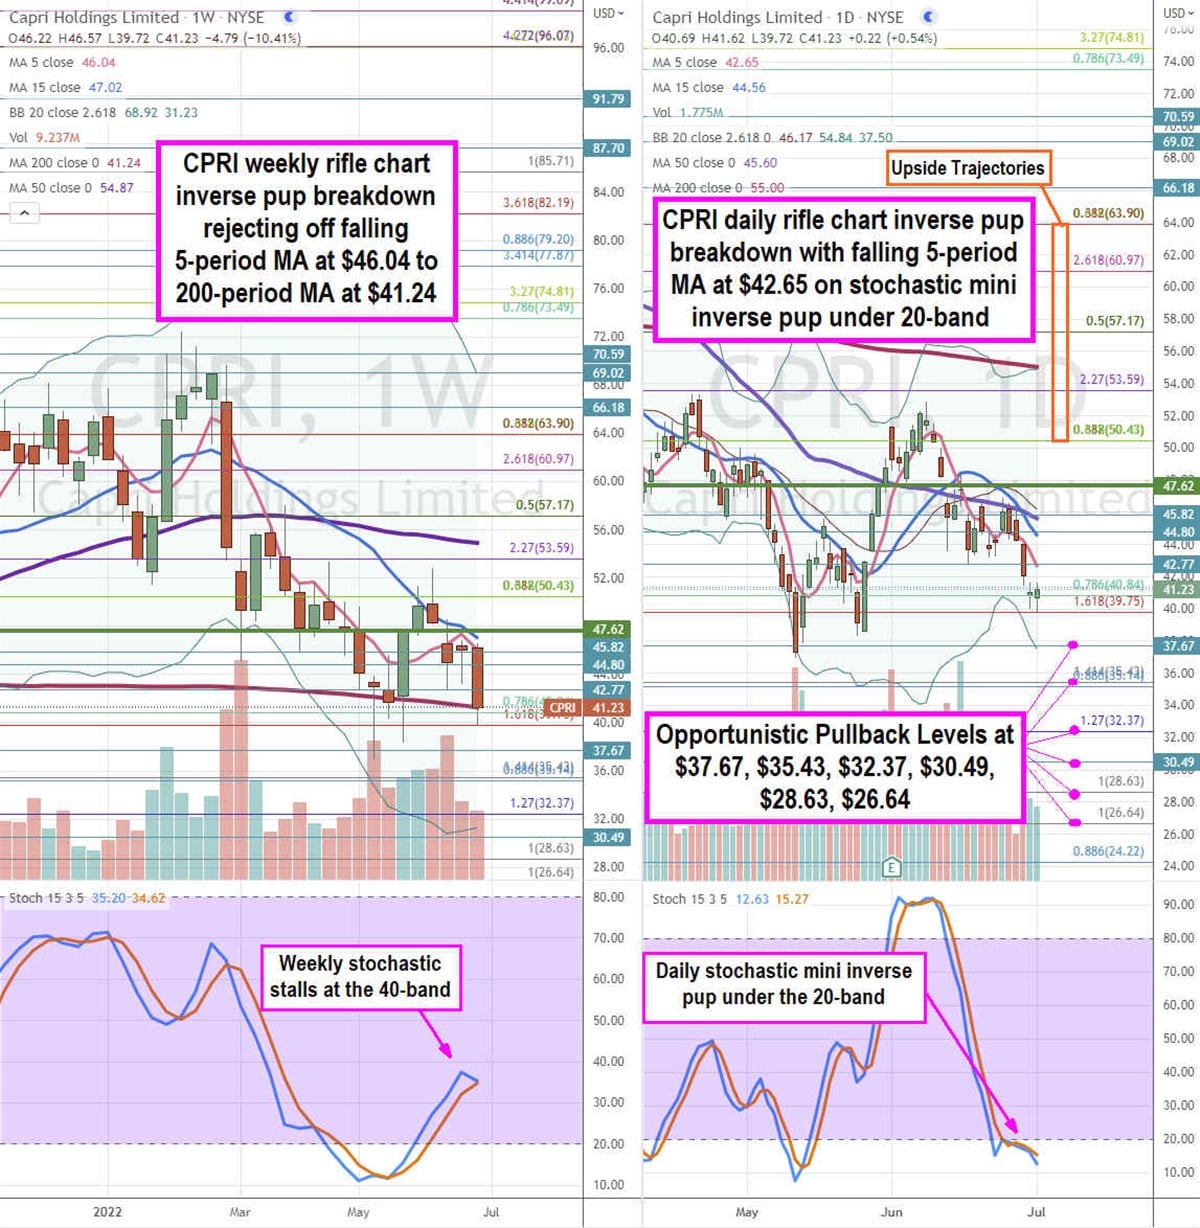
CPRI Opportunistic Pullback Price Levels
Using the rifle charts on the weekly and daily time frames provides a precision view of the landscape for CPRI stock. The weekly rifle chart triggered an inverse pup breakdown attempting to hold support off the $39.75 Fibonacci (fib) level. The weekly inverse pup has a falling 5-period moving average (MA) resistance at $46.04 followed by the 15-period MA at $47.02 with a weekly 200-period MA at $41.24. Shares rejected off the weekly 5-period MA to overshoot and attempt to base at the weekly 200-period MA. The weekly stochastic stalled under the 40-band with a possible cross down or a mini pup on the make or break. The weekly 50-period MA sits at $54.87 with weekly lower Bollinger Bands (BBs) at $31.23 and upper BBs at $68.92. The weekly market structure low (MSL) buy triggers on the breakout above $47.62. The daily rife chart downtrend has a falling 5-period MA at $42.65 and 15-period MA at $44.56 with daily lower BBs at $37.50. The daily stochastic rejected back under the 20-band on a mini inverse pup. Prudent investors can watch for opportunistic pullback levels sit at the $37.67, $35.43 fib, $32.37 fib, $30.49 fib, $28.63 fib, and the $26.64 fib level. Upside trajectories range from the $50.43 fib up towards the $63.90 fib level.


