Spotify Technology S.A. (NYSE: SPOT):
This press release features multimedia. View the full release here: https://www.businesswire.com/news/home/20220427005371/en/
(Graphic: Business Wire)
Dear Shareholders,
Our business exhibited strength and resiliency in Q1. Nearly all of our key metrics surpassed guidance, led by MAU outperformance, healthy revenue growth, and better Gross Margin. Excluding the impact of our exit from Russia, subscriber growth exceeded expectations as well. Overall, we are very pleased with the performance of the business and remain highly encouraged by the traction we are seeing.
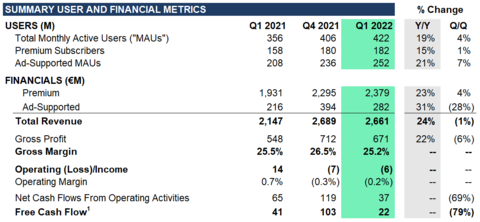
First Quarter 2022 Earnings Highlights
- MAUs grew 19% Y/Y to 422 million or 419 million excluding a one-time benefit of 3 million MAUs
- Premium Subscribers grew 15% Y/Y to 182 million (inclusive of approximately 1.5 million disconnects from the wind-down of our Russian operations)
- Premium ARPU grew 6% Y/Y in Q1 and 3% Y/Y on a constant currency basis
- Gross Margin finished at 25.2%
- Announced agreement with Google for User Choice Billing and a long-term partnership agreement with FC Barcelona
MONTHLY ACTIVE USERS (“MAUs”)
Total MAUs grew 19% Y/Y to 422 million in the quarter, up from 406 million last quarter and above our guidance by 4 million. During March, there was a brief service outage that caused users to be involuntarily logged out of Spotify. As a result, we believe certain affected users created new accounts to log back in, resulting in approximately 3 million additional MAUs in the quarter. Following the one month anniversary of the outage in April, we saw a reversal of the approximate 3 million MAU benefit. Excluding this event, we believe MAUs would have reached 419 million in Q1, with growth exceeding our expectations by approximately 1 million users. The business benefited from outperformance in Latin America and Rest of World, led by Indonesia, Brazil, and Mexico. MAU growth was particularly strong in our Gen Z audience, fueled by successful product feature launches such as our Lyrics experience, as well as marketing and content initiatives.
PREMIUM SUBSCRIBERS
Our Premium Subscribers grew 15% Y/Y to 182 million in the quarter, up from 180 million last quarter. While this is slightly below our guidance, after excluding the involuntary churn of approximately 1.5 million subscribers as a result of our exit from Russia, growth was above expectations and aided by outperformance in Latin America and Europe.
During Q1, we entered into a multiyear agreement with Google for User Choice Billing, bringing our Android users greater flexibility in payment choice and enabling a frictionless user experience for all in-app transactions. We anticipate this new offering to launch later this year. Users who have downloaded Spotify from the Google Play Store will be presented with a choice to pay either with Spotify’s payment system or with Google Play Billing for the very first time. We also announced a promotional partnership with Walmart (offering 6 month trials to Walmart+ members in the United States) and a data access program with Airtel (whereby Airtel is offering all Spotify customers complimentary connectivity to Spotify in Nigeria).
FINANCIAL METRICS
Revenue
Revenue of €2,661 million grew 24% Y/Y in Q1 (or 19% Y/Y on a constant currency basis) and was above our guidance. Premium Revenue grew 23% Y/Y to €2,379 million (or 18% Y/Y constant currency) while Ad-Supported Revenue grew 31% Y/Y to €282 million (or 22% Y/Y constant currency).
Within Premium, average revenue per user (“ARPU”) of €4.38 in Q1 was up 6% Y/Y (or up 3% Y/Y constant currency). Excluding the impact of FX, we saw a benefit to ARPU from our price increases in 2021 and favorable product mix shift.
We achieved our largest Q1 ever for Ad-Supported Revenue (11% of Total Revenue) and saw strong Y/Y growth across all regions and channels. Music Ad-Supported Revenue benefited from a Y/Y increase in impressions and healthy double-digit growth in CPMs. Podcast revenue strength was led by the Spotify Audience Network along with continued growth across existing Spotify studios and our exclusive licensing deals. Starting in January, we began to roll out a new on-platform podcast ad experience in the United States called call-to-action (CTA) cards. CTA cards make podcast ads interactive for the first time and allow listeners to directly discover products and services of interest without having to remember promo codes.
During the quarter, we announced the acquisition of Podsights, a leading podcast advertising measurement service that helps advertisers better measure and scale their podcast advertising. Additionally, we acquired Chartable, a podcast analytics platform that enables publishers to know and grow their podcast audiences through promotional attribution and audience insight tools.
Gross Margin
Gross Margin finished at 25.2% in Q1, slightly above guidance and down 29 bps Y/Y. The Y/Y Gross Margin trend reflected a favorable revenue mix shift towards podcasts and growing marketplace activity, which was offset by increased non-music content spend, investments in music product enhancements, and modestly higher Other Cost of Revenue.
Premium Gross Margin was 28.4% in Q1, up 51 bps Y/Y, and Ad-Supported Gross Margin was (1.5)% in Q1, or down 584 bps Y/Y. As a reminder, all content costs related to podcast investment are included in the Ad-Supported business for the current and historical periods.
Operating Expenses
Operating Expenses totaled €677 million in Q1, an increase of 27% Y/Y. Social Charges were lower than forecast given the decrease in our share price during the quarter. Excluding the impact of Social Charge movements, Operating Expenses were slightly higher than forecast due to higher personnel costs, which was partially offset by lower advertising expenses.
As a reminder, Social Charges are payroll taxes associated with employee salaries and benefits, including share-based compensation. We are subject to social taxes in several countries in which we operate, although Sweden accounts for the bulk of the social costs. We don’t forecast stock price changes in our guidance so upward or downward movements will impact our reported operating expenses.
At the end of Q1, our workforce consisted of 8,230 FTEs globally.
Free Cash Flow
Free Cash Flow was €22 million in Q1, a €19 million decrease Y/Y primarily due to unfavorable changes in net working capital arising from higher licensor payments. Capital expenditures decreased €14 million due to finalization of various office build-outs.
At the end of Q1, we maintained a strong liquidity position with €3.6 billion in cash and cash equivalents, restricted cash, and short term investments.
PRODUCT AND PLATFORM UPDATES
Two-Sided Marketplace
In Q1, we increased the number of artists and labels who can create Sponsored Recommendations by rolling out our self-serve campaign management tool to all eligible artists in the United States. As a result, we doubled the number of new customers while maintaining an 85% retention rate from existing customers. Additionally, we rolled out Spotify for Artists in 9 additional languages (bringing total supported languages to 26) and published the latest 2021 data reflecting our contribution to music industry economics on our Loud & Clear website.
Podcasting
At the end of Q1, we had 4.0 million podcasts on the platform (up from 3.6 million at the end of Q4). Growth in the number of MAUs that engaged with podcast content continued to outstrip total MAU growth, podcast consumption rates grew in the double digits Y/Y, and podcast share of overall consumption hours on our platform reached another all-time high. We saw a double-digit Y/Y increase in new podcasts across key growth markets in Latin America and Rest of World, with more than 85% of new podcast creation occuring on our Anchor platform.
Product Enhancements
In Q1, we collaborated with IKEA on the integration of Spotify on their newest Bluetooth Speaker lamp, Vappeby, which is now the first Bluetooth speaker on the market that comes with Spotify Tap. Additionally, new or existing Porsche vehicles with the Porsche Communication Management 6.0 Infotainment system will now be able stream Spotify as an audio source. We also expanded our Blend feature to allow up to 10 people together in a group to merge their music into one shared playlist and for users to integrate this feature with some of their favorite artists.
Global Marketing Partnerships
On March 15th, we announced a long-term partnership with FC Barcelona whereby Spotify will become a Main Partner of the Club and its Official Audio Streaming Partner. The Spotify brand will appear on the front of both men’s and women’s team jerseys and training kits beginning in the 2022-2023 season. Spotify will also become Title Partner of the Stadium, with the historic Camp Nou stadium rebranded to Spotify Camp Nou. This partnership will allow Spotify to amplify artist voices, connect artists to new and existing fans, and help grow our global user base across key growth markets and audience segments.
Q2 2022 OUTLOOK
The following forward-looking statements reflect Spotify’s expectations for Q2 2022 as of April 27, 2022 and are subject to substantial uncertainty. These expectations reflect the full closure of Spotify’s services in Russia, which was completed on April 11, 2022.
-
Total MAUs: 428 million
- Reflects a loss from the closure of Russian operations as well as the full reversal of the March service outage benefit (combined these two items reflect approximately 8 million of the 422 million MAUs reported in Q1 2022); excluding the impact of these items, our Q2 guidance implies the addition of approximately 14 million net new MAUs in the quarter
-
Total Premium Subscribers: 187 million
- Assumes an additional 600k disconnects from full closure of Russian operations in April; excluding Russia, our Q2 guidance implies the addition of approximately 6 million net new subscribers in the quarter
-
Total Revenue: €2.80 billion
- Assumes approximately 600 bps tailwind to growth Y/Y due to movements in foreign exchange rates
-
Gross Margin: 25.2%
- As a reminder Q2 2021 Gross Margin benefitted 190 bps due to the release of accruals for prior period publishing royalty estimates
-
Operating Profit/Loss: €(197) million
- Inclusive of the Operating Loss is approximately a €50 million impact to Operating Expenses due to unfavorable movements in foreign exchange rates
EARNINGS QUESTION & ANSWER SESSION
We will host a live question and answer session starting at 8:00 a.m. ET today on investors.spotify.com. Daniel Ek, our Founder and CEO, and Paul Vogel, our Chief Financial Officer, will be on hand to answer questions submitted through slido.com using the event code #SpotifyEarningsQ122. Participants also may join using the listen-only conference line by registering through the following site:
Direct Event Registration Portal: https://conferencingportals.com/event/txExvogt
We use investors.spotify.com and newsroom.spotify.com websites as well as other social media listed in the “Resources – Social Media” tab of our Investors website to disclose material company information.
Use of Non-IFRS Measures
To supplement our financial information presented in accordance with IFRS, we use the following non-IFRS financial measures: Revenue excluding foreign exchange effect, Premium revenue excluding foreign exchange effect, Ad-Supported revenue excluding foreign exchange effect, and Free Cash Flow. Management believes that Revenue excluding foreign exchange effect, Premium revenue excluding foreign exchange effect, and Ad-Supported revenue excluding foreign exchange effect are useful to investors because they present measures that facilitate comparison to our historical performance. However, Revenue excluding foreign exchange effect, Premium revenue excluding foreign exchange effect, and Ad-Supported revenue excluding foreign exchange effect should be considered in addition to, not as a substitute for or superior to, Revenue, Premium revenue, Ad-Supported revenue or other financial measures prepared in accordance with IFRS. Management believes that Free Cash Flow is useful to investors because it presents a measure that approximates the amount of cash generated that is available to repay debt obligations, to make investments, and for certain other activities that exclude certain infrequently occurring and/or non-cash items. However, Free Cash Flow should be considered in addition to, not as a substitute for or superior to, net cash flows (used in)/from operating activities or other financial measures prepared in accordance with IFRS. For more information on these non-IFRS financial measures, please see “Reconciliation of IFRS to Non-IFRS Results” table below.
Forward-Looking Statements
This shareholder letter contains estimates and forward-looking statements. All statements other than statements of historical fact are forward-looking statements. The words “may,” “might,” “will,” “could,” “would,” “should,” “expect,” “plan,” “anticipate,” “intend,” “seek,” “believe,” “estimate,” “predict,” “potential,” “continue,” “contemplate,” “possible,” and similar words are intended to identify estimates and forward-looking statements.
Our estimates and forward-looking statements are mainly based on our current expectations and estimates of future events and trends, which affect or may affect our businesses and operations. Although we believe that these estimates and forward-looking statements are based upon reasonable assumptions, they are subject to numerous risks and uncertainties and are made in light of information currently available to us. Many important factors may adversely affect our results as indicated in forward-looking statements. These factors include, but are not limited to: our ability to attract prospective users, retain existing users, and monetize our products and services; competition for users, user listening time, and advertisers; risks associated with our international operations and our ability to manage our growth; our emphasis on innovation and long-term user engagement over short-term results; our ability to predict, recommend, and play content that our users enjoy; our ability to be profitable or generate positive cash flow on a sustained basis; our ability to convince advertisers of the benefits of our advertising offerings; our ability to forecast or optimize advertising inventory amid emerging industry trends in digital advertising; our ability to generate revenues from podcasts and other non-music content; potential disputes or liabilities associated with content made available on our Service; risks relating to acquisitions, investments, and strategic alliances; the impact of the COVID-19 pandemic and other public health crises; our dependence upon third-party licenses for most of the content we stream; our lack of control over third-party content providers who are concentrated and can unilaterally affect our access to content; our ability to comply with complex license agreements; our ability to accurately estimate royalty payments under our license agreements and relevant statutes; the limitations on our operating flexibility due to financial commitments required under certain of our license agreements; our ability to identify the compositions and ownership thereof embodied in sound recordings in order to obtain licenses or comply with existing license agreements; assertions by third parties of infringement or other violations by us of their intellectual property rights; our ability to protect our intellectual property; the dependence of streaming on operating systems, online platforms, hardware, networks, regulations, and standards that we do not control; our ability to maintain user data security; undetected errors, bugs or vulnerabilities in our products; interruptions, delays, or discontinuations in service arising from our systems or systems of third parties; changes in laws or regulations affecting us; risks relating to privacy and data security; our ability to maintain, protect, and enhance our brand; our ability to achieve our net zero emissions target or make progress in other environmental, social, and governance initiatives; payment-related risks; our dependence on key personnel and ability to attract, retain, and motivate highly skilled employees; our ability to access to capital to support growth; risks relating to currency exchange rate fluctuations and foreign exchange controls; the impact of economic, social, or political conditions, such as the current conflict between Russia and Ukraine; our ability to accurately estimate user metrics and other estimates; our ability to manage and remediate attempts to manipulate streams and attempts to gain or provide unauthorized access to certain features of our Service; risks related to our Exchangeable Notes; tax-related risks; the concentration of voting power among our founders, which limits shareholders’ ability to influence our governance and business; and risks related to our status as a foreign private issuer and a Luxembourg company. A detailed discussion of these and other risks and uncertainties that could cause actual results and events to differ materially from our estimates and forward-looking statements is included in our filings with the U.S. Securities and Exchange Commission (“SEC”), including our Annual Report on Form 20-F filed with the SEC on February 3, 2022, as updated by subsequently filed reports for our interim results on Form 6-K. We undertake no obligation to update forward-looking statements to reflect events or circumstances occurring after the date of this shareholder letter.
Rounding
Certain monetary amounts, percentages, and other figures included in this letter have been subject to rounding adjustments. The sum of individual metrics may not always equal total amounts indicated due to rounding.
Consolidated statement of operations |
|||||||||
(Unaudited) |
|||||||||
(in € millions, except share and per share data) |
|||||||||
|
|
Three months ended |
|||||||
|
|
March 31, 2022 |
|
December 31, 2021 |
|
March 31, 2021 |
|||
Revenue |
|
2,661 |
|
|
2,689 |
|
|
2,147 |
|
Cost of revenue |
|
1,990 |
|
|
1,977 |
|
|
1,599 |
|
Gross profit |
|
671 |
|
|
712 |
|
|
548 |
|
Research and development |
|
250 |
|
|
253 |
|
|
196 |
|
Sales and marketing |
|
296 |
|
|
340 |
|
|
236 |
|
General and administrative |
|
131 |
|
|
126 |
|
|
102 |
|
|
|
677 |
|
|
719 |
|
|
534 |
|
Operating (loss)/income |
|
(6 |
) |
|
(7 |
) |
|
14 |
|
Finance income |
|
175 |
|
|
20 |
|
|
104 |
|
Finance costs |
|
(14 |
) |
|
(21 |
) |
|
(31 |
) |
Finance income/(costs) - net |
|
161 |
|
|
(1 |
) |
|
73 |
|
Income/(loss) before tax |
|
155 |
|
|
(8 |
) |
|
87 |
|
Income tax expense |
|
24 |
|
|
31 |
|
|
64 |
|
Net income/(loss) attributable to owners of the parent |
|
131 |
|
|
(39 |
) |
|
23 |
|
Earnings/(loss) per share attributable to owners of the parent |
|
|
|
|
|
|
|||
Basic |
|
0.68 |
|
|
(0.20 |
) |
|
0.12 |
|
Diluted |
|
0.21 |
|
|
(0.21 |
) |
|
(0.25 |
) |
Weighted-average ordinary shares outstanding |
|
|
|
|
|
|
|||
Basic |
|
192,476,022 |
|
|
191,952,473 |
|
|
190,565,397 |
|
Diluted |
|
197,077,256 |
|
|
192,144,654 |
|
|
191,815,695 |
|
Consolidated statement of financial position |
||||||
(Unaudited) |
||||||
(in € millions) |
||||||
|
|
March 31, 2022 |
|
December 31, 2021 |
||
Assets |
|
|
|
|
||
Non-current assets |
|
|
|
|
||
Lease right-of-use assets |
|
443 |
|
|
437 |
|
Property and equipment |
|
369 |
|
|
372 |
|
Goodwill |
|
978 |
|
|
894 |
|
Intangible assets |
|
109 |
|
|
89 |
|
Long term investments |
|
682 |
|
|
916 |
|
Restricted cash and other non-current assets |
|
82 |
|
|
77 |
|
Deferred tax assets |
|
8 |
|
|
13 |
|
|
|
2,671 |
|
|
2,798 |
|
Current assets |
|
|
|
|
||
Trade and other receivables |
|
556 |
|
|
621 |
|
Income tax receivable |
|
5 |
|
|
5 |
|
Short term investments |
|
816 |
|
|
756 |
|
Cash and cash equivalents |
|
2,721 |
|
|
2,744 |
|
Other current assets |
|
270 |
|
|
246 |
|
|
|
4,368 |
|
|
4,372 |
|
Total assets |
|
7,039 |
|
|
7,170 |
|
Equity and liabilities |
|
|
|
|
||
Equity |
|
|
|
|
||
Share capital |
|
— |
|
|
— |
|
Other paid in capital |
|
4,789 |
|
|
4,746 |
|
Treasury shares |
|
(262 |
) |
|
(260 |
) |
Other reserves |
|
709 |
|
|
853 |
|
Accumulated deficit |
|
(3,089 |
) |
|
(3,220 |
) |
Equity attributable to owners of the parent |
|
2,147 |
|
|
2,119 |
|
Non-current liabilities |
|
|
|
|
||
Exchangeable Notes |
|
1,146 |
|
|
1,202 |
|
Lease liabilities |
|
587 |
|
|
579 |
|
Accrued expenses and other liabilities |
|
30 |
|
|
37 |
|
Provisions |
|
6 |
|
|
7 |
|
|
|
1,769 |
|
|
1,825 |
|
Current liabilities |
|
|
|
|
||
Trade and other payables |
|
695 |
|
|
793 |
|
Income tax payable |
|
13 |
|
|
23 |
|
Deferred revenue |
|
469 |
|
|
458 |
|
Accrued expenses and other liabilities |
|
1,882 |
|
|
1,841 |
|
Provisions |
|
22 |
|
|
22 |
|
Derivative liabilities |
|
42 |
|
|
89 |
|
|
|
3,123 |
|
|
3,226 |
|
Total liabilities |
|
4,892 |
|
|
5,051 |
|
Total equity and liabilities |
|
7,039 |
|
|
7,170 |
|
Consolidated statement of cash flows |
|||||||||
(Unaudited) |
|||||||||
(in € millions) |
|||||||||
|
|
Three months ended |
|||||||
|
|
March 31, 2022 |
|
December 31, 2021 |
|
March 31, 2021 |
|||
Operating activities |
|
|
|
|
|
|
|||
Net income/(loss) |
|
131 |
|
|
(39 |
) |
|
23 |
|
Adjustments to reconcile net income/(loss) to net cash flows |
|
|
|
|
|
|
|||
Depreciation of property and equipment and lease right-of-use assets |
|
27 |
|
|
25 |
|
|
22 |
|
Amortization of intangible assets |
|
10 |
|
|
8 |
|
|
8 |
|
Share-based compensation expense |
|
68 |
|
|
50 |
|
|
48 |
|
Finance income |
|
(175 |
) |
|
(20 |
) |
|
(104 |
) |
Finance costs |
|
14 |
|
|
21 |
|
|
31 |
|
Income tax expense |
|
24 |
|
|
31 |
|
|
64 |
|
Other |
|
4 |
|
|
3 |
|
|
2 |
|
Changes in working capital: |
|
|
|
|
|
|
|||
Decrease/(increase) in trade receivables and other assets |
|
59 |
|
|
(63 |
) |
|
15 |
|
(Decrease)/increase in trade and other liabilities |
|
(103 |
) |
|
92 |
|
|
(67 |
) |
Increase in deferred revenue |
|
6 |
|
|
17 |
|
|
37 |
|
(Decrease)/increase in provisions |
|
(3 |
) |
|
8 |
|
|
(1 |
) |
Interest paid on lease liabilities |
|
(13 |
) |
|
(13 |
) |
|
(11 |
) |
Interest received |
|
1 |
|
|
— |
|
|
— |
|
Income tax paid |
|
(13 |
) |
|
(1 |
) |
|
(2 |
) |
Net cash flows from operating activities |
|
37 |
|
|
119 |
|
|
65 |
|
Investing activities |
|
|
|
|
|
|
|||
Business combinations, net of cash acquired |
|
(85 |
) |
|
(14 |
) |
|
(59 |
) |
Purchases of property and equipment |
|
(10 |
) |
|
(16 |
) |
|
(24 |
) |
Purchases of short term investments |
|
(133 |
) |
|
(112 |
) |
|
(115 |
) |
Sales and maturities of short term investments |
|
78 |
|
|
88 |
|
|
90 |
|
Proceeds from sale of long term investment |
|
— |
|
|
144 |
|
|
— |
|
Change in restricted cash |
|
(5 |
) |
|
— |
|
|
— |
|
Other |
|
(1 |
) |
|
(3 |
) |
|
(6 |
) |
Net cash flows (used in)/from investing activities |
|
(156 |
) |
|
87 |
|
|
(114 |
) |
Financing activities |
|
|
|
|
|
|
|||
Payments of lease liabilities |
|
(10 |
) |
|
(10 |
) |
|
(8 |
) |
Lease incentives received |
|
2 |
|
|
— |
|
|
— |
|
Proceeds from exercise of stock options |
|
43 |
|
|
64 |
|
|
51 |
|
Proceeds from issuance of Exchangeable Notes, net of costs |
|
— |
|
|
— |
|
|
1,223 |
|
Repurchases of ordinary shares |
|
(2 |
) |
|
(65 |
) |
|
— |
|
Payments for employee taxes withheld from restricted stock unit releases |
|
(11 |
) |
|
(14 |
) |
|
(16 |
) |
Net cash flows from/(used in) financing activities |
|
22 |
|
|
(25 |
) |
|
1,250 |
|
Net (decrease)/increase in cash and cash equivalents |
|
(97 |
) |
|
181 |
|
|
1,201 |
|
Cash and cash equivalents at beginning of the period |
|
2,744 |
|
|
2,512 |
|
|
1,151 |
|
Net foreign exchange gains on cash and cash equivalents |
|
74 |
|
|
51 |
|
|
90 |
|
Cash and cash equivalents at period end |
|
2,721 |
|
|
2,744 |
|
|
2,442 |
|
Calculation of basic and diluted earnings/(loss) per share |
|||||||||
(Unaudited) |
|||||||||
(in € millions, except share and per share data) |
|||||||||
|
|
Three months ended |
|||||||
|
|
March 31, 2022 |
|
December 31, 2021 |
|
March 31, 2021 |
|||
Basic earnings/(loss) per share |
|
|
|
|
|
|
|||
Net income/(loss) attributable to owners of the parent |
|
131 |
|
|
(39 |
) |
|
23 |
|
Share used in computation: |
|
|
|
|
|
|
|||
Weighted-average ordinary shares outstanding |
|
192,476,022 |
|
|
191,952,473 |
|
|
190,565,397 |
|
Basic earnings/(loss) per share attributable to owners of the parent |
|
0.68 |
|
|
(0.20 |
) |
|
0.12 |
|
|
|
|
|
|
|
|
|||
Diluted earnings/(loss) per share |
|
|
|
|
|
|
|||
Net income/(loss) attributable to owners of the parent |
|
131 |
|
|
(39 |
) |
|
23 |
|
Fair value gains on dilutive warrants |
|
— |
|
|
(2 |
) |
|
(22 |
) |
Fair value gains on dilutive Exchangeable Notes |
|
(90 |
) |
|
— |
|
|
(49 |
) |
Net income/(loss) used in the computation of diluted earnings/(loss) per share |
|
41 |
|
|
(41 |
) |
|
(48 |
) |
Shares used in computation: |
|
|
|
|
|
|
|||
Weighted-average ordinary shares outstanding |
|
192,476,022 |
|
|
191,952,473 |
|
|
190,565,397 |
|
Warrants |
|
— |
|
|
192,181 |
|
|
312,148 |
|
Exchangeable Notes |
|
2,911,500 |
|
|
— |
|
|
938,150 |
|
Stock options |
|
1,055,820 |
|
|
— |
|
|
— |
|
Restricted stock units |
|
562,670 |
|
|
— |
|
|
— |
|
Other contingently issuable shares |
|
71,244 |
|
|
— |
|
|
— |
|
Diluted weighted-average ordinary shares |
|
197,077,256 |
|
|
192,144,654 |
|
|
191,815,695 |
|
Diluted earnings/(loss) per share attributable to owners of the parent |
|
0.21 |
|
|
(0.21 |
) |
|
(0.25 |
) |
Reconciliation of IFRS to Non-IFRS Results |
|||||
(Unaudited) |
|||||
(in € millions, except percentages) |
|||||
|
|
Three months ended |
|||
|
|
March 31, 2022 |
|
March 31, 2021 |
|
IFRS revenue |
|
2,661 |
|
|
2,147 |
Foreign exchange effect on 2022 revenue using 2021 rates |
|
109 |
|
|
|
Revenue excluding foreign exchange effect |
|
2,552 |
|
|
|
IFRS revenue year-over-year change % |
|
24 |
% |
|
|
Revenue excluding foreign exchange effect year-over-year change % |
|
19 |
% |
|
|
IFRS Premium revenue |
|
2,379 |
|
|
1,931 |
Foreign exchange effect on 2022 Premium revenue using 2021 rates |
|
91 |
|
|
|
Premium revenue excluding foreign exchange effect |
|
2,288 |
|
|
|
IFRS Premium revenue year-over-year change % |
|
23 |
% |
|
|
Premium revenue excluding foreign exchange effect year-over-year change % |
|
18 |
% |
|
|
IFRS Ad-Supported revenue |
|
282 |
|
|
216 |
Foreign exchange effect on 2022 Ad-Supported revenue using 2021 rates |
|
18 |
|
|
|
Ad-Supported revenue excluding foreign exchange effect |
|
264 |
|
|
|
IFRS Ad-Supported revenue year-over-year change % |
|
31 |
% |
|
|
Ad-Supported revenue excluding foreign exchange effect year-over-year change % |
|
22 |
% |
|
|
Free Cash Flow |
|||||||||
(Unaudited) |
|||||||||
(in € millions) |
|||||||||
|
|
Three months ended |
|||||||
|
|
March 31, 2022 |
|
December 31, 2021 |
|
March 31, 2021 |
|||
Net cash flows from operating activities |
|
37 |
|
|
119 |
|
|
65 |
|
Capital expenditures |
|
(10 |
) |
|
(16 |
) |
|
(24 |
) |
Change in restricted cash |
|
(5 |
) |
|
— |
|
|
— |
|
Free Cash Flow |
|
22 |
|
|
103 |
|
|
41 |
|
View source version on businesswire.com: https://www.businesswire.com/news/home/20220427005371/en/
Contacts
Investor Relations:
Bryan Goldberg
Lauren Katzen
ir@spotify.com
Public Relations:
Dustee Jenkins
press@spotify.com