Spotify Technology S.A. (NYSE: SPOT):
This press release features multimedia. View the full release here: https://www.businesswire.com/news/home/20211027005313/en/
(Graphic: Business Wire)
Dear Shareholders,
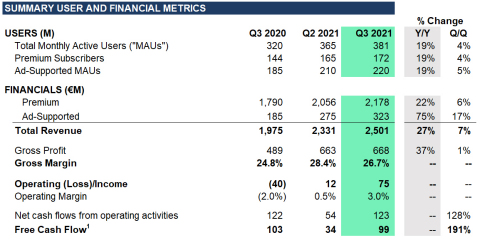
The business performed very well in the quarter. Nearly all of our major metrics finished better than expected, including MAUs, Revenue, Gross Margin, and Operating Income. Subscriber growth was inline and importantly, ARPU growth increased Y/Y. Additionally, we saw another quarter of significant advertising strength and user engagement metrics across many markets showed encouraging signs of growth. During the quarter, we generated positive Free Cash Flow of €99 million.
MONTHLY ACTIVE USERS (“MAUs”)
Total MAUs grew 19% Y/Y to 381 million in the quarter, up from 365 million last quarter and near the top end of our guidance range. We experienced double digit Y/Y growth in all regions with particular strength in Rest of World where performance was aided by the resumption of marketing activity in India along with above-plan growth in the Philippines and Indonesia. We also saw improved momentum across the 86 markets launched earlier this year, with outperformance led by South Korea, Bangladesh, and Pakistan.
PREMIUM SUBSCRIBERS
Our Premium Subscribers grew 19% Y/Y to 172 million in the quarter, up from 165 million last quarter and towards the midpoint of the guidance range. We tested a Premium promotion in the third quarter, which aided the typical seasonality of our business and also helped offset the tough comp from the successful launch of Russia and surrounding territories in Q3 last year.
This quarter we added several major promotional partnerships, including HMD Global (Spotify preloads on select Nokia branded smartphones and tablets across all 178 markets), LG U+ (offering 3 or 6 month trials in South Korea with one of the country’s largest telcos), OnePlus (Spotify preloads on OnePlus mobile devices in India with 3 or 6 month trials and a limited offer of 12 month trials to OnePlus Red Cable Club members), PayMaya (supporting pre-paid payment solutions for Spotify's daily, weekly and monthly subscriptions and offering 7 day trials in the Philippines), and Tinkoff (offering 3 month trials with Russia’s largest all-digital bank). Additionally, we renewed our partnership with Spark, New Zealand’s largest telco and digital services company, offering bundling and reseller opportunities.
Our average monthly Premium churn rate for the quarter was down sequentially and up Y/Y against last year’s historic low. We are pleased with the trends in churn and continue to expect full year 2021 churn to be down versus 2020.
FINANCIAL METRICS
Revenue
Revenue of €2,501 million grew 27% Y/Y in Q3 (or 26% Y/Y on a constant currency basis) and was at the top end of our guidance range due to significant strength in advertising. Premium Revenue grew 22% Y/Y to €2,178 million (or 21% Y/Y constant currency) while Ad-Supported Revenue was particularly strong, growing 75% Y/Y to €323 million (or 75% Y/Y constant currency).
Within Premium, average revenue per user (“ARPU”) of €4.34 in Q3 was up 4% Y/Y (or up 3% Y/Y constant currency vs. flat Y/Y in Q2). Excluding the impact of FX, we saw a benefit to ARPU primarily from our price increases.
Ad-Supported Revenue meaningfully outperformed, driven by higher sold impressions, increased CPMs, and accelerated demand within the Spotify Audience Network. The strength in advertising was broad-based across all sales channels, with the United States and United Kingdom meaningfully exceeding expectations. Our music business was driven by growth in impressions, a meaningful improvement in sell-through rate, and double-digit CPM growth. Our Podcast business was driven by strong double-digit Y/Y growth at existing Spotify studios (The Ringer, Parcast, Spotify Studios, and Gimlet) along with the Megaphone acquisition and the exclusive licensing of the Joe Rogan Experience, Armchair Expert with Dax Shephard, and Call Her Daddy.
During Q3, the Spotify Audience Network continued to gain traction in the United States while expanding into the United Kingdom, Canada, and Australia. The Spotify Audience Network continued to outperform in the quarter, driven by higher available inventory and incremental revenue from international sales. Since launch, the number of podcasts in our network has grown by more than 50%, and nearly 1 in 5 Spotify advertisers are already participating. The Spotify Audience Network will open to top emerging podcast creators from Anchor in the coming weeks, increasing the scale and reach for our advertisers.
Gross Margin
Gross Margin finished at 26.7% in Q3, above the top end of our guidance range and reflecting nearly 200 bps of Y/Y expansion. The Gross Margin improvement reflected a favorable revenue mix shift towards podcasts, marketplace activity, improved music advertising operating leverage, and Other Cost of Revenue efficiencies (e.g. payment fees, streaming delivery costs), which were partially offset by higher non-music and other content costs and publishing rate increases.
Premium Gross Margin was 29.1% in Q3, up 182 bps Y/Y, and Ad-Supported Gross Margin was 10.5% in Q3, up 993 bps Y/Y. As a reminder, all content costs related to podcast investment are included in the Ad-Supported business for the current and historical periods.
Operating Expenses
Operating Expenses totaled €593 million in Q3, an increase of 12% Y/Y. Social Charges were below forecast given the decline in our share price during the quarter. Additionally, personnel costs came in lower than expected as well as certain marketing expenses. Excluding the impact of Social Charge movements, Operating Expenses were better than forecast and contributed to positive Operating Income in the quarter.
As a reminder, Social Charges are payroll taxes associated with employee salaries and benefits, including share-based compensation. We are subject to social taxes in several countries in which we operate, although Sweden accounts for the bulk of the social costs. We don’t forecast stock price changes in our guidance so upward or downward movements will impact our reported operating expenses.
At the end of Q3, our workforce consisted of 7,431 FTEs globally.
Product and Platform
During the quarter, we continued to lean into the personalization of our user experiences to help drive improved intake, retention, conversion, and LTV. Key product rollouts included: Blend (the ability for two users to merge their music into one shared playlist), Enhance (the ability for Premium users to add personalized recommendations to their playlists), Episodes for You (episodic podcast level recommendations), and What’s New (a feed that gathers all new releases from the artists and shows that users follow).
In late August, we opened up our paid podcast subscriptions to all US creators with intentions to expand internationally to both more creators and users. Additionally, we announced the launch of Q&A and polls for Anchor creators, which allows listeners to respond to short questions posed by show creators. We also expanded the rollout of the Music + Talk format to 15 new markets, bringing this format to 21 markets around the world.
During the quarter, we advanced our product ubiquity efforts in several areas. We announced a partnership with Delta Airlines that allows passengers to discover Spotify-curated music and podcasts within Delta’s in-flight entertainment system. Additionally, we deepened our partnership with Roku, launching a pre-loaded playback stack, Spotify Connect discoverability, video podcast playback, and support for Roku’s voice assistant. In August, Spotify launched a new smartwatch experience supporting offline and direct streaming on Google’s new Wear OS 3 platform (deployed with key brands such as Samsung, Fossil, and Mobvoi).
Within Two-Sided Marketplace, we continued to test Discovery Mode with record labels and distributors, where we saw Q/Q growth in customers and Gross Profit contribution. Sponsored Recommendations (i.e. Marquee) also continued to gain traction during the third quarter as we expanded into more international markets including France, Monaco, Switzerland, Germany, Austria, and Liechtenstein.
Content
At the end of Q3, we had 3.2 million podcasts on the platform (up from 2.9 million at the end of Q2). The percentage of MAUs that engaged with podcast content continued to increase throughout the quarter, marking an acceleration relative to Q2 trends. Among MAUs that engaged with podcasts in Q3, consumption trends remained strong (up 20% Y/Y on a per user basis) while month-over-month retention rates continued to trend positively. During the quarter, podcast share of overall consumption hours on our platform also reached an all-time high.
In the United States, we released 32 new Originals & Exclusives (“O&E”) in the quarter, including the exclusivity launches of Armchair Expert with Dax Sheppard and Call Her Daddy in July. We also announced a multi-year audio content partnership between The Ringer and WWE to develop original and exclusive audio content, as well as live audio discussions hosted on Spotify Greenroom after every big WWE pay-per-view event.
Internationally, we released 76 new O&E podcasts, with notable traction in India and Latin America where Originals have been helpful in stimulating new user acquisition. Top performing shows in these markets include: Mythpat (India), Mano a Mano (Brazil), Paciente 63 (Caso 63 adaptation in Brazil), and Virus 2062 (Caso 63 adaptation in India). In Sweden, we announced seven new Spotify Originals from some of the most popular artists and talents in the country, including Spotify’s first Swedish podcast with video, Bakom micken med Filip Dikmen.
During the quarter, our music slate also saw significant new release activity. In late August, Kanye West’s 10th studio album, Donda, arrived, with 16 tracks from the album occupying the top 25 of the Spotify Global Top 50 daily chart and the entire top 10 of the Spotify US Top 50. Drake also released his highly anticipated 6th studio album Certified Lover Boy, breaking the record for the most-streamed album in a day in Spotify history with over 150 million streams. Spotify launched a global partnership with Drake including an offer for fans and new users to stream the album free on-demand for the first two weeks of release. Billie Eilish released a long-anticipated album, Happier Than Ever, in late July which included Spotify’s first-ever artist hub with Happier Than Ever: The Destination. The Destination features three enhanced albums with exclusive video and audio content from Billie across the three playlists: Billie Mode, Lyric Mode, and Fan Mode. Other major releases in the quarter included J Balvin’s album, JOSE, Kacey Musgraves’ album, star-crossed, Lil Nas X’s album, Montero, and NCT 127’s album, Sticker.
Free Cash Flow
Free Cash Flow was €99 million in Q3, a €4 million decrease Y/Y primarily due to an increase in net income adjusted for non-cash items, partially offset by higher working capital needs arising from higher ad receivables, podcast-related payments, and licensor payments. Capital expenditures decreased €8 million Y/Y largely due to finalization of various office build outs in New York City, Singapore, and LA.
At the end of Q3, we maintained a strong liquidity position with €3.3 billion in cash and cash equivalents, restricted cash, and short term investments.
Q4 2021 OUTLOOK
The following forward-looking statements reflect Spotify’s expectations as of October 27, 2021 and are subject to substantial uncertainty. The estimates below utilize the same methodology we’ve used in prior quarters with respect to our guidance and the potential range of outcomes. Given the extraordinary operating circumstances we currently face with respect to the impact of COVID-19, there is a greater likelihood of variances with respect to those ranges than typical quarters.
Q4 2021 Guidance: We have maintained our prior Q4 guidance for Total MAUs, Total Premium Subscribers, and Operating Profit/Loss, and have increased the bottom end of the range for Total Revenue and Gross Margin.
- ● Total MAUs: 400-407 million
- ● Total Premium Subscribers: 177-181 million
-
● Total Revenue: €2.54-€2.68 billion
- Assumes approximately 250 bps tailwind to growth Y/Y due to movements in foreign exchange rates
- ● Gross Margin: 25.1-26.1%
- ● Operating Profit/Loss: €(152)-€(72) million
SHARE REPURCHASE PROGRAM
On August 20, 2021, Spotify announced a program to repurchase up to $1.0 billion of its ordinary shares. The repurchase program will expire on April 21, 2026. Through September 30, 2021, the company repurchased 157,510 shares for €30 million under this program at an average cost of $222.86 per share.
EARNINGS QUESTION & ANSWER SESSION
We will host a live question and answer session starting at 8 a.m. ET today on investors.spotify.com. Daniel Ek, our Founder and CEO, and Paul Vogel, our Chief Financial Officer, will be on hand to answer questions submitted through slido.com using the event code #SpotifyEarningsQ321. Participants also may join using the listen-only conference line by registering through the following site:
Direct Event Registration Portal: http://www.directeventreg.com/registration/event/5679825
We use investors.spotify.com and newsroom.spotify.com websites as well as other social media listed in the “Resources – Social Media” tab of our Investors website to disclose material company information.
Use of Non-IFRS Measures
To supplement our financial information presented in accordance with IFRS, we use the following non-IFRS financial measures: Revenue excluding foreign exchange effect, Premium revenue excluding foreign exchange effect, Ad-Supported revenue excluding foreign exchange effect, and Free Cash Flow. Management believes that Revenue excluding foreign exchange effect, Premium revenue excluding foreign exchange effect, and Ad-Supported revenue excluding foreign exchange effect are useful to investors because they present measures that facilitate comparison to our historical performance. However, Revenue excluding foreign exchange effect, Premium revenue excluding foreign exchange effect, and Ad-Supported revenue excluding foreign exchange effect should be considered in addition to, not as a substitute for or superior to, Revenue, Premium revenue, Ad-Supported revenue or other financial measures prepared in accordance with IFRS. Management believes that Free Cash Flow is useful to investors because it presents a measure that approximates the amount of cash generated that is available to repay debt obligations, to make investments, and for certain other activities that exclude certain infrequently occurring and/or non-cash items. However, Free Cash Flow should be considered in addition to, not as a substitute for or superior to, net cash flows (used in)/from operating activities or other financial measures prepared in accordance with IFRS. For more information on these non-IFRS financial measures, please see “Reconciliation of IFRS to Non-IFRS Results” table.
Forward Looking Statements
This shareholder letter contains estimates and forward-looking statements. All statements other than statements of historical fact are forward-looking statements. The words “may,” “might,” “will,” “could,” “would,” “should,” “expect,” “plan,” “anticipate,” “intend,” “seek,” “believe,” “estimate,” “predict,” “potential,” “continue,” “contemplate,” “possible,” and similar words are intended to identify estimates and forward-looking statements.
Our estimates and forward-looking statements are mainly based on our current expectations and estimates of future events and trends, which affect or may affect our businesses and operations. Although we believe that these estimates and forward-looking statements are based upon reasonable assumptions, they are subject to numerous risks and uncertainties and are made in light of information currently available to us. Many important factors may adversely affect our results as indicated in forward-looking statements. These factors include, but are not limited to: our ability to attract prospective users and to retain existing users; competition for users, user listening time, and advertisers; risks associated with our international expansion and our ability to manage our growth; our ability to predict, recommend, and play content that our users enjoy; our ability to effectively monetize our Service; our ability to generate sufficient revenue to be profitable or to generate positive cash flow and grow on a sustained basis; risks associated with the expansion of our operations to deliver non-music content, including podcasts, including increased business, legal, financial, reputational, and competitive risks; potential disputes or liabilities associated with content made available on our Service; risks relating to the acquisition, investment, and disposition of companies or technologies; our dependence upon third-party licenses for most of the content we stream; our lack of control over the providers of our content and their effect on our access to music and other content; our ability to comply with the many complex license agreements to which we are a party; our ability to accurately estimate the amounts payable under our license agreements; the limitations on our operating flexibility due to the minimum guarantees required under certain of our license agreements; our ability to obtain accurate and comprehensive information about the compositions embodied in sound recordings in order to obtain necessary licenses or perform obligations under our existing license agreements; new copyright legislation and related regulations that may increase the cost and/or difficulty of music licensing; assertions by third parties of infringement or other violations by us of their intellectual property rights; our ability to protect our intellectual property; the dependence of streaming on operating systems, online platforms, hardware, networks, regulations, and standards that we do not control; potential breaches of our security systems or systems of third parties, including as a result of our Work From Anywhere program; interruptions, delays, or discontinuations in service in our systems or systems of third parties; changes in laws or regulations affecting us; risks relating to privacy and protection of user data; our ability to maintain, protect, and enhance our brand; payment-related risks; our ability to hire and retain key personnel, and challenges to productivity and integration as a result of our Work From Anywhere program; our ability to accurately estimate our user metrics and other estimates; risks associated with manipulation of stream counts and user accounts and unauthorized access to our services; tax-related risks; the concentration of voting power among our founders who have and will continue to have substantial control over our business; risks related to our status as a foreign private issuer; international, national or local economic, social or political conditions; risks associated with accounting estimates, currency fluctuations and foreign exchange controls; and the impact of the COVID-19 pandemic on our business and operations, including any adverse impact on advertising sales or subscriber revenue; risks related to our debt, including limitations on our cash flow for operations and our ability to satisfy our obligations under the Exchangeable Notes; our ability to raise the funds necessary to repurchase the Exchangeable Notes for cash, under certain circumstances, or to pay any cash amounts due upon exchange; provisions in the indenture governing the Exchangeable Notes delaying or preventing an otherwise beneficial takeover of us; and any adverse impact on our reported financial condition and results from the accounting methods for the Exchangeable Notes. A detailed discussion of these and other risks and uncertainties that could cause actual results and events to differ materially from our estimates and forward-looking statements is included in our filings with the U.S. Securities and Exchange Commission (“SEC”), including our Annual Report on Form 20-F filed with the SEC on February 5, 2021, as updated by subsequently filed reports for our interim results on Form 6-K. We undertake no obligation to update forward-looking statements to reflect events or circumstances occurring after the date of this shareholder letter.
Rounding
Certain monetary amounts, percentages, and other figures included in this letter have been subject to rounding adjustments. The sum of individual metrics may not always equal total amounts indicated due to rounding.
Interim condensed consolidated statement of operations (Unaudited) (in € millions, except share and per share data) |
|||||||||||||
|
|
Three months ended |
|
Nine months ended |
|||||||||
|
|
September 30,
|
|
June 30,
|
|
September 30,
|
|
September 30,
|
|
September 30,
|
|||
Revenue |
|
2,501 |
|
|
2,331 |
|
|
1,975 |
|
|
6,979 |
|
5,712 |
Cost of revenue |
|
1,833 |
|
|
1,668 |
|
|
1,486 |
|
|
5,100 |
|
4,272 |
Gross profit |
|
668 |
|
|
663 |
|
|
489 |
|
|
1,879 |
|
1,440 |
Research and development |
|
208 |
|
|
255 |
|
|
176 |
|
|
659 |
|
605 |
Sales and marketing |
|
280 |
|
|
279 |
|
|
256 |
|
|
795 |
|
735 |
General and administrative |
|
105 |
|
|
117 |
|
|
97 |
|
|
324 |
|
324 |
|
|
593 |
|
|
651 |
|
|
529 |
|
|
1,778 |
|
1,664 |
Operating income/(loss) |
|
75 |
|
|
12 |
|
|
(40) |
|
|
101 |
|
(224) |
Finance income |
|
101 |
|
|
21 |
|
|
14 |
|
|
226 |
|
90 |
Finance costs |
|
(14) |
|
|
(25) |
|
|
(90) |
|
|
(70) |
|
(396) |
Finance income/(costs) - net |
|
87 |
|
|
(4) |
|
|
(76) |
|
|
156 |
|
(306) |
Income/(loss) before tax |
|
162 |
|
|
8 |
|
|
(116) |
|
|
257 |
|
(530) |
Income tax expense/(benefit) |
|
160 |
|
|
28 |
|
|
(15) |
|
|
252 |
|
(74) |
Net income/(loss) attributable to owners of the parent |
|
2 |
|
|
(20) |
|
|
(101) |
|
|
5 |
|
(456) |
Earnings/(loss) per share attributable to owners of the parent |
|
|
|
|
|
|
|
|
|
|
|||
Basic |
|
0.01 |
|
(0.10) |
|
(0.53) |
|
0.02 |
|
(2.44) |
|||
Diluted |
|
(0.41) |
|
(0.19) |
|
(0.58) |
|
(0.85) |
|
(2.44) |
|||
Weighted-average ordinary shares outstanding |
|
|
|
|
|
|
|
|
|
|
|||
Basic |
|
191,485,473 |
|
191,172,946 |
|
188,842,828 |
|
191,077,975 |
|
186,821,414 |
|||
Diluted |
|
194,551,862 |
|
194,084,446 |
|
189,054,064 |
|
193,559,697 |
|
186,821,414 |
|||
Condensed consolidated statement of financial position (Unaudited) (in € millions) |
||||||
|
|
September 30, 2021 |
|
December 31, 2020 |
||
Assets |
|
|
|
|
||
Non-current assets |
|
|
|
|
||
Lease right-of-use assets |
|
443 |
|
|
444 |
|
Property and equipment |
|
369 |
|
|
313 |
|
Goodwill |
|
869 |
|
|
736 |
|
Intangible assets |
|
91 |
|
|
97 |
|
Long term investments |
|
1,090 |
|
|
2,277 |
|
Restricted cash and other non-current assets |
|
77 |
|
|
78 |
|
Deferred tax assets |
|
13 |
|
|
15 |
|
|
|
2,952 |
|
|
3,960 |
|
Current assets |
|
|
|
|
||
Trade and other receivables |
|
571 |
|
|
464 |
|
Income tax receivable |
|
5 |
|
|
4 |
|
Short term investments |
|
725 |
|
|
596 |
|
Cash and cash equivalents |
|
2,512 |
|
|
1,151 |
|
Other current assets |
|
224 |
|
|
151 |
|
|
|
4,037 |
|
|
2,366 |
|
Total assets |
|
6,989 |
|
|
6,326 |
|
Equity and liabilities |
|
|
|
|
||
Equity |
|
|
|
|
||
Share capital |
|
— |
|
|
— |
|
Other paid in capital |
|
4,681 |
|
|
4,583 |
|
Treasury shares |
|
(201) |
|
|
(175) |
|
Other reserves |
|
922 |
|
|
1,687 |
|
Accumulated deficit |
|
(3,285) |
|
|
(3,290) |
|
Equity attributable to owners of the parent |
|
2,117 |
|
|
2,805 |
|
Non-current liabilities |
|
|
|
|
||
Exchangeable Notes |
|
1,175 |
|
|
— |
|
Lease liabilities |
|
582 |
|
|
577 |
|
Accrued expenses and other liabilities |
|
37 |
|
|
42 |
|
Provisions |
|
3 |
|
|
2 |
|
|
|
1,797 |
|
|
621 |
|
Current liabilities |
|
|
|
|
||
Trade and other payables |
|
774 |
|
|
638 |
|
Income tax payable |
|
10 |
|
|
9 |
|
Deferred revenue |
|
440 |
|
|
380 |
|
Accrued expenses and other liabilities |
|
1,751 |
|
|
1,748 |
|
Provisions |
|
16 |
|
|
20 |
|
Derivative liabilities |
|
84 |
|
|
105 |
|
|
|
3,075 |
|
|
2,900 |
|
Total liabilities |
|
4,872 |
|
|
3,521 |
|
Total equity and liabilities |
|
6,989 |
|
|
6,326 |
|
Interim condensed consolidated statement of cash flows (Unaudited) (in € millions) |
|||||||||||||
|
|
Three months ended |
|
Nine months ended |
|||||||||
|
|
September 30,
|
|
June 30,
|
|
September 30,
|
|
September 30,
|
|
September 30,
|
|||
Operating activities |
|
|
|
|
|
|
|
|
|
|
|||
Net income/(loss) |
|
2 |
|
|
(20) |
|
|
(101) |
|
|
5 |
|
(456) |
Adjustments to reconcile net income/(loss) to net cash flows |
|
|
|
|
|
|
|
|
|
|
|||
Depreciation of property and equipment and lease right-of-use assets |
|
24 |
|
|
23 |
|
|
21 |
|
|
69 |
|
65 |
Amortization of intangible assets |
|
9 |
|
|
8 |
|
|
7 |
|
|
25 |
|
17 |
Share-based compensation expense |
|
57 |
|
|
68 |
|
|
46 |
|
|
173 |
|
133 |
Finance income |
|
(101) |
|
|
(21) |
|
|
(14) |
|
|
(226) |
|
(90) |
Finance costs |
|
14 |
|
|
25 |
|
|
90 |
|
|
70 |
|
396 |
Income tax expense/(benefit) |
|
160 |
|
|
28 |
|
|
(15) |
|
|
252 |
|
(74) |
Other |
|
(2) |
|
|
3 |
|
|
(3) |
|
|
3 |
|
3 |
Changes in working capital: |
|
|
|
|
|
|
|
|
|
|
|||
Increase in trade receivables and other assets |
|
(102) |
|
|
(95) |
|
|
(76) |
|
|
(182) |
|
(93) |
Increase in trade and other liabilities |
|
82 |
|
|
30 |
|
|
155 |
|
|
45 |
|
243 |
(Decrease)/increase in deferred revenue |
|
(4) |
|
|
17 |
|
|
20 |
|
|
50 |
|
50 |
(Decrease)/increase in provisions |
|
(2) |
|
|
— |
|
|
7 |
|
|
(3) |
|
6 |
Interest paid on lease liabilities |
|
(13) |
|
|
(13) |
|
|
(13) |
|
|
(37) |
|
(43) |
Interest received |
|
1 |
|
|
2 |
|
|
— |
|
|
3 |
|
3 |
Income tax paid |
|
(2) |
|
|
(1) |
|
|
(2) |
|
|
(5) |
|
(8) |
Net cash flows from operating activities |
|
123 |
|
|
54 |
|
|
122 |
|
|
242 |
|
152 |
Investing activities |
|
|
|
|
|
|
|
|
|
|
|||
Business combinations, net of cash acquired |
|
— |
|
|
(42) |
|
|
— |
|
|
(101) |
|
(137) |
Purchases of property and equipment |
|
(25) |
|
|
(20) |
|
|
(17) |
|
|
(69) |
|
(43) |
Purchases of short term investments |
|
(161) |
|
|
(109) |
|
|
(305) |
|
|
(385) |
|
(948) |
Sales and maturities of short term investments |
|
63 |
|
|
134 |
|
|
197 |
|
|
287 |
|
916 |
Change in restricted cash |
|
1 |
|
|
— |
|
|
(2) |
|
|
1 |
|
— |
Other |
|
1 |
|
|
(2) |
|
|
(7) |
|
|
(7) |
|
(28) |
Net cash flows used in investing activities |
|
(121) |
|
|
(39) |
|
|
(134) |
|
|
(274) |
|
(240) |
Financing activities |
|
|
|
|
|
|
|
|
|
|
|||
Payments of lease liabilities |
|
(9) |
|
|
(8) |
|
|
(6) |
|
|
(25) |
|
(16) |
Lease incentives received |
|
7 |
|
|
— |
|
|
6 |
|
|
7 |
|
13 |
Proceeds from exercise of stock options |
|
26 |
|
|
26 |
|
|
96 |
|
|
103 |
|
274 |
Proceeds from issuance of Exchangeable Notes, net of costs |
|
— |
|
|
— |
|
|
— |
|
|
1,223 |
|
— |
Proceeds from issuance of warrants |
|
31 |
|
|
— |
|
|
— |
|
|
31 |
|
— |
Repurchases of ordinary shares |
|
(24) |
|
— |
|
— |
|
(24) |
|
— |
|||
Payments for employee taxes withheld from restricted stock unit releases |
|
(12) |
|
|
(12) |
|
|
(11) |
|
|
(40) |
|
(19) |
Net cash flows from financing activities |
|
19 |
|
|
6 |
|
|
85 |
|
|
1,275 |
|
252 |
Net increase in cash and cash equivalents |
|
21 |
|
|
21 |
|
|
73 |
|
|
1,243 |
|
164 |
Cash and cash equivalents at beginning of the period |
|
2,440 |
|
|
2,442 |
|
|
1,148 |
|
|
1,151 |
|
1,065 |
Net foreign exchange gains/(losses) on cash and cash equivalents |
|
51 |
|
|
(23) |
|
|
(39) |
|
|
118 |
|
(47) |
Cash and cash equivalents at period end |
|
2,512 |
|
|
2,440 |
|
|
1,182 |
|
|
2,512 |
|
1,182 |
Calculation of basic and diluted earnings/(loss) per share (Unaudited) (in € millions, except share and per share data) |
|||||||||||||
|
|
Three months ended |
|
Nine months ended |
|||||||||
|
|
September 30,
|
|
June 30,
|
|
September 30,
|
|
September 30,
|
|
September 30,
|
|||
Basic earnings/(loss) per share |
|
|
|
|
|
|
|
|
|
|
|||
Net income/(loss) attributable to owners of the parent |
|
2 |
|
|
(20) |
|
|
(101) |
|
|
5 |
|
(456) |
Share used in computation: |
|
|
|
|
|
|
|
|
|
|
|||
Weighted-average ordinary shares outstanding |
|
191,485,473 |
|
|
191,172,946 |
|
|
188,842,828 |
|
|
191,077,975 |
|
186,821,414 |
Basic earnings/(loss) per share attributable to
|
|
0.01 |
|
|
(0.10) |
|
|
(0.53) |
|
|
0.02 |
|
(2.44) |
|
|
|
|
|
|
|
|
|
|
|
|||
Diluted loss per share |
|
|
|
|
|
|
|
|
|
|
|||
Net income/(loss) attributable to owners of the parent |
|
2 |
|
|
(20) |
|
|
(101) |
|
|
5 |
|
(456) |
Fair value gains on dilutive warrants |
|
(30) |
|
|
— |
|
|
(9) |
|
|
(51) |
|
|
Fair value gains on dilutive Exchangeable Notes |
|
(52) |
|
|
(17) |
|
|
— |
|
|
(117) |
|
— |
Net loss used in the computation of diluted
|
|
(80) |
|
|
(37) |
|
|
(110) |
|
|
(163) |
|
(456) |
Shares used in computation: |
|
|
|
|
|
|
|
|
|
|
|||
Weighted-average ordinary shares outstanding |
|
191,485,473 |
|
|
191,172,946 |
|
|
188,842,828 |
|
|
191,077,975 |
|
186,821,414 |
Warrants |
|
154,889 |
|
|
— |
|
|
211,236 |
|
|
229,029 |
|
— |
Exchangeable Notes |
|
2,911,500 |
|
|
2,911,500 |
|
|
— |
|
|
2,252,693 |
|
— |
Diluted weighted-average ordinary shares |
|
194,551,862 |
|
|
194,084,446 |
|
|
189,054,064 |
|
|
193,559,697 |
|
186,821,414 |
Diluted loss per share attributable to
|
|
(0.41) |
|
|
(0.19) |
|
|
(0.58) |
|
|
(0.85) |
|
(2.44) |
Reconciliation of IFRS to Non-IFRS Results (Unaudited) (in € millions, except percentages) |
||||||||||||
|
|
Three months ended |
|
Nine months ended |
||||||||
|
|
September 30,
|
|
September 30,
|
|
September 30,
|
|
September 30,
|
||||
IFRS revenue |
|
2,501 |
|
|
1,975 |
|
|
6,979 |
|
|
5,712 |
|
Foreign exchange effect on 2021 revenue using 2020 rates |
|
15 |
|
|
|
|
(180) |
|
|
|
||
Revenue excluding foreign exchange effect |
|
2,486 |
|
|
|
|
7,159 |
|
|
|
||
IFRS revenue year-over-year change % |
|
27 |
% |
|
|
|
22 |
% |
|
|
||
Revenue excluding foreign exchange effect year-over-year change % |
|
26 |
% |
|
|
|
25 |
% |
|
|
||
IFRS Premium revenue |
|
2,178 |
|
|
1,790 |
|
|
6,165 |
|
|
5,248 |
|
Foreign exchange effect on 2021 Premium revenue using 2020 rates |
|
16 |
|
|
|
|
(142) |
|
|
|
||
Premium revenue excluding foreign exchange effect |
|
2,162 |
|
|
|
|
6,307 |
|
|
|
||
IFRS Premium revenue year-over-year change % |
|
22 |
% |
|
|
|
17 |
% |
|
|
||
Premium revenue excluding foreign exchange effect year-over-year change % |
|
21 |
% |
|
|
|
20 |
% |
|
|
||
IFRS Ad-Supported revenue |
|
323 |
|
|
185 |
|
|
814 |
|
|
464 |
|
Foreign exchange effect on 2021 Ad-Supported revenue using 2020 rates |
|
(1) |
|
|
|
|
(38) |
|
|
|
||
Ad-Supported revenue excluding foreign exchange effect |
|
324 |
|
|
|
|
852 |
|
|
|
||
IFRS Ad-Supported revenue year-over-year change % |
|
75 |
% |
|
|
|
75 |
% |
|
|
||
Ad-Supported revenue excluding foreign exchange effect year-over-year change % |
|
75 |
% |
|
|
|
84 |
% |
|
|
||
Free Cash Flow (Unaudited) (in € millions) |
|||||||||||||
|
|
Three months ended |
|
Nine months ended |
|||||||||
|
|
September 30,
|
|
June 30,
|
|
September 30,
|
|
September 30,
|
|
September 30,
|
|||
Net cash flows from operating activities |
|
123 |
|
|
54 |
|
|
122 |
|
|
242 |
|
152 |
Capital expenditures |
|
(25) |
|
|
(20) |
|
|
(17) |
|
|
(69) |
|
(43) |
Change in restricted cash |
|
1 |
|
|
— |
|
|
(2) |
|
|
1 |
|
— |
Free Cash Flow |
|
99 |
|
|
34 |
|
|
103 |
|
|
174 |
|
109 |
1 Free Cash Flow is a non-IFRS measure. See “Use of Non-IFRS Measures” and “Reconciliation of IFRS to Non-IFRS Results” for additional information.
View source version on businesswire.com: https://www.businesswire.com/news/home/20211027005313/en/
Contacts
Investor Relations:
Bryan Goldberg
Lauren Katzen
ir@spotify.com
Public Relations:
Dustee Jenkins
press@spotify.com