One week ago, I called the situation in the Strait of Hormuz a Category 5 hurricane. Since then, the storm hasn’t just stayed on the radar. It has effectively stalled over the global economy, strengthening its grip and rewriting the rules of the road for every asset class. At least for now.
I think this is overblown — not unimportant, but overblown. Because the markets have many issues to battle outside of this one. That’s what leads me to believe that moves like Tuesday’s afternoon jump higher in major stock indexes are more likely a fake out than a breakout. Let’s look at the charts, then discuss the competing narratives.
3 Charts I'm Watching
Everyone has their favorite energy exchange-traded fund (ETF), right? Mine is Crude Oil Strategy K-1 Free ETF (OILK). It does not produce a K-1 for taxes and represents a very pure tracking of the price of crude oil.
It also shows just how up for grabs the oil price narrative is as we enter April. That’s a terrible look, technically speaking. It signals to me that Tuesday’s 4% drop, albeit following a 50% spike higher, is likely nearly done.
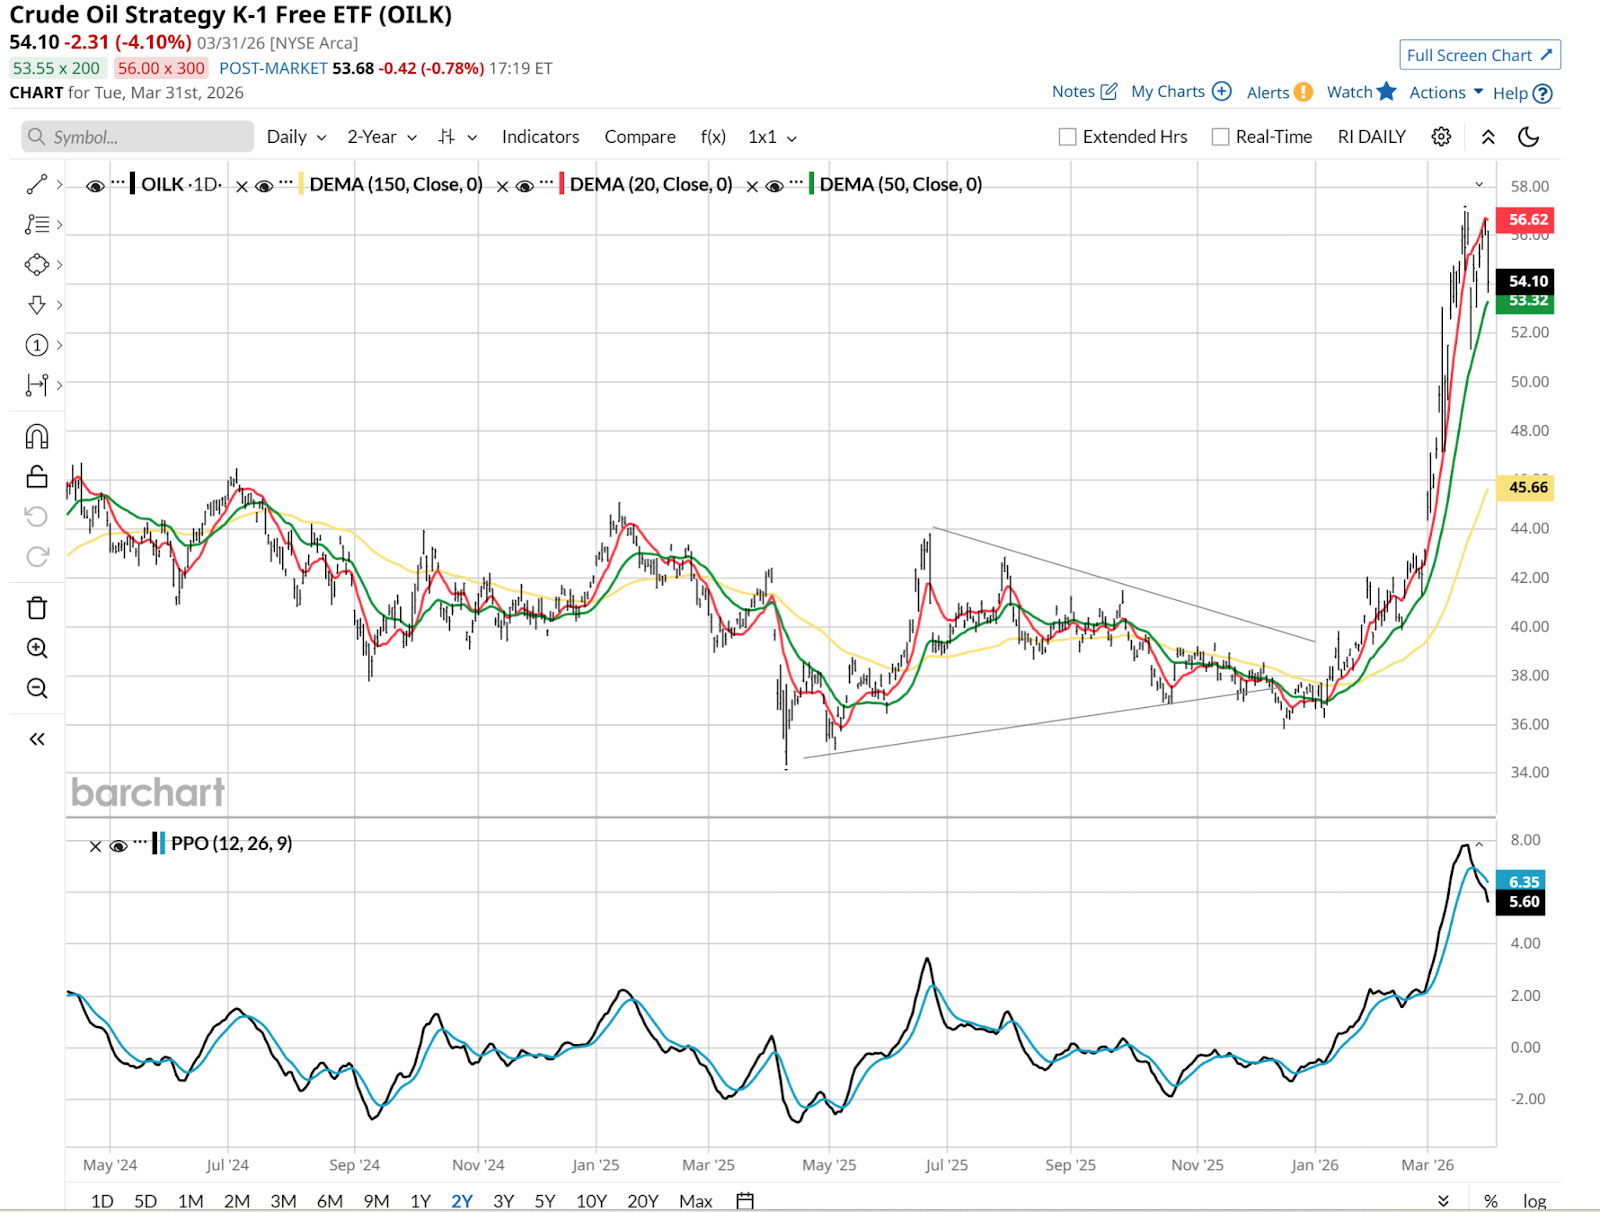
Yet there’s a part of me, not the technician but the market veteran who's seen it all since 1986, that makes me believe this oil rally is not over. I’m not stepping out of my shoes to buy it here, but I am looking for any sign that, like gold before it, there’s a second coming of the rally.
Then, there’s the Invesco QQQ Trust Series 1 (QQQ). I chose it because its energy sector allocation is just 0.6%. Essentially nothing. The SPDR S&P 500 ETF Trust (SPY) is 3.5% weighted to energy, still not very much. However, part of the energy follow-up action in the stock market, if this is the end of that oil rally, is that money will flow back into Big Tech here — and out of the “breadth trade” that allocates more evenly among sectors.
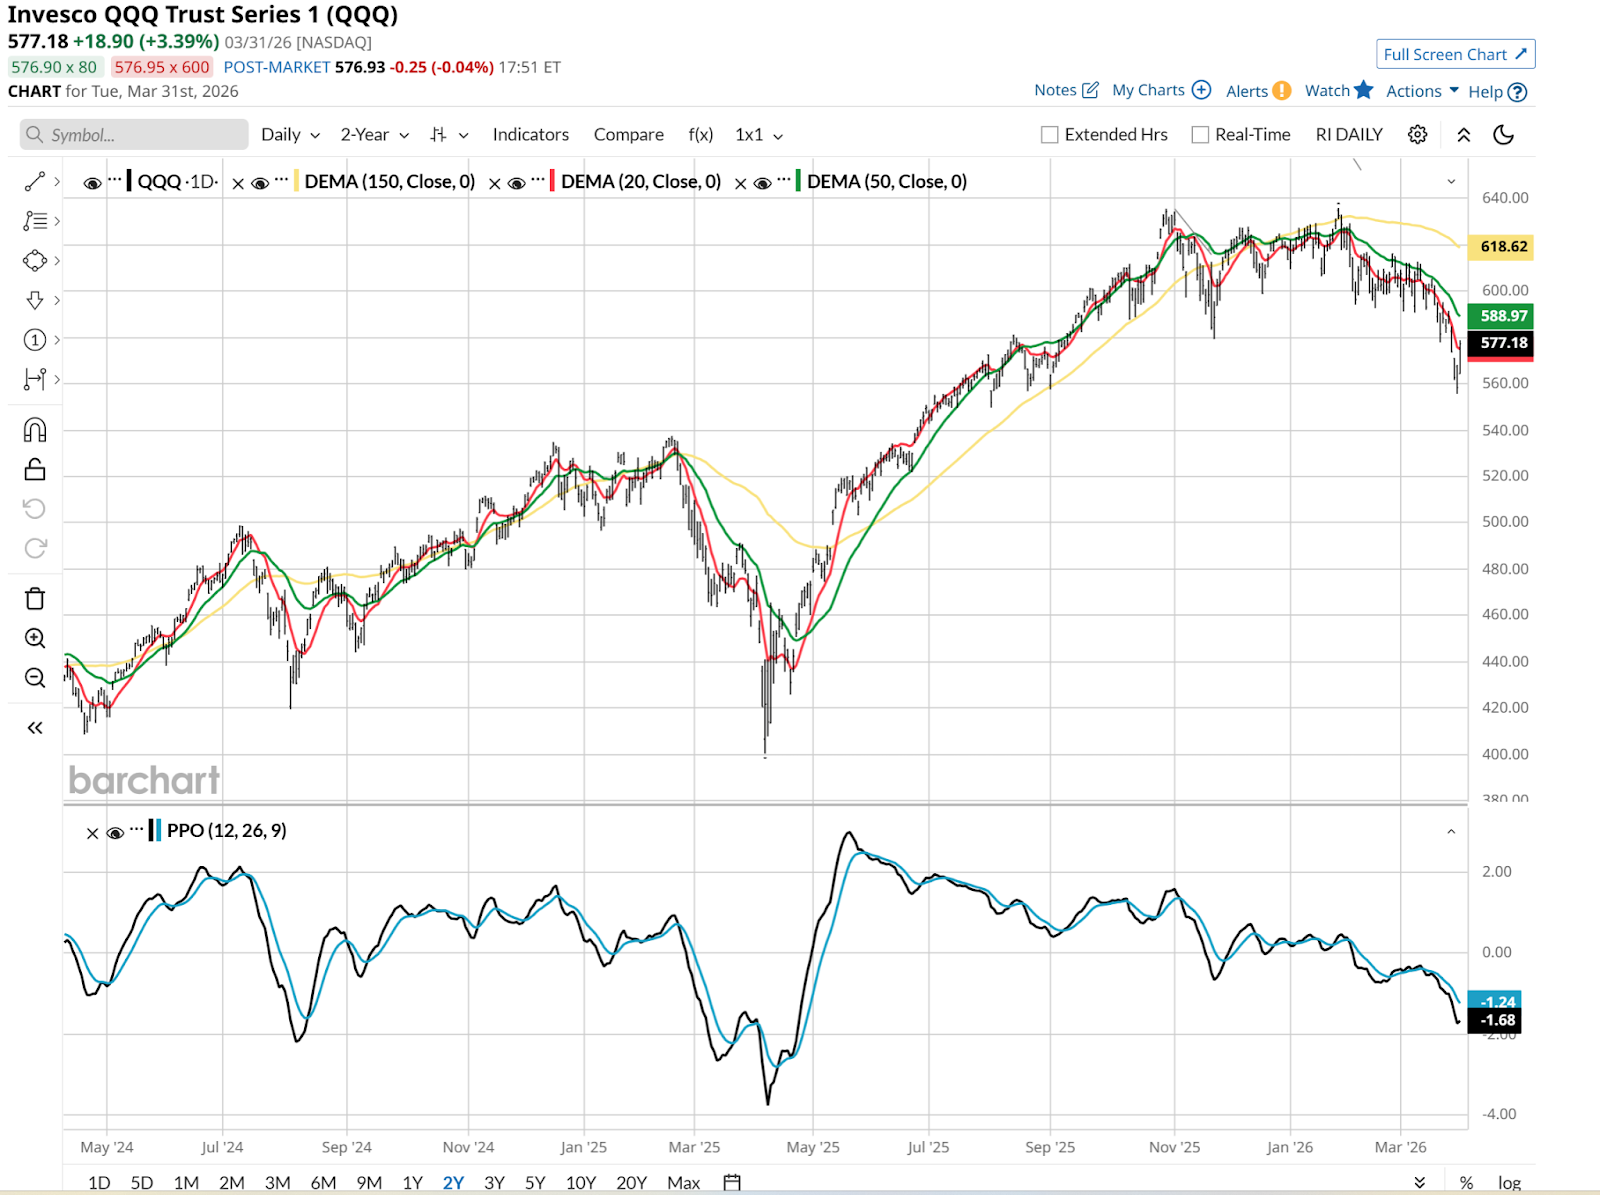
However, this is what gives me pause. QQQ is not showing me anything encouraging based on that one-day pop on Tuesday. The falling moving averages and the PPO barely budged.
That brings me to this third chart. Still QQQ, but it is the hourly view, not the daily as above. I’ve drawn in some light trendlines, where I think they should be. The next level down appears to be $550, about 5% south of Tuesday’s close.
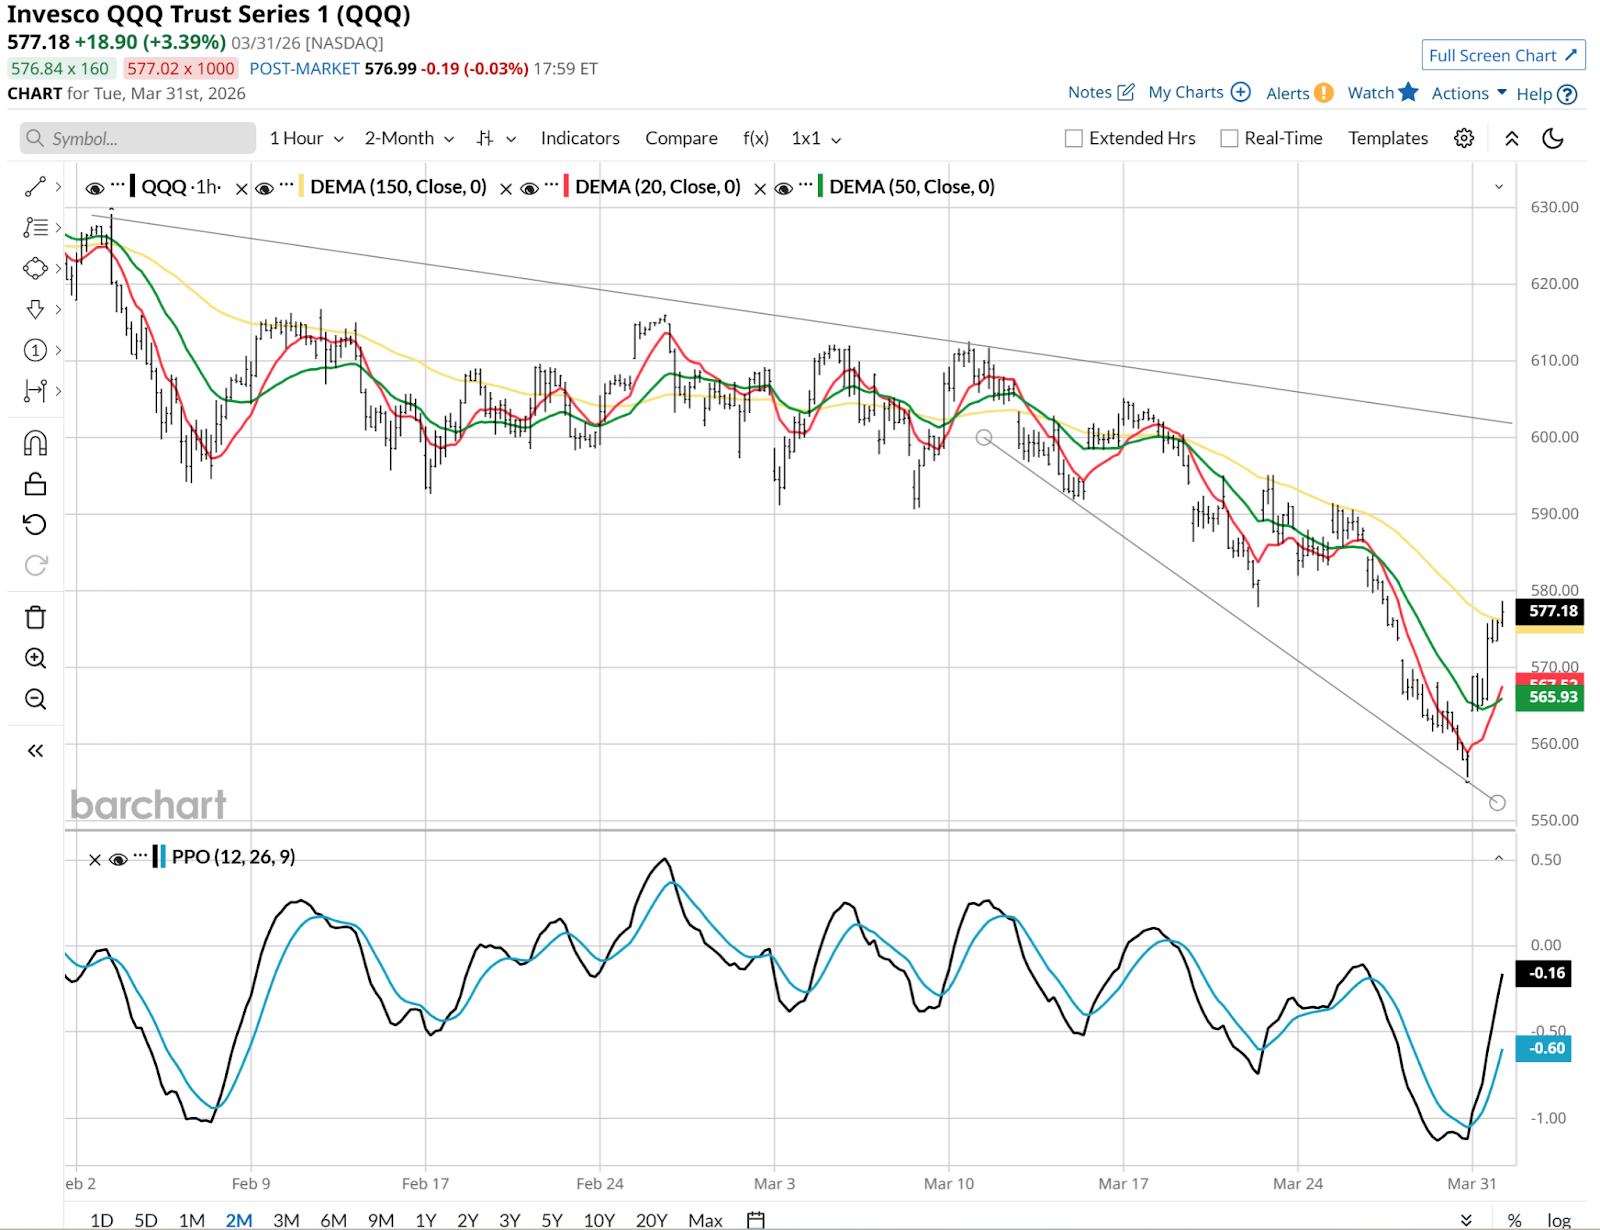
However, the upside “lid” is my biggest concern here. Bottom line: I can grant QQQ another 4% higher, from $577 to just above $600. After that, we are going to need a lot more to be resolved than the “energy hurricane” for me to see higher levels as plan A.
The Eye of the Storm: A Controlled Blockade
A week is a lifetime in a war zone. What we know now is that the Strait isn't "closed" in the traditional sense of a total physical barrier; it has become a selective filter.
Normal traffic of about 135 vessels per day has withered to barely six. Iran has formalized its control, passing laws to implement transit payments and banning any vessel tied to the U.S., Israel, or their allies.
With Houthi rebels simultaneously escalating strikes in the Red Sea, the global shipping industry is facing a no-go zone across the entire Middle East.
The Verdict: Continued Storm or Blowing Over?
The odds of this hurricane "blowing over" in the next seven days are slim. The Strait of Hormuz remains mostly a closed gate for oil tankers.
Even if a ceasefire were signed tomorrow, the controlled operating environment Iran has established, with its new tolls and restricted routes, means the global energy map has been altered. And it will take more than a social post or a snap of the fingers to undo that.
Rob Isbitts created the ROAR Score, based on his 40+ years of technical analysis experience. ROAR helps DIY investors manage risk and create their own portfolios. For Rob's written research, check out ETFYourself.com.
On the date of publication, Rob Isbitts did not have (either directly or indirectly) positions in any of the securities mentioned in this article. All information and data in this article is solely for informational purposes. For more information please view the Barchart Disclosure Policy here.
More news from Barchart