

Since May 2021, the S&P 500 has delivered a total return of 77.9%. But one standout stock has more than doubled the market - over the past five years, Tapestry has surged 202% to $131.63 per share. Its momentum hasn’t stopped as it’s also gained 28.8% in the last six months thanks to its solid quarterly results, beating the S&P by 15.6%.
Is there a buying opportunity in Tapestry, or does it present a risk to your portfolio? Dive into our full research report to see our analyst team’s opinion, it’s free.
Why Do We Think Tapestry Will Underperform?
We’re happy investors have made money, but we're swiping left on Tapestry for now. Here are three reasons why TPR doesn't excite us and a stock we'd rather own.
1. Weak Constant Currency Growth Points to Soft Demand
In addition to reported revenue, constant currency revenue is a useful data point for analyzing Consumer Discretionary - Apparel and Accessories companies. This metric excludes currency movements, which are outside of Tapestry’s control and are not indicative of underlying demand.
Over the last two years, Tapestry’s constant currency revenue averaged 8.8% year-on-year growth. This performance was underwhelming and suggests it might have to lower prices or invest in product improvements to accelerate growth, factors that can hinder near-term profitability. 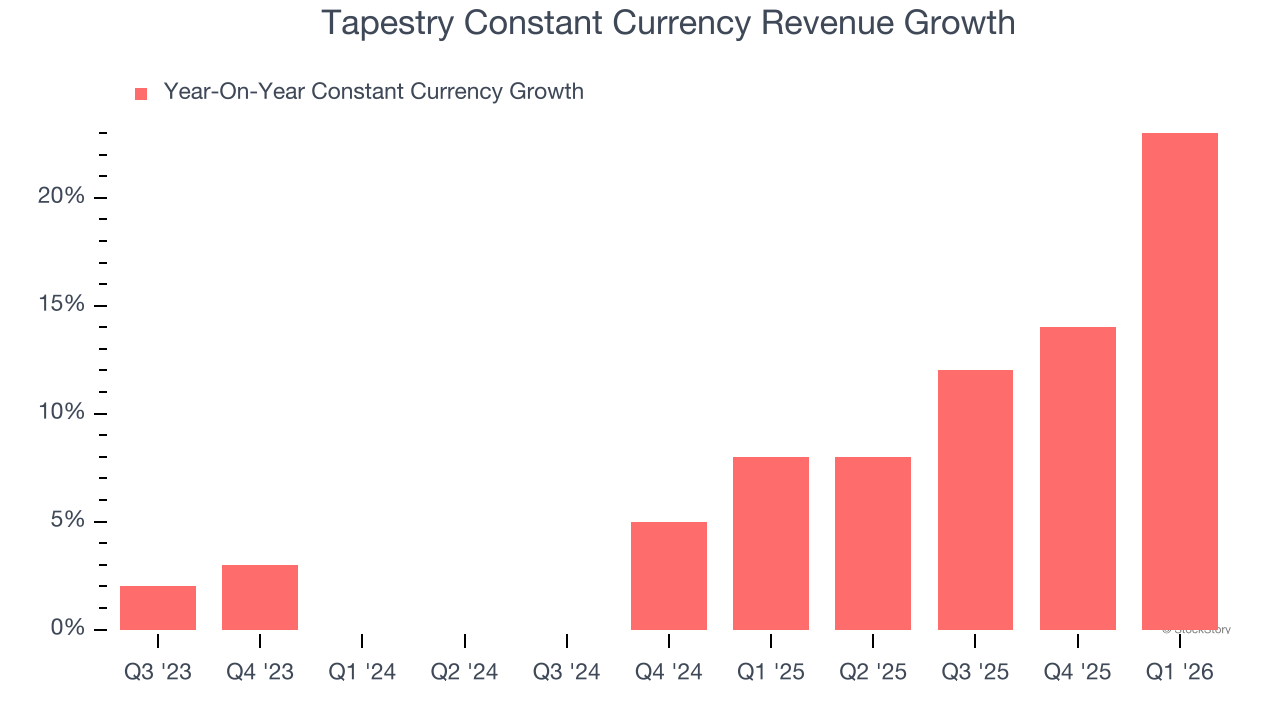
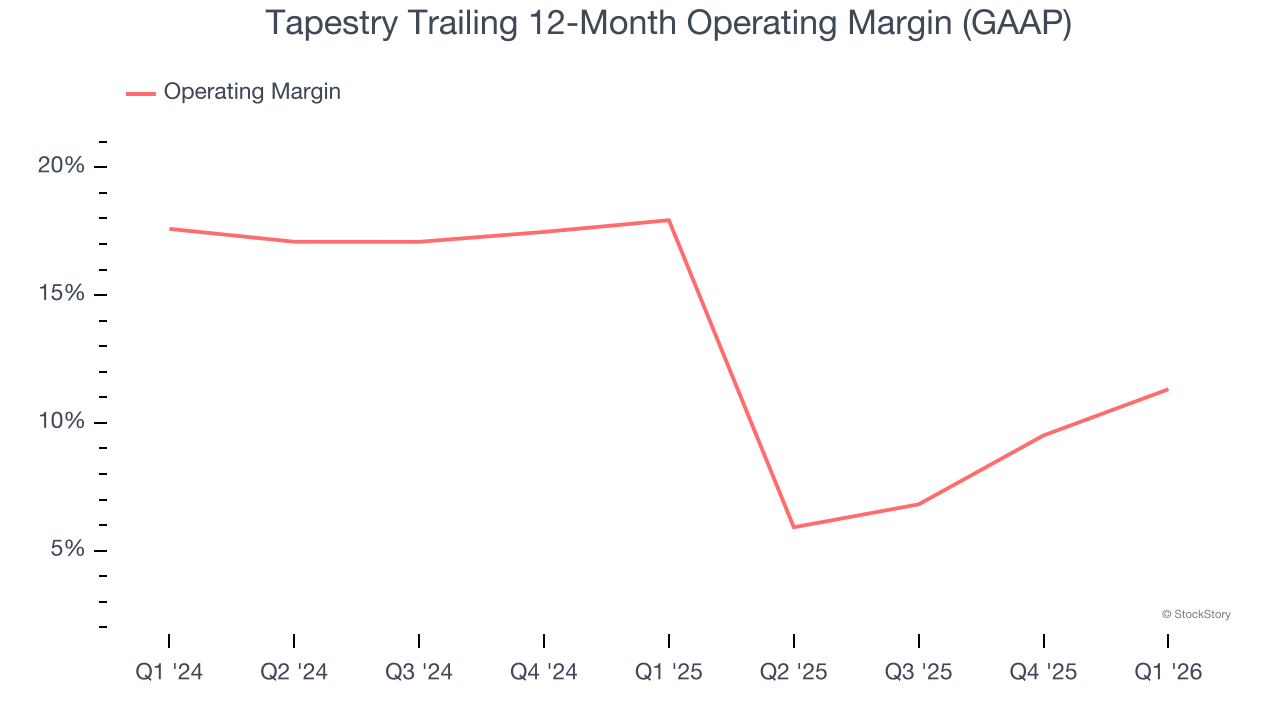
2. Weak Operating Margin Could Cause Trouble
Operating margin is a key measure of profitability. Think of it as net income - the bottom line - excluding the impact of taxes and interest on debt, which are less connected to business fundamentals.
Tapestry’s operating margin has been trending down over the last 12 months and averaged 14.4% over the last two years. The company’s profitability was mediocre for a consumer discretionary business and shows it couldn’t pass its higher operating expenses onto its customers.
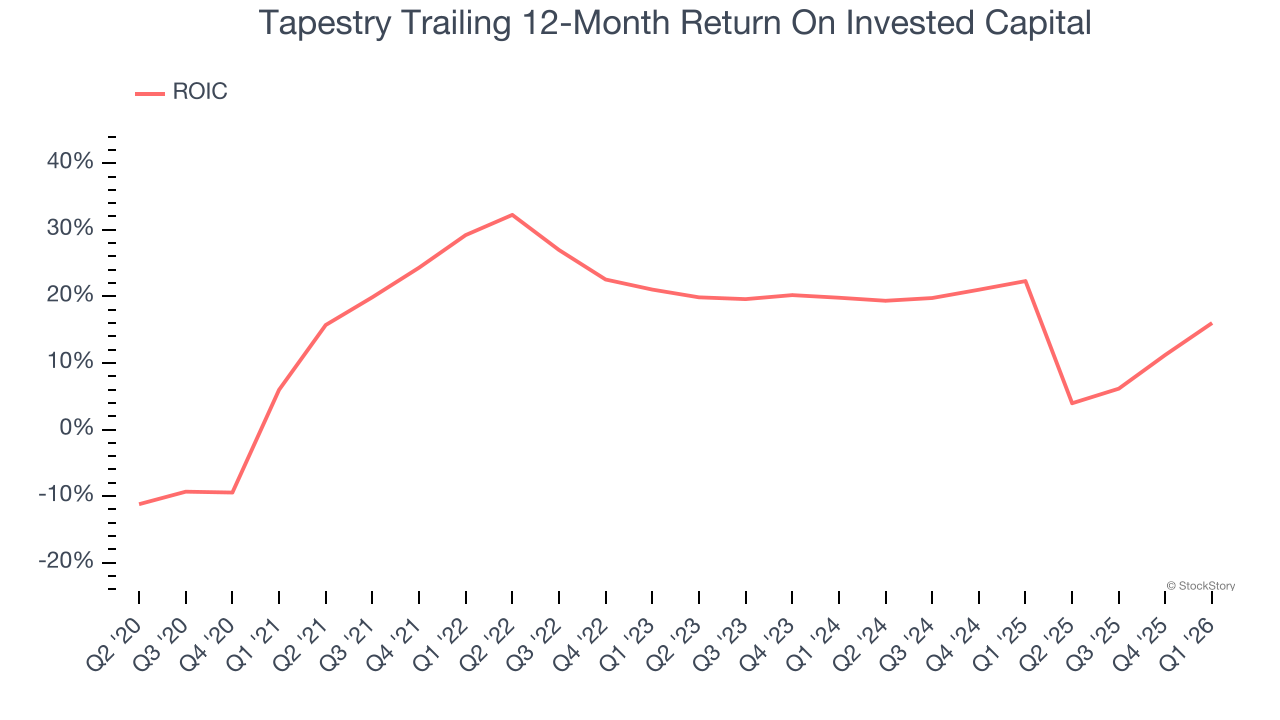
3. New Investments Fail to Bear Fruit as ROIC Declines
A company’s ROIC, or return on invested capital, shows how much operating profit it makes compared to the money it has raised (debt and equity).
We like to invest in businesses with high returns, but the trend in a company’s ROIC is what often surprises the market and moves the stock price. Unfortunately, Tapestry’s ROIC has decreased over the last few years. Paired with its already low returns, these declines suggest its profitable growth opportunities are few and far between.
Final Judgment
We see the value of companies helping consumers, but in the case of Tapestry, we’re out. With its shares outperforming the market lately, the stock trades at 17.3× forward P/E (or $131.63 per share). At this valuation, there’s a lot of good news priced in - you can find more timely opportunities elsewhere. Let us point you toward the most dominant software business in the world.
High-Quality Stocks for All Market Conditions
WHILE YOU’RE HERE: Top 9 Market-Beating Stocks. The best stocks don't just beat the market once. They do it again. And again. Robust revenue growth, rising free cash flow, returns on capital that leave their competition in the dust. The market has already rewarded these businesses.
But our AI platform says the party isn't over. Find out which 9 stocks made the cut this week - FREE. Get Our Top 9 Market-Beating Stocks for Free HERE.
Stocks that have made our list include now familiar names such as Nvidia (+1,326% between June 2020 and June 2025) as well as under-the-radar businesses like the once-small-cap company Comfort Systems (+782% five-year return). Find your next big winner with StockStory today.


