
Following its recently-released fiscal fourth quarter (ended May 2023) report, shares of the sportswear behemoth NIKE Inc. (NKE) have experienced a downtrend. Despite a 5% increase in revenues, the company’s net income came in at $1.03 billion, 28% lower compared to the same period in the preceding year. Concurrently, its EPS dropped by 27% year-over-year, asserting a figure of $0.66 and falling short of analysts’ forecasts.
Moreover, its gross margin decreased 140 basis points to 43.6%, predominantly attributable to escalated costs, increased markdowns, and ongoing unfavorable shifts in net foreign currency exchange rates. However, its inventory position improved.
Furthermore, NIKE’s conservative forecast for the ongoing fiscal year fueled investors’ apprehensions. The company anticipates mid-single-digit growth in revenue, with gross margins expected to improve between 1.4 and 1.6 percentage points for fiscal 2024. Furthermore, expectations for the current quarter include flat to up low single digits revenue growth and a mild contraction in gross margins between 0.5 to 0.75 percentage points.
Although NKE’s global reach and consumer brand affinity should help it remain buoyed, impending recession concerns could pressure margins as consumers cut back on discretionary spending. Therefore, investing now in NIKE’s stock might not yield optimal returns.
Let’s examine some of its key metrics that strengthen our case.
NKE’s Financial Performance: Net Income, Revenue, and Gross Margin Amid Periodic Fluctuations
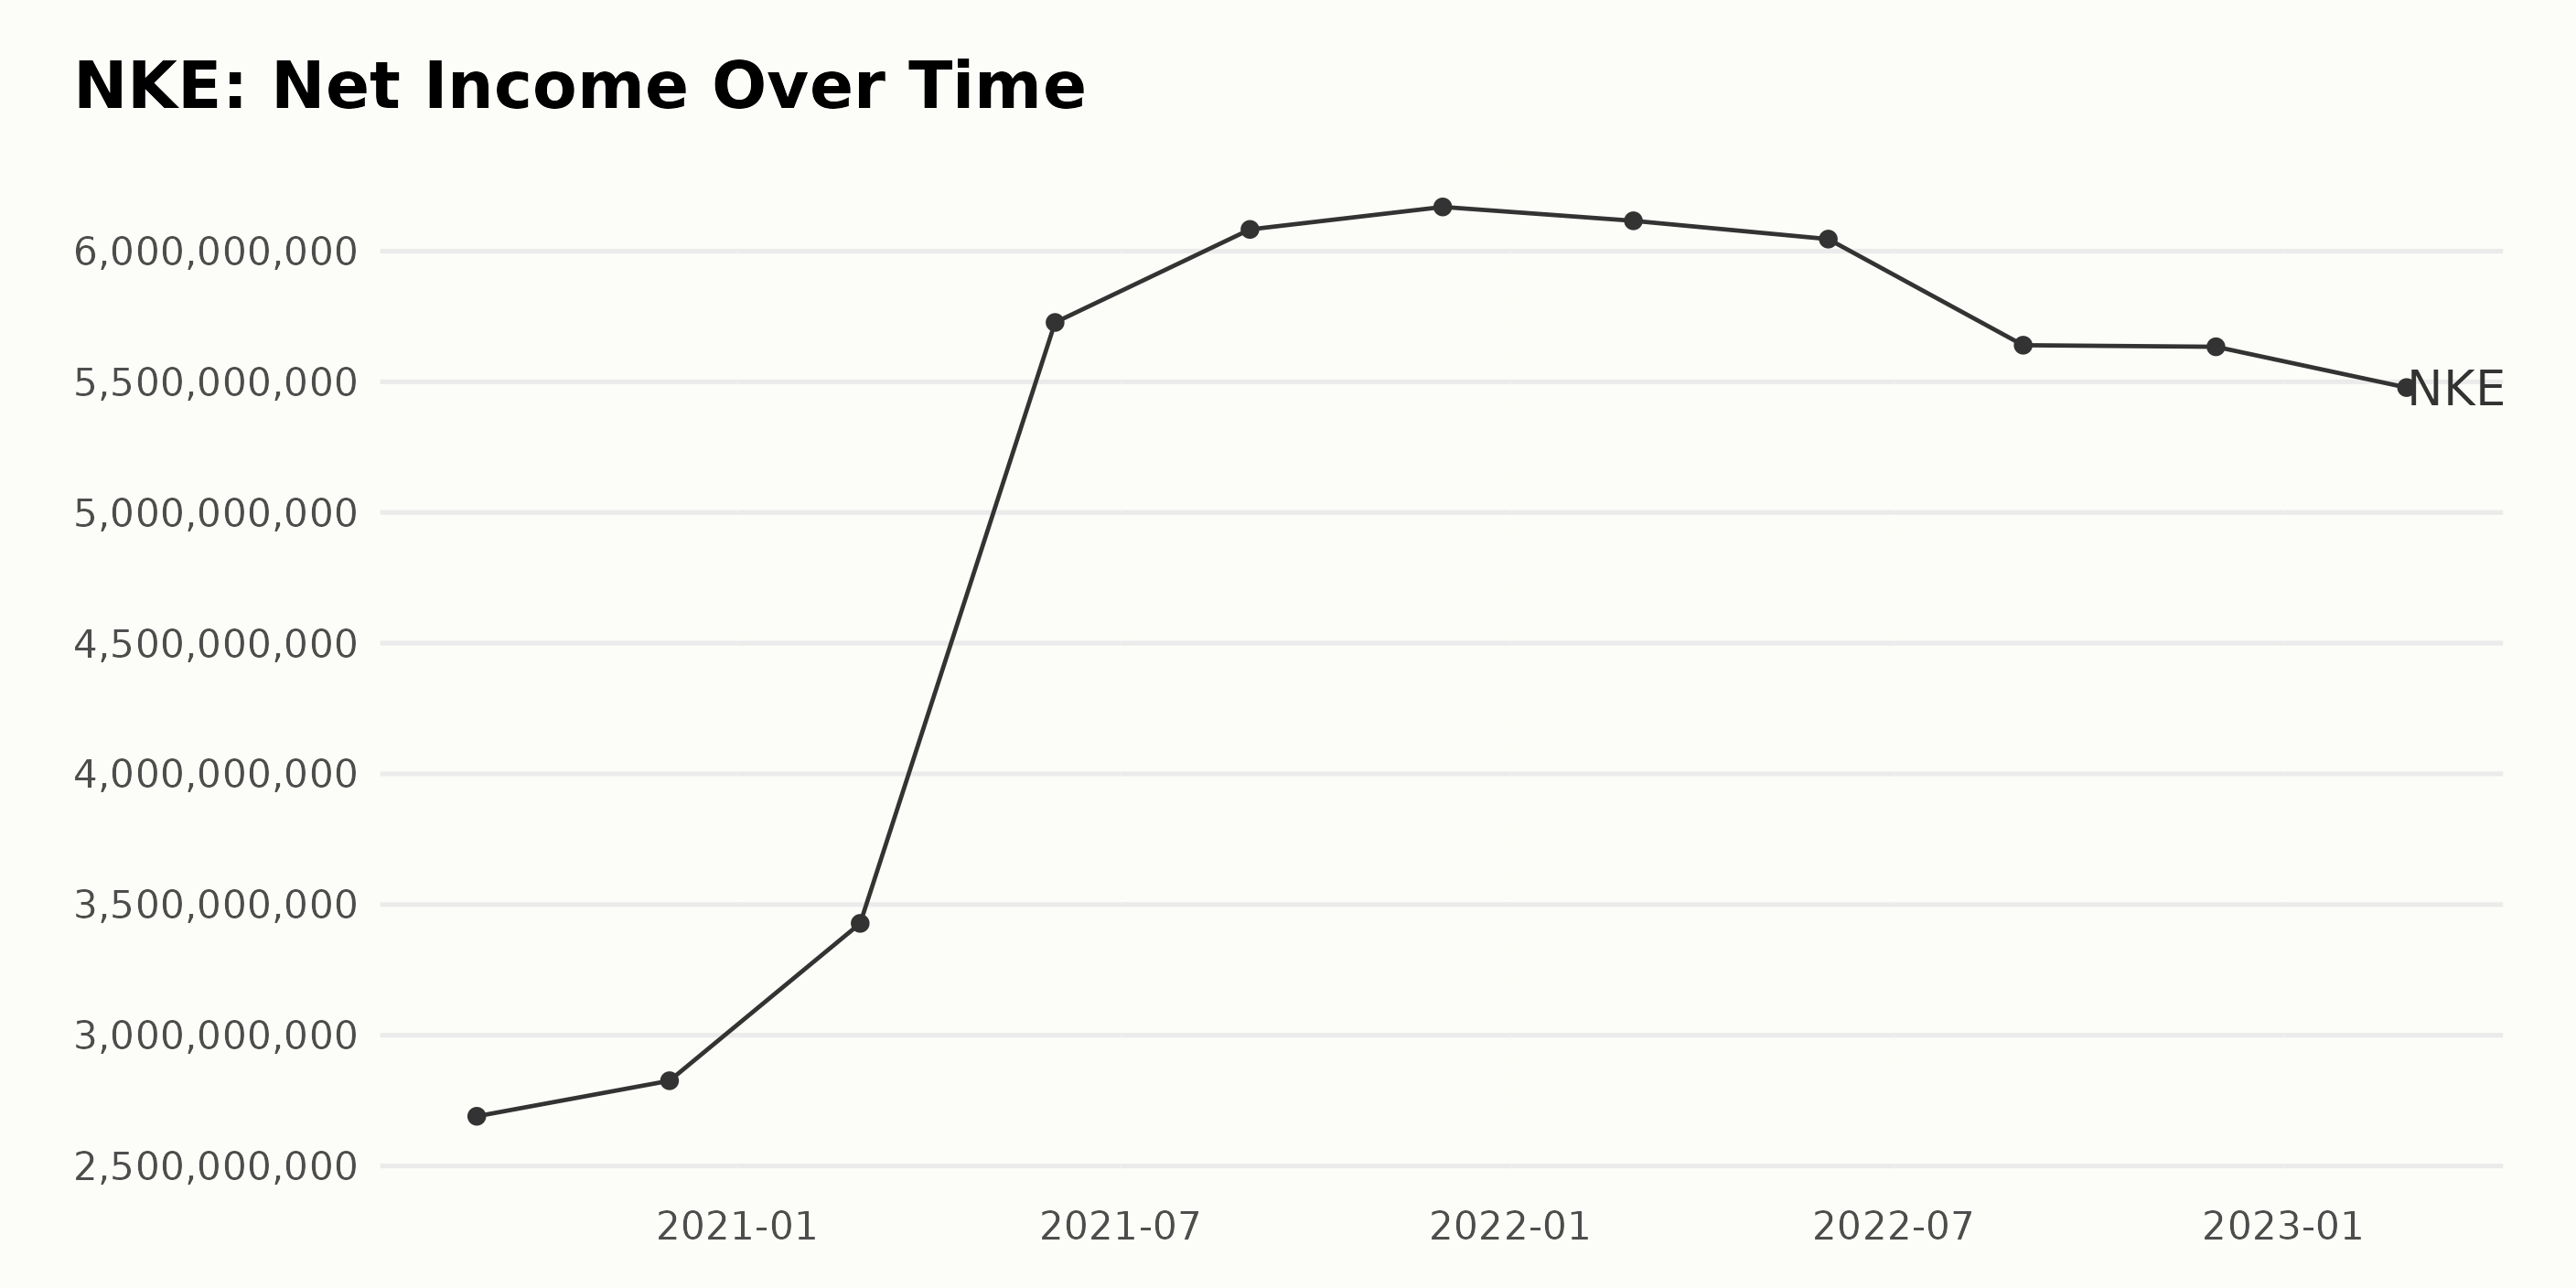
NKE’s trailing-12-month net income presents a generally increasing trend, though it experienced some fluctuations over the past few years. Here’s a summary of the progression:
- August 2020:NKE started with a net income of $2.69 billion.
- November 2020:A slight increase to $2.83 billion.
- February 2021:A significant jump to $3.43 billion, marking a growth phase.
- May 2021:Demonstrating an impressive leap in revenue, NKE netted $5.73 billion.
- August 2021:Continuing the upward trend, the net income peaked at $6.08 billion.
- November 2021:NKE marked its all-time high net income of $6.17 billion, reflecting tremendous growth from August 2020.
However, the data indicate a gradual decline followed:
- February 2022:The net income slightly decreased to $6.12 billion.
- May 2022:Net income further dropped to $6.05 billion.
- August 2022:Income continued to decline to a significant $5.64 billion.
- November 2022:Saw a very marginal decrease to $5.63 billion.
- February 2023:NKE reported a decline to $5.48 billion.
To calculate the overall growth rate from August 2020 to February 2023 (from the first value to the last in the series), we see that the net income of NKE increased by approximately $2.79 billion. This reflects an uptrend despite periodic fluctuations amid recent quarters. It’s worth noting that the most recent quarters show a downward trend, which requires monitoring in the coming months.
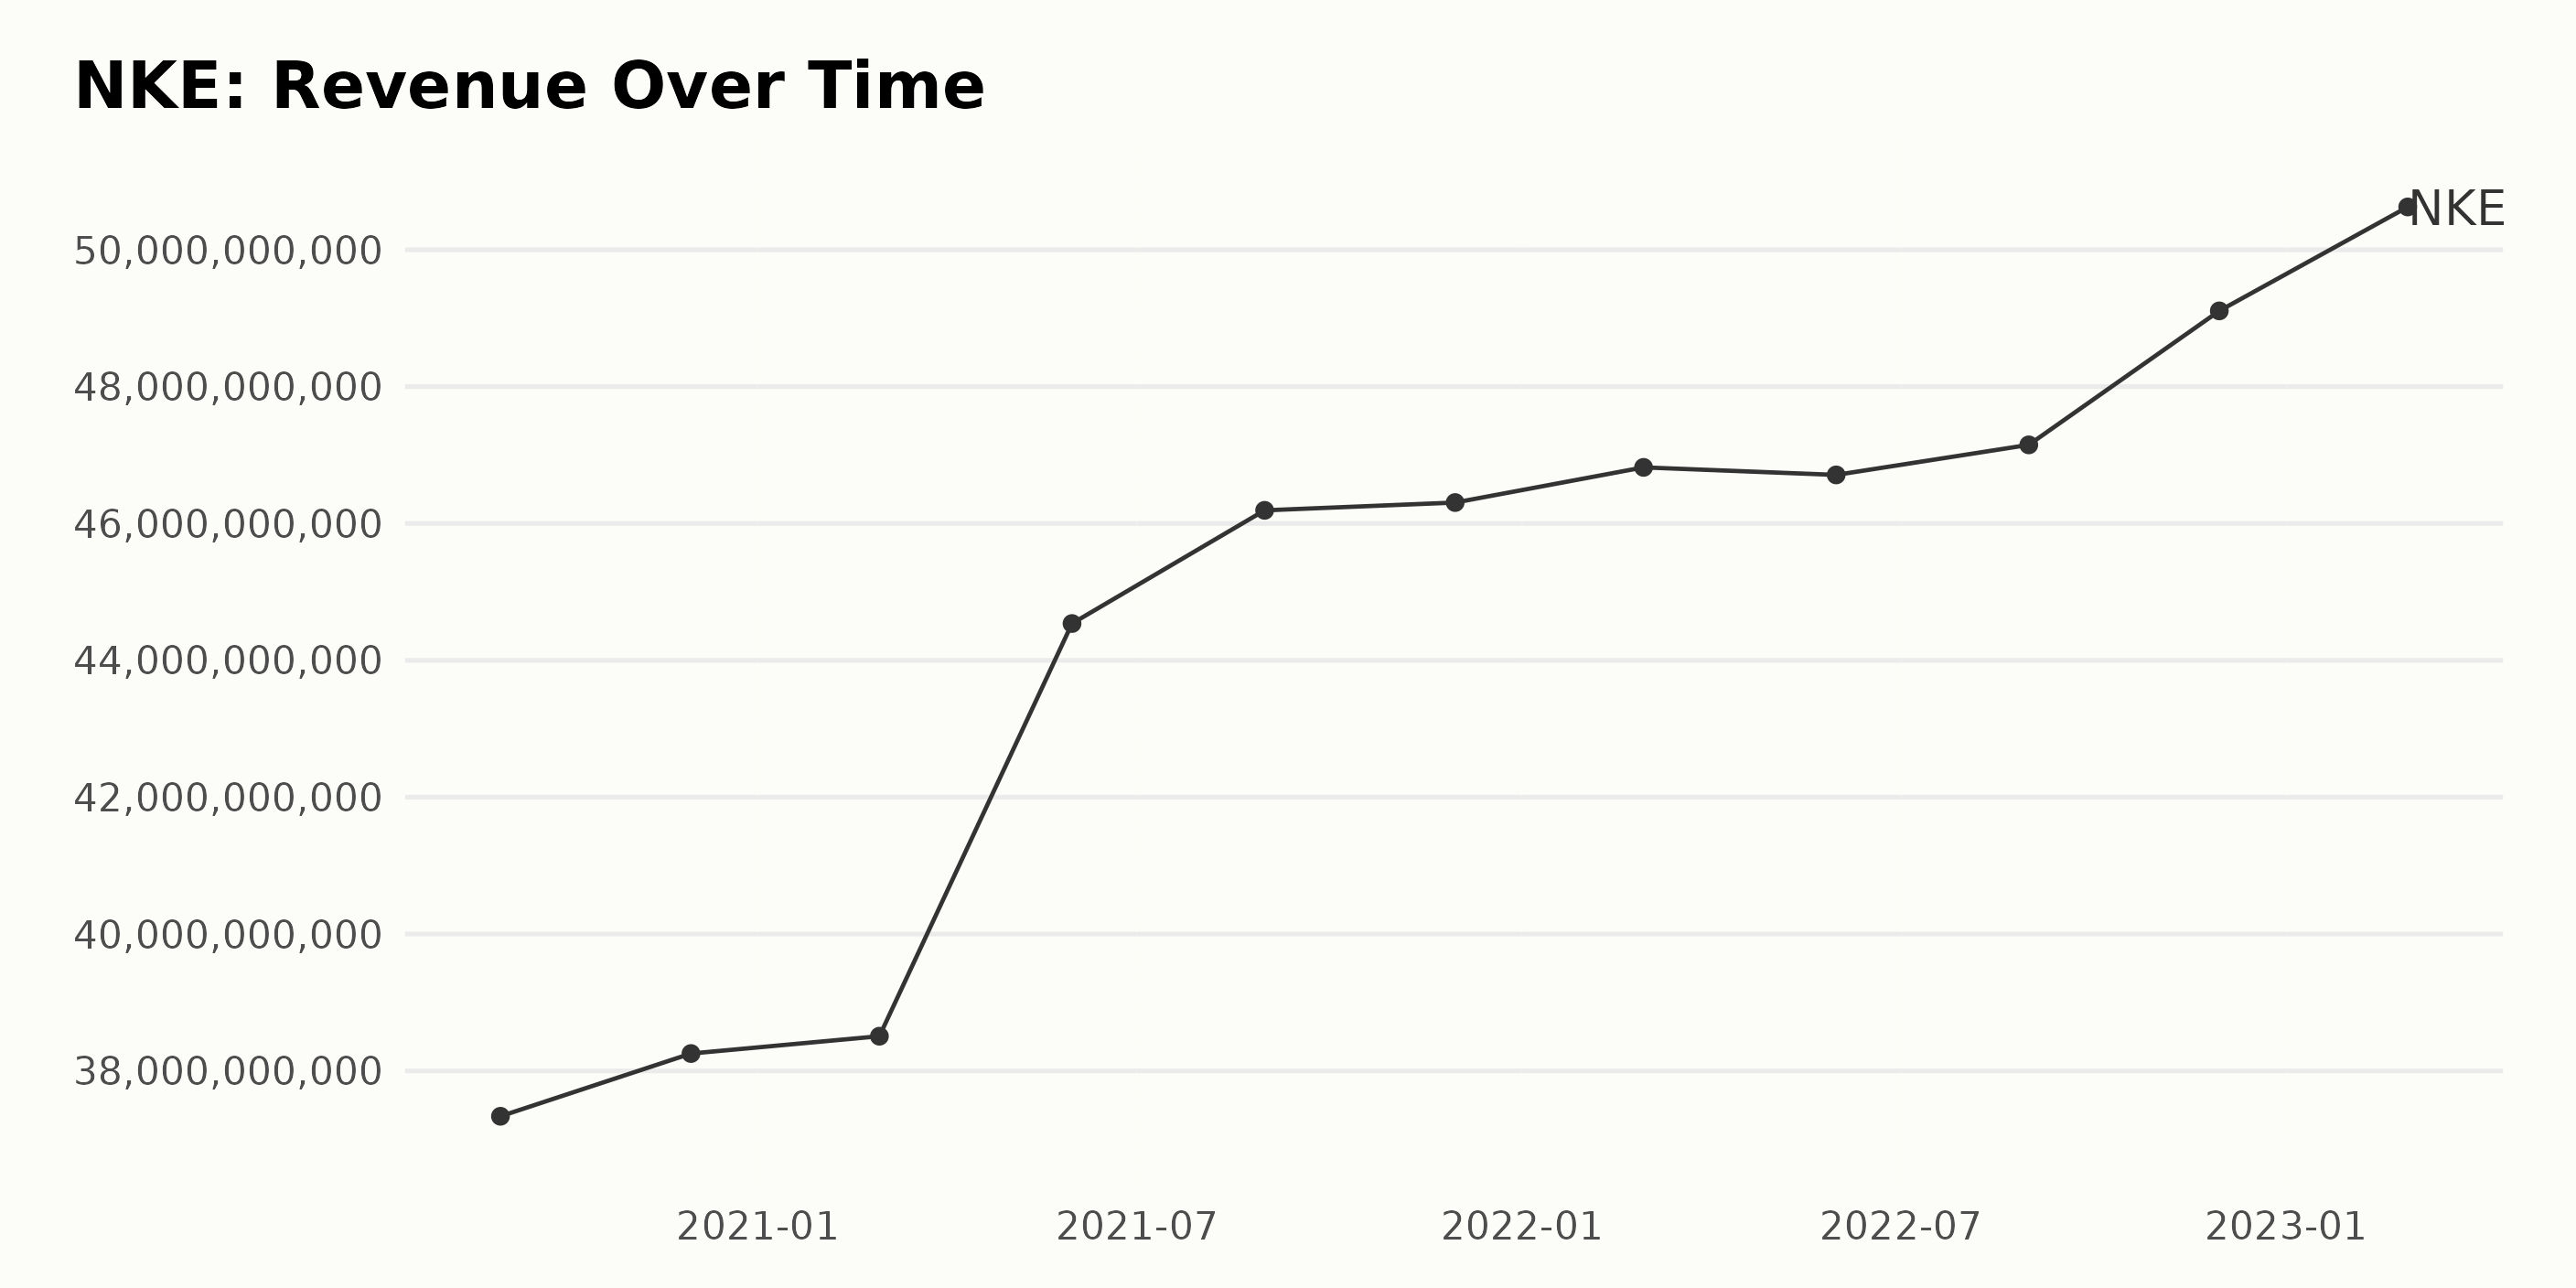
The trailing-12-month revenue of NKE has followed a general trend of increase with some minor fluctuations, starting from August 2020 till February 2023, showing robust financial performance. Consider the analyzed data below: -
- August 2020: The revenue was at $37.34 billion.
- November 2020: An increment to $38.25 billion was observed.
- February 2021: The revenue showed a slight rise to $38.51 billion.
- May 2021: There was a significant jump in revenue to $44.54 billion.
- August 2021: It continued the growth trend, reaching $46.19 billion.
- November 2021: Revenue slightly increased to $46.31 billion.
- February 2022: A further increase to $46.82 billion was reported.
- May 2022: Despite a small decline to $46.71 billion, the general growth trend remained intact.
- August 2022: Revenue recovered and improved to $47.15 billion.
- November 2022: The company experienced a healthy revenue boost to $49.11 billion.
- February 2023: Finally, the revenue peaked at $50.63 billion.
Over the whole period from August 2020 ($37.34 billion) to February 2023 ($50.63 billion), Nike’s revenue has grown approximately by 35%. Notably, there have been only minor dips between February and May 2022. However, these temporary declines did not disrupt NKE’s overall upward trajectory. Substantial growth is evident yearly, highlighting the firm’s resilient performance and increasing market strength.
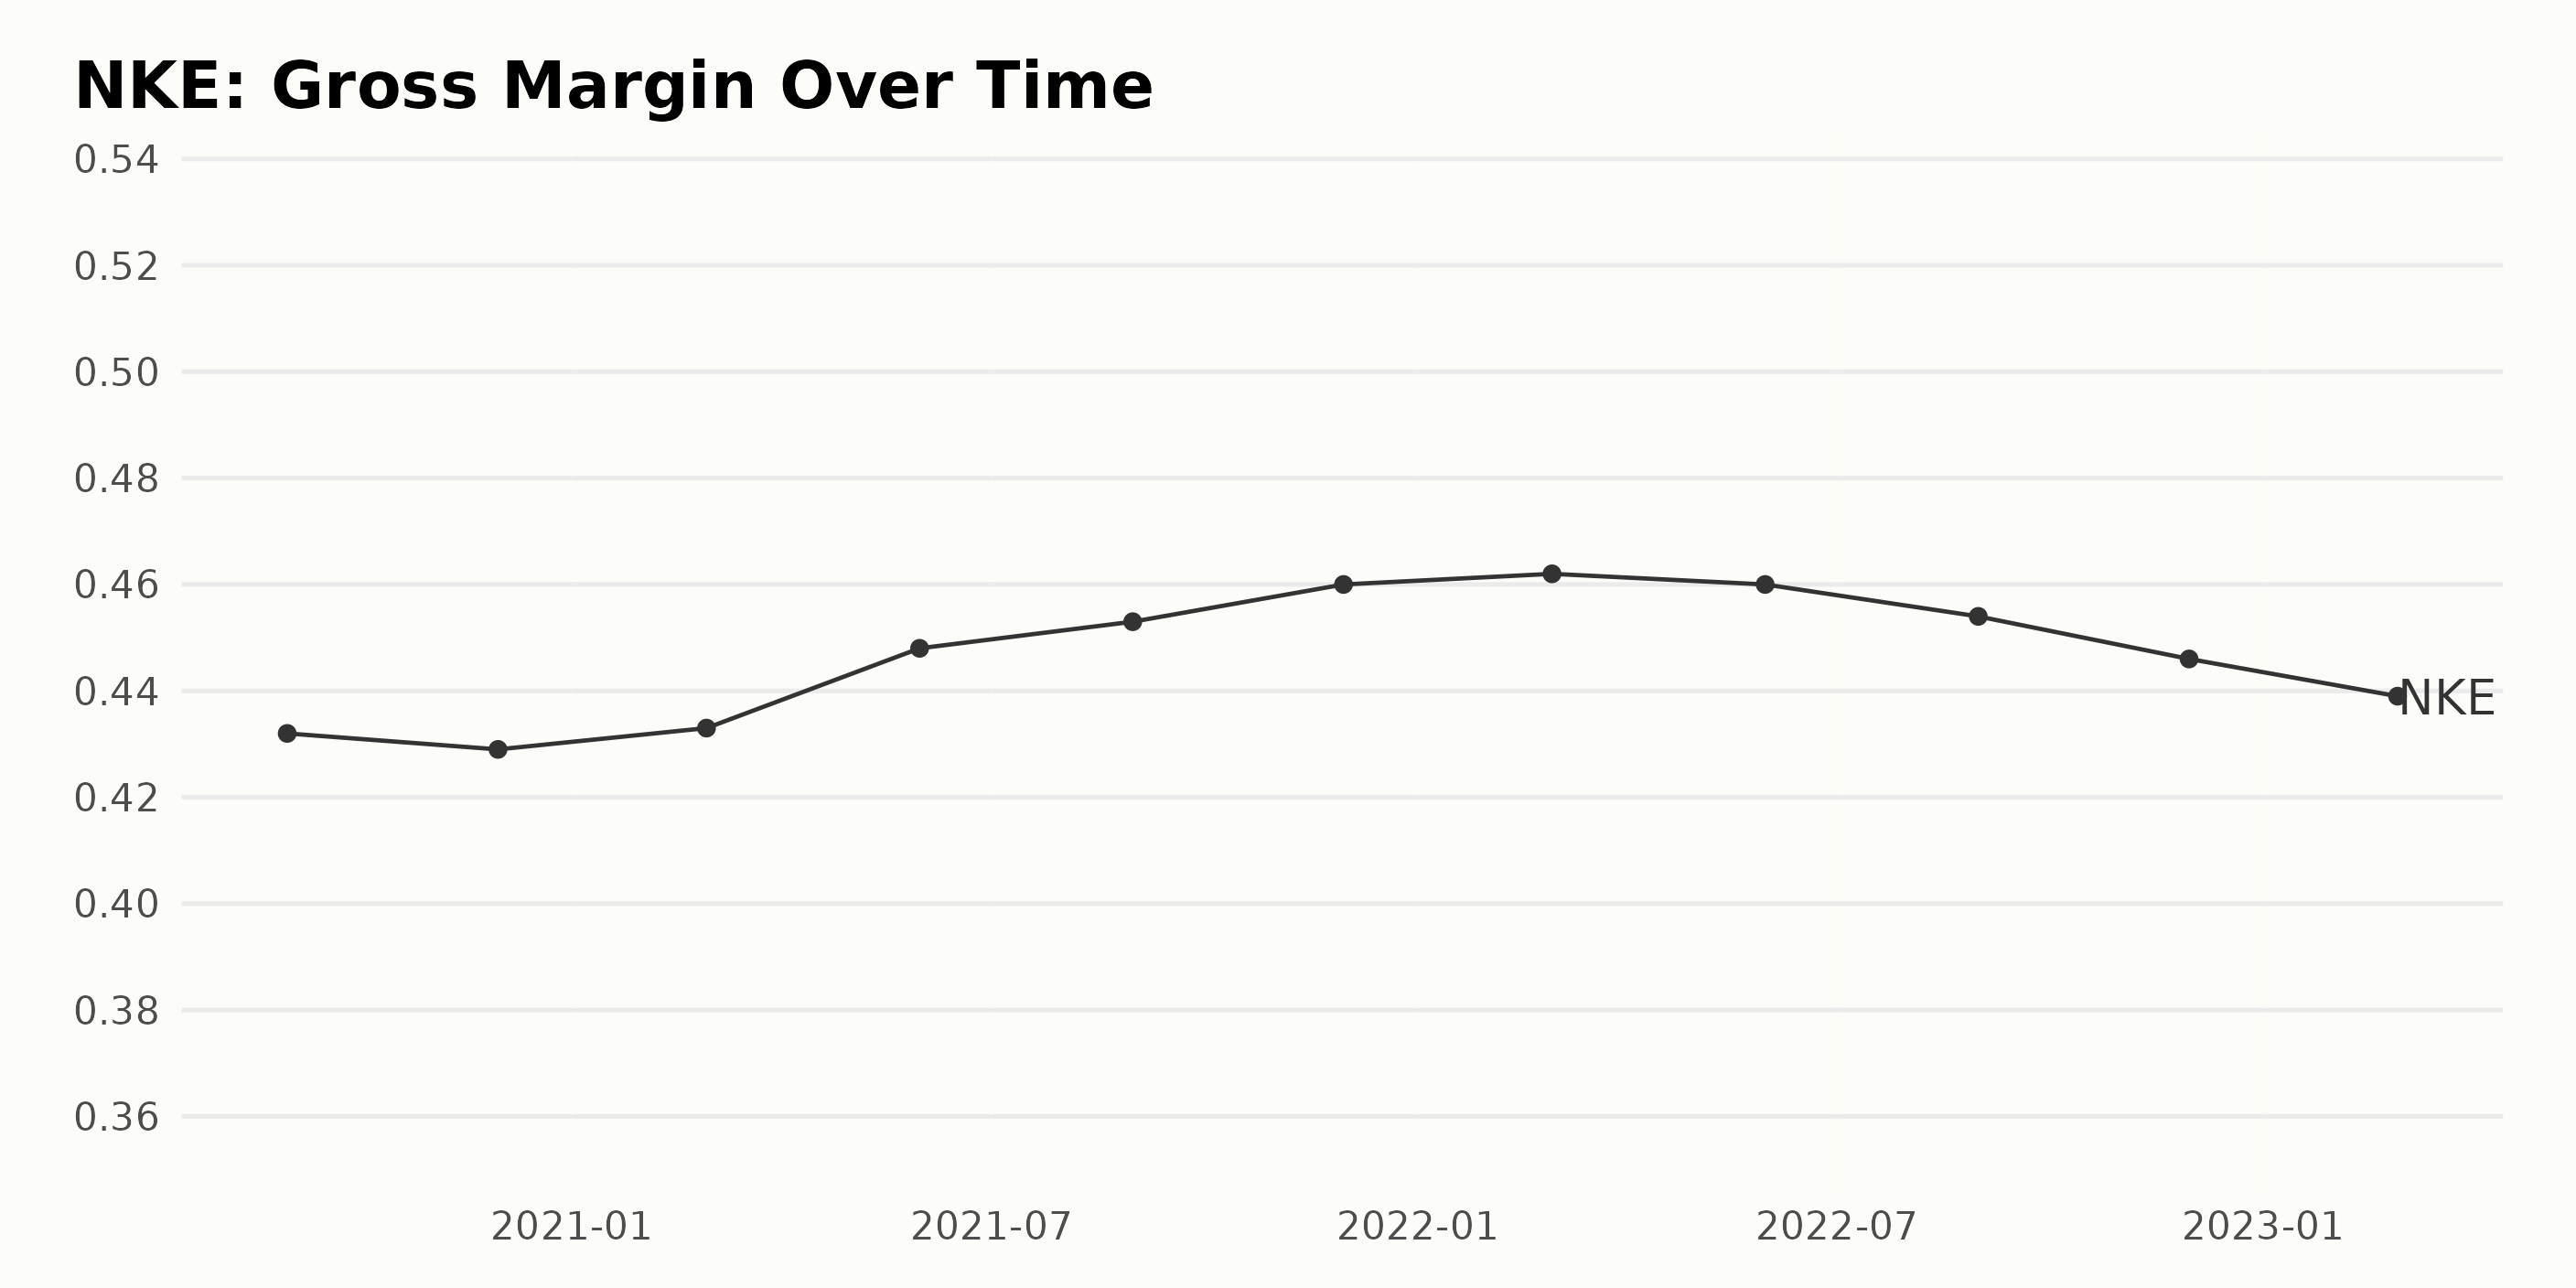
The data series reflects the gross margin for NKE over a number of reporting periods from August 2020 through to February 2023. Looking closely at the trends and fluctuations:
- The gross margin for NKE in August 2020 was 43.20%.
- By November 2020, it slightly decreased to 42.90%.
- A minor increase was observed by February 2021 to 43.30%, followed by a more significant rise to 44.80% in May 2021.
- August 2021 witnessed another growth, with the gross margin reaching 45.30%. However, this was followed by fluctuating dips and rises over the next year, culminating at 46.20% in February 2022.
- A slight dip was reported in May 2022, bringing the gross margin back to 46.00%.
- The figures then underwent a continued downturn from August 2022 to February 2023, peaking at 45.40% in August 2022 before settling at 44.60% in November 2022 and further decreasing to 43.90% in February 2023.
From the initial value in August 2020 to the last reported value in February 2023, the gross margin experienced an overall increase of roughly 0.70 percentage points or 1.62% growth.
NKE’s Fluctuating Share Prices: Examining the Descending Trend in 2023
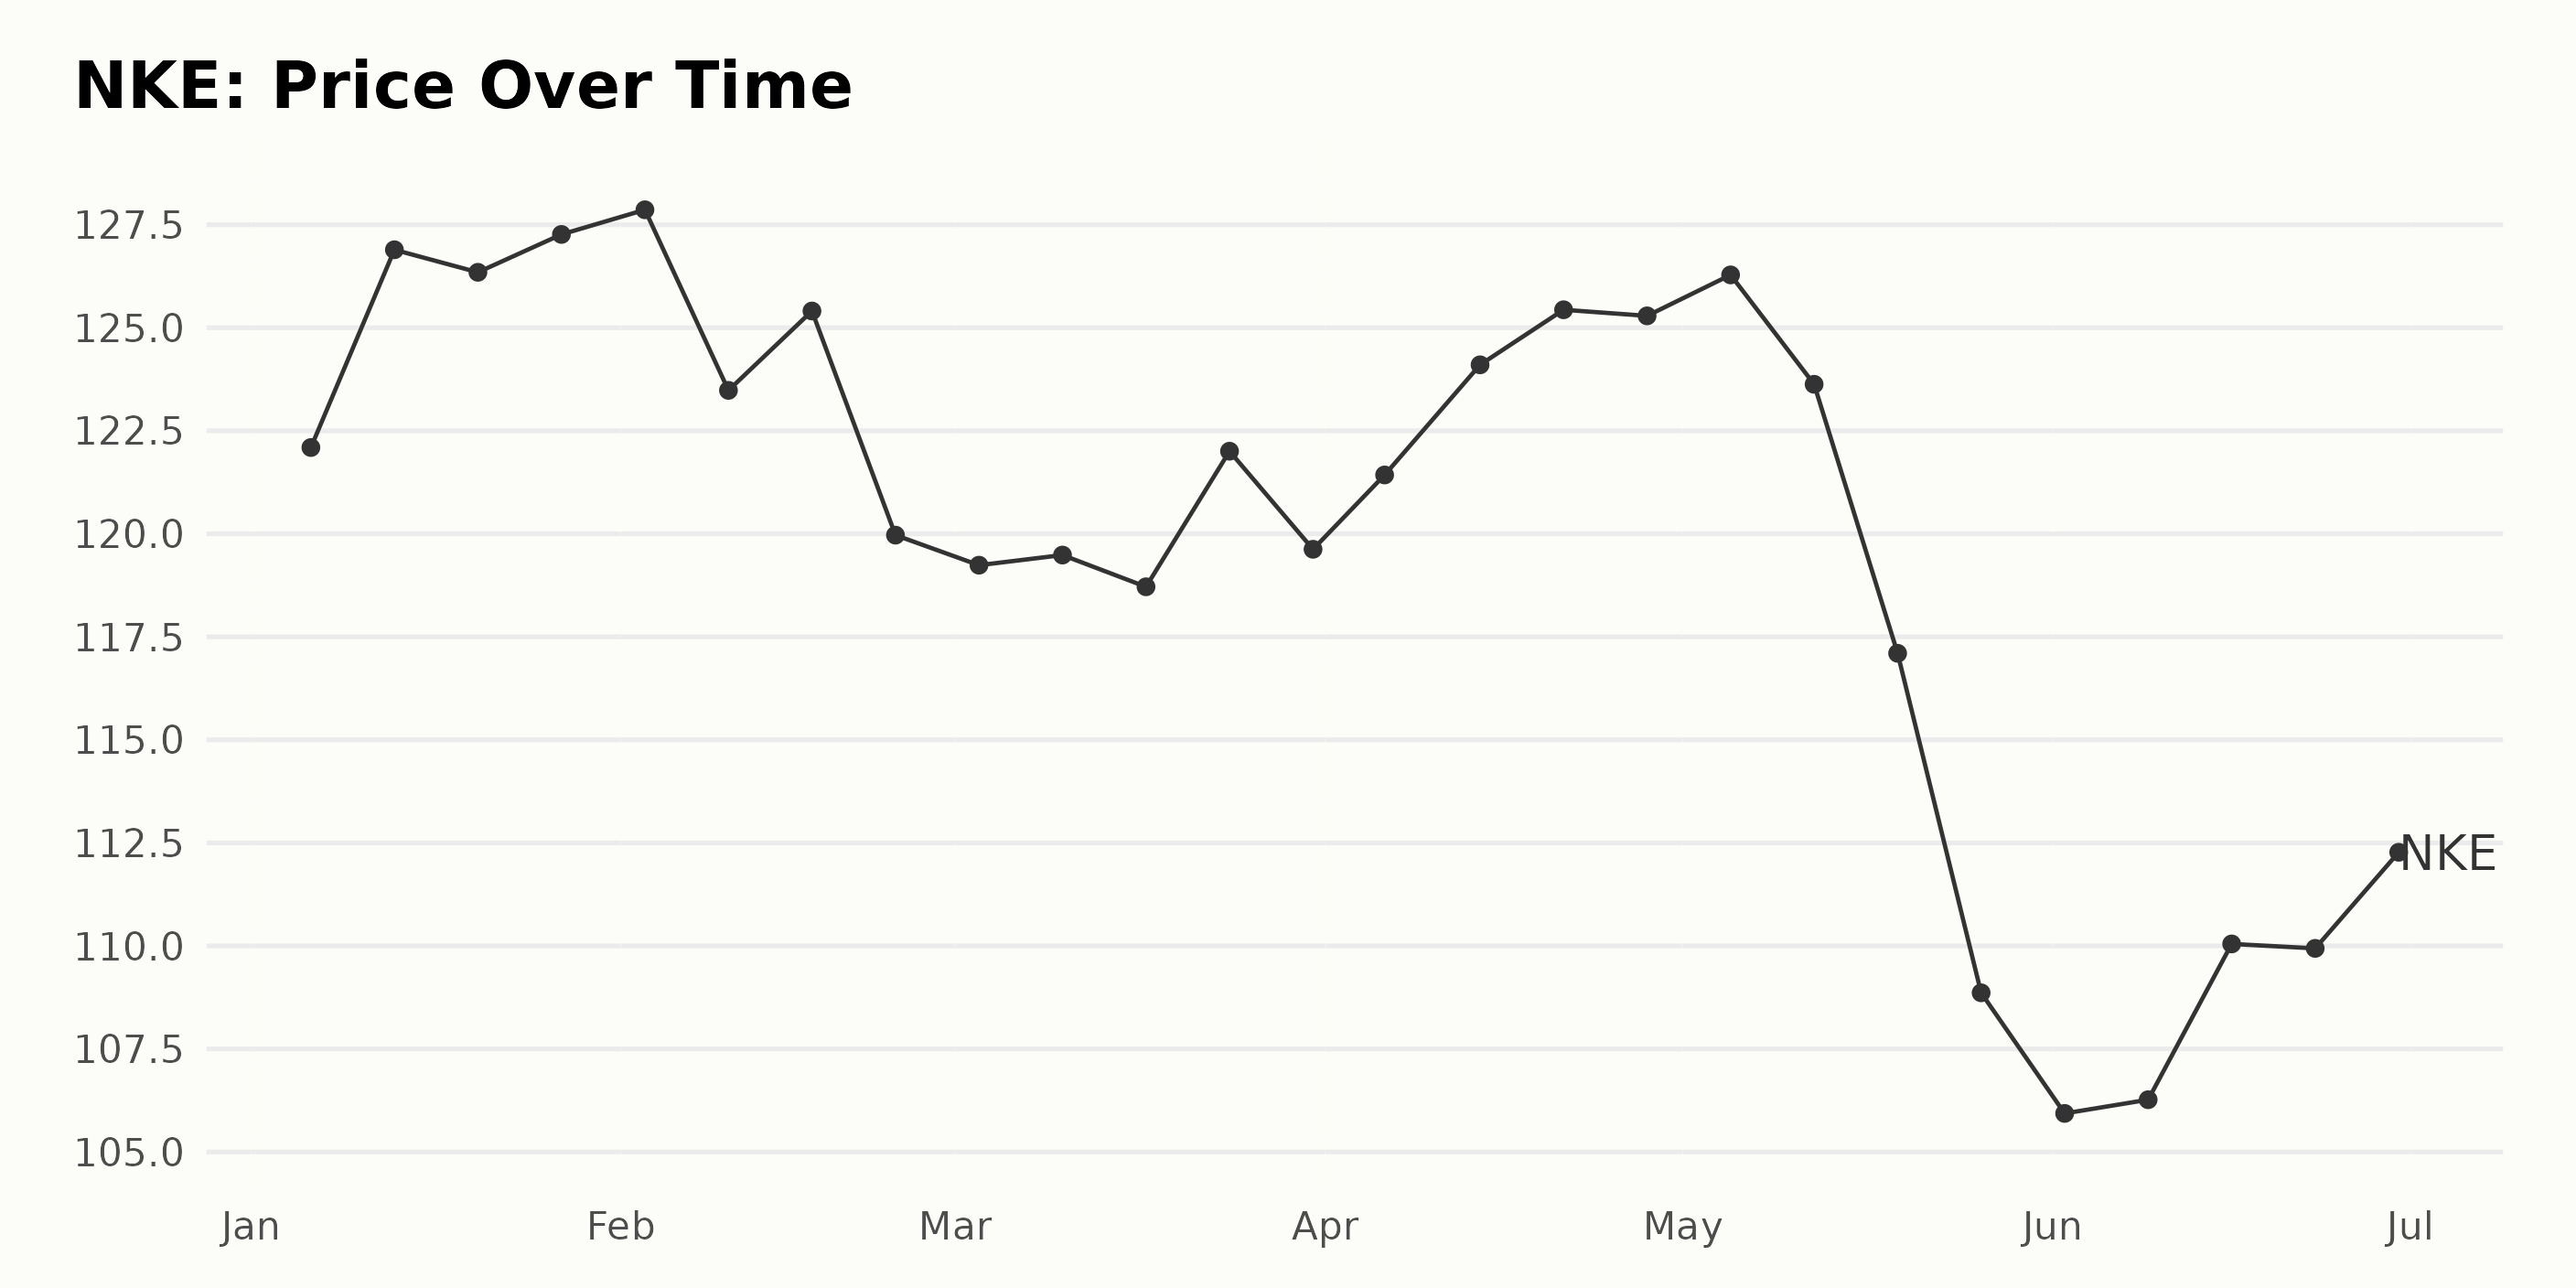
NKE’s share prices show a fluctuating yet generally decreasing trend from January 2023 to June 2023, with a notable deceleration in the last two months of May and June.
- At the start of the year, on January 6, 2023, Nike’s share price was $121.23.
- There was an upward trend during January, peaking at $127.86 by February 3, 2023.
- The decline began on February 10, 2023, with the price dropping to $123.48 and further decreasing to approximately $119 by the end of February and throughout most of March.
- In April 2023, slight progress is observed, with the stock reaching $125.44 by April 21, starting another short-lived increasing trend.
- Starting mid-May, a rapid drop is noted in the share prices, depreciating to $117.1 by May 19, 2023, and reaching a low of $105.94 by June 2, 2023.
- The remainder of June shows a slow recovery, with the price ending at $110.37 by June 30, 2023.
In conclusion, NKE’s stock has shown some volatility over the period, with an overall decreasing trend in the first half of 2023. The sharp decline that started in mid-May could point to an important issue affecting the company’s performance or changes in the market’s outlook towards the company. Here is a chart of NKE’s price over the past 180 days.
NKE’s POWR Ratings Analysis
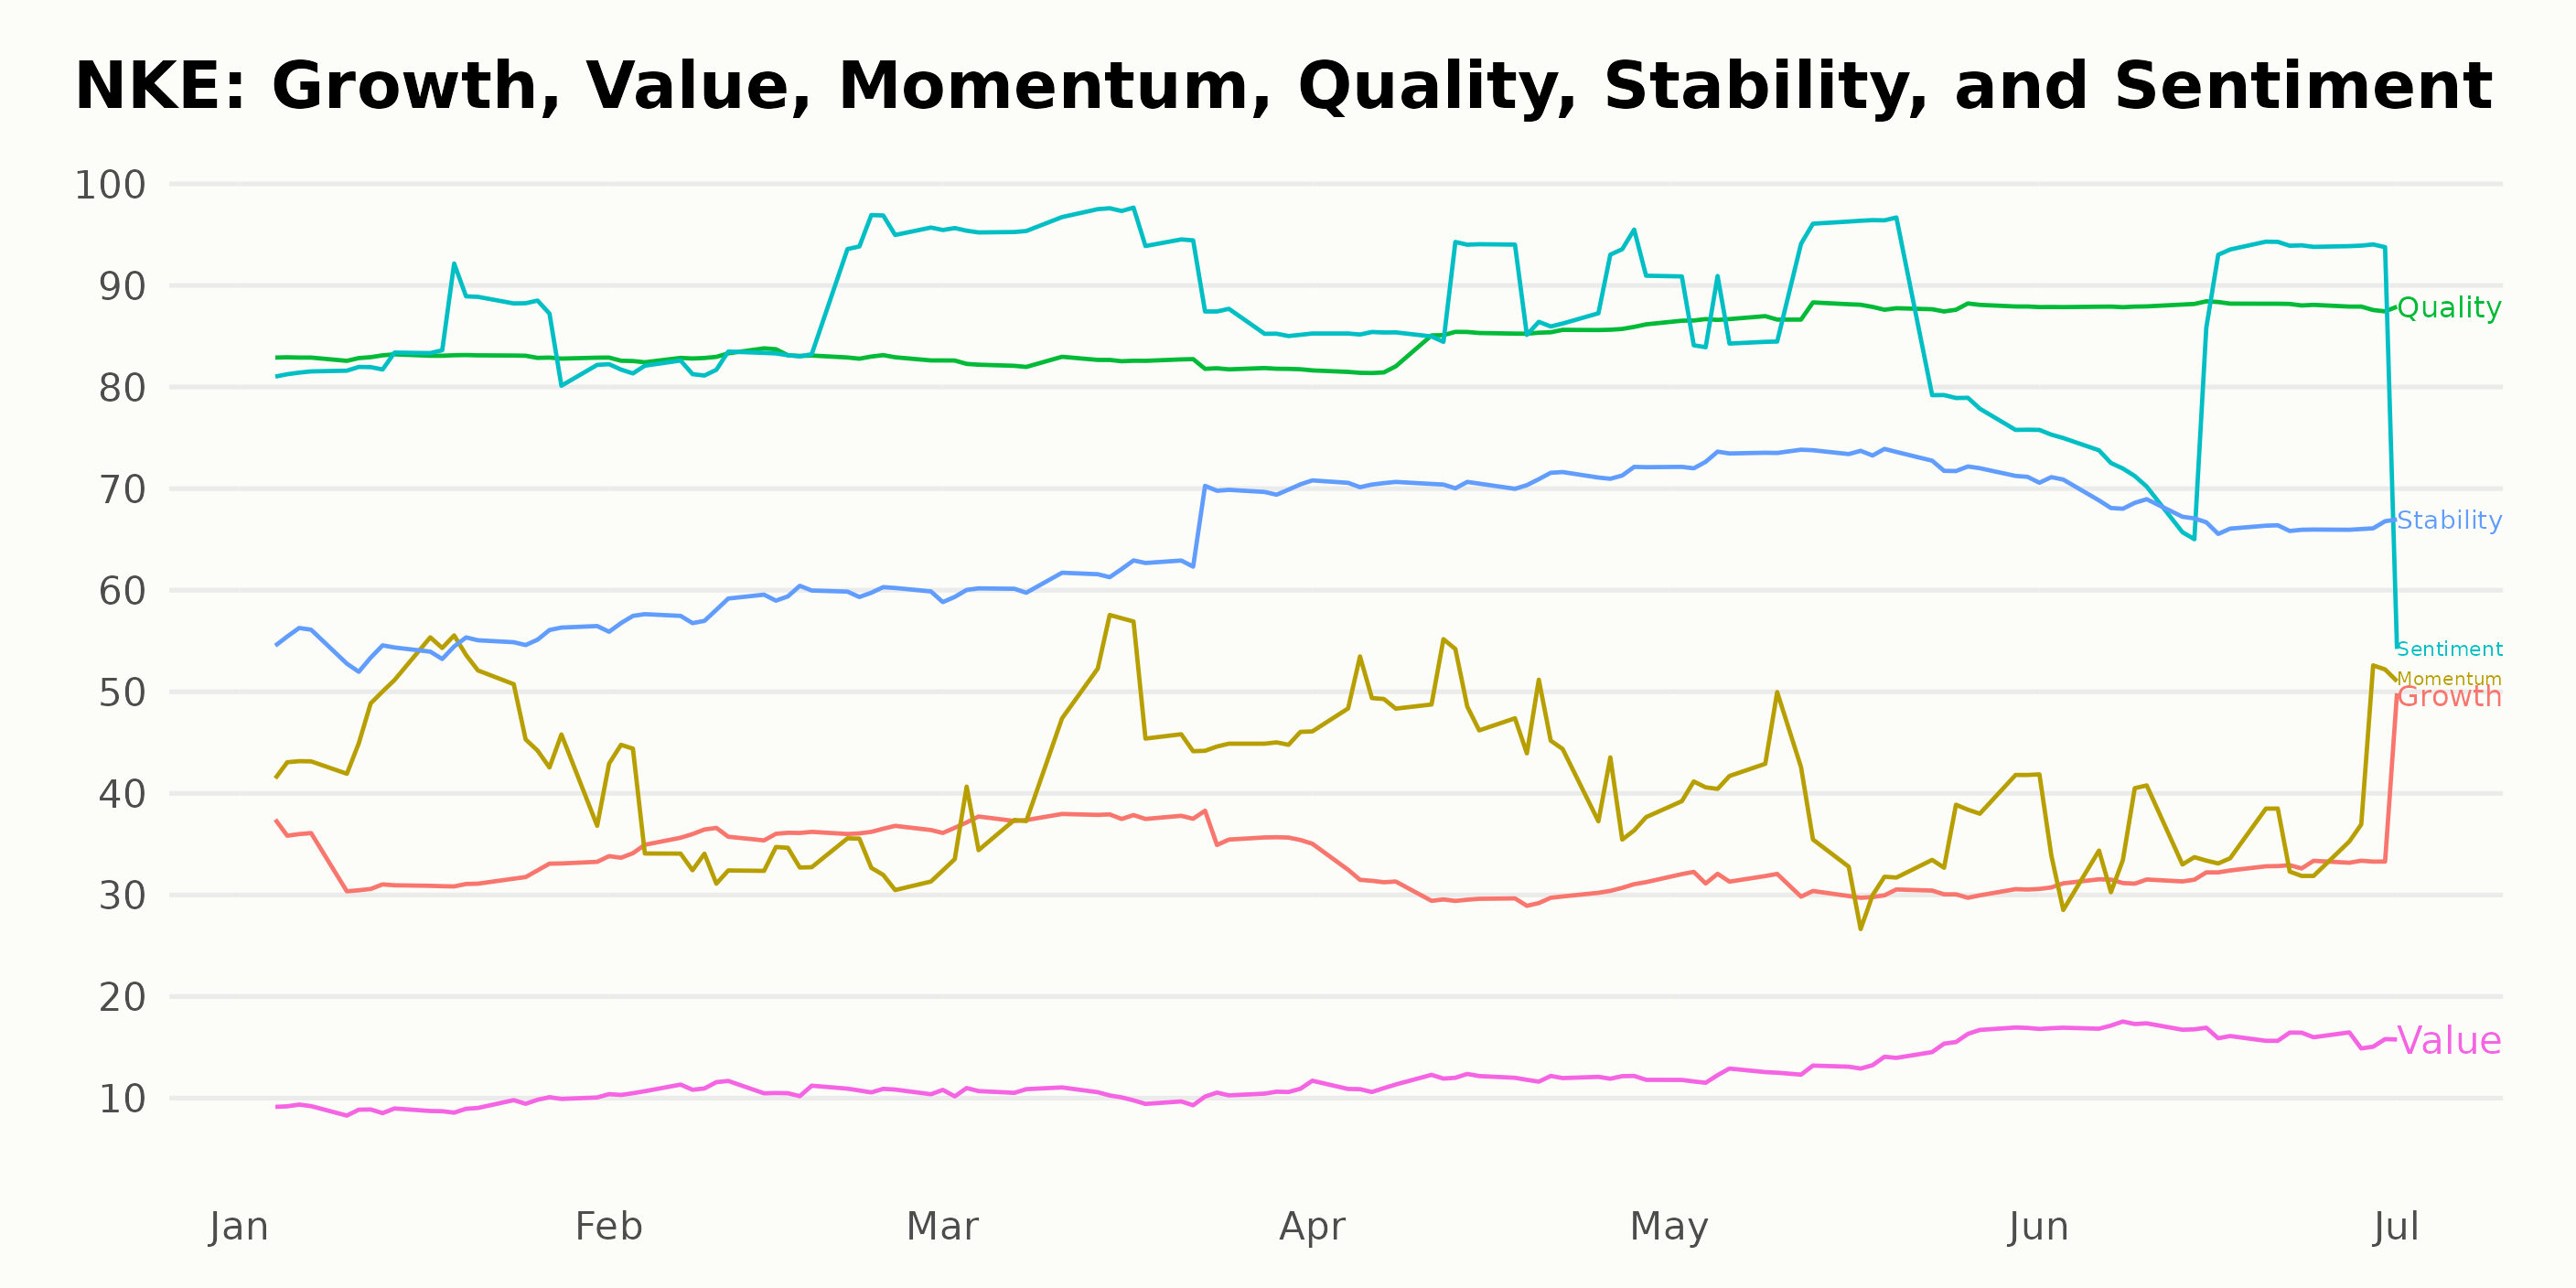
NKE is from the Athletics & Recreation category of stocks, which hosts 37 stocks in total and has had significant activity regarding its POWR Ratings over the recent months. NKE has an overall C rating, translating to a Neutral in our proprietary system. It also has a C grade for Growth, Stability, Sentiment, and Momentum.
The data provided spans from January 7, 2023, to July 1, 2023, and records the consistent overall rating of C for NKE throughout that period. The rank in category data is particularly noteworthy, which shows a fluctuating yet overall improved standing for NKE within its category over time.
Specifically, at the beginning of the dataset duration, on January 7, 2023, NKE ranked as #17. By July 1, 2023, the company had advanced to occupy the #10 position among the 37 stocks, an improvement of seven positions. Here are some more important notes:
- On February 18, 2023, that rank improved to #16.
- By the week of March 4, 2023, NKE had climbed to the #13 spot.
- The most significant improvement seemed to occur by May 20, 2023, when NKE was ranked #9 amongst its peers.
- As of the most recent data point on July 1, 2023, NKE retains a top-third position, standing at #10 within the Athletics & Recreation stocks category.
Stocks to Consider Instead of Nike Inc. (NKE)
Other stocks in the Athletics & Recreation sector that may be worth considering are Marine Products Corporation (MPX), MasterCraft Boat Holdings, Inc. (MCFT), and American Outdoor Brands, Inc. (AOUT) -- they have better POWR Ratings.
What To Do Next?
Get your hands on this special report with 3 low priced companies with tremendous upside potential even in today’s volatile markets:
3 Stocks to DOUBLE This Year >
NKE shares were trading at $109.53 per share on Monday afternoon, down $0.84 (-0.76%). Year-to-date, NKE has declined -5.82%, versus a 16.93% rise in the benchmark S&P 500 index during the same period.
About the Author: Subhasree Kar

Subhasree’s keen interest in financial instruments led her to pursue a career as an investment analyst. After earning a Master’s degree in Economics, she gained knowledge of equity research and portfolio management at Finlatics.
The post Is Nike (NKE) a Quality Stock? appeared first on StockNews.com