
Homebuilder Tri Pointe Homes (NYSE: TPH) fell short of the market’s revenue expectations in Q1 CY2026, with sales falling 31.5% year on year to $507.9 million. Its non-GAAP profit of $0.16 per share was in line with analysts’ consensus estimates.
Is now the time to buy Tri Pointe Homes? Find out by accessing our full research report, it’s free.
Tri Pointe Homes (TPH) Q1 CY2026 Highlights:
- Revenue: $507.9 million vs analyst estimates of $537.1 million (31.5% year-on-year decline, 5.4% miss)
- Adjusted EPS: $0.16 vs analyst estimates of $0.17 (in line)
- Adjusted EBITDA: $39.86 million (7.8% margin, 66% year-on-year decline)
- Adjusted EBITDA Margin: 7.8%, down from 15.8% in the same quarter last year
- Backlog: $989.9 million at quarter end, down 24.3% year on year
- Market Capitalization: $3.99 billion
Company Overview
Established in 2009 in California, Tri Pointe Homes (NYSE: TPH) is a United States homebuilder recognized for its innovative and sustainable approach to creating premium, life-enhancing homes.
Revenue Growth
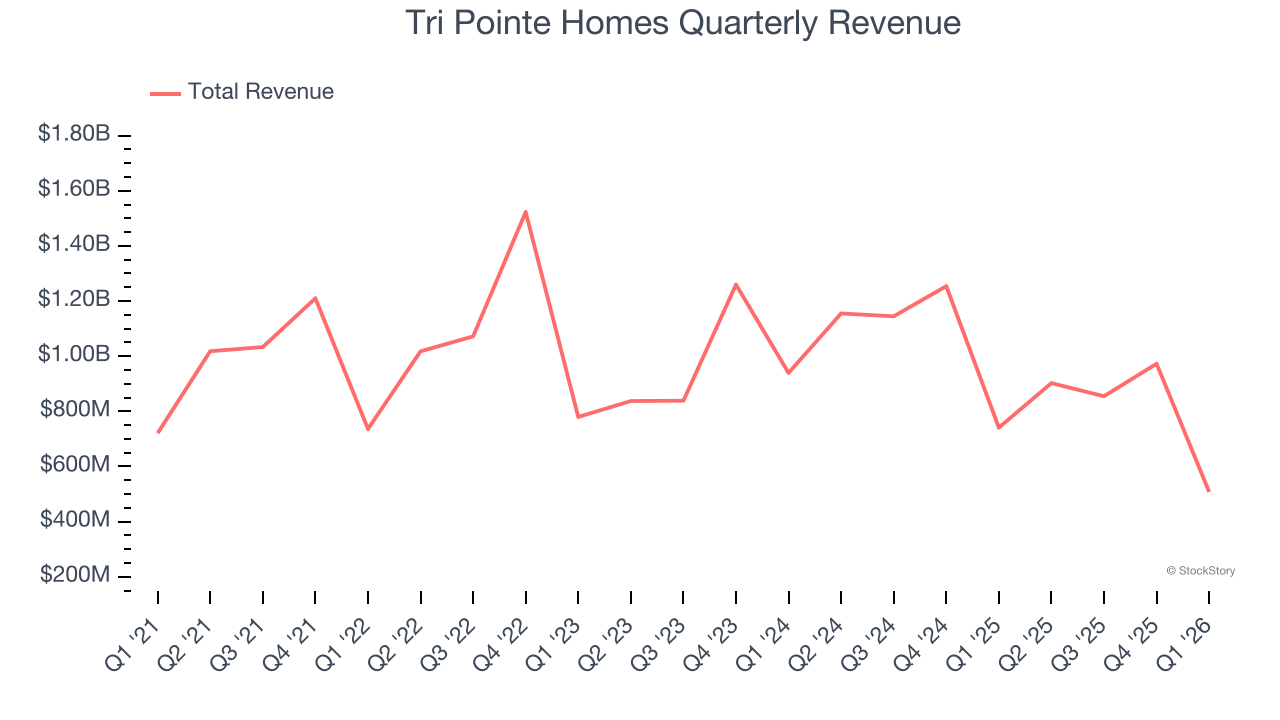
Reviewing a company’s long-term sales performance reveals insights into its quality. Any business can put up a good quarter or two, but the best consistently grow over the long haul. Unfortunately, Tri Pointe Homes struggled to consistently increase demand as its $3.24 billion of sales for the trailing 12 months was close to its revenue five years ago. This wasn’t a great result and suggests it’s a low quality business.
Long-term growth is the most important, but within industrials, a half-decade historical view may miss new industry trends or demand cycles. Tri Pointe Homes’s recent performance shows its demand remained suppressed as its revenue has declined by 8.6% annually over the last two years. 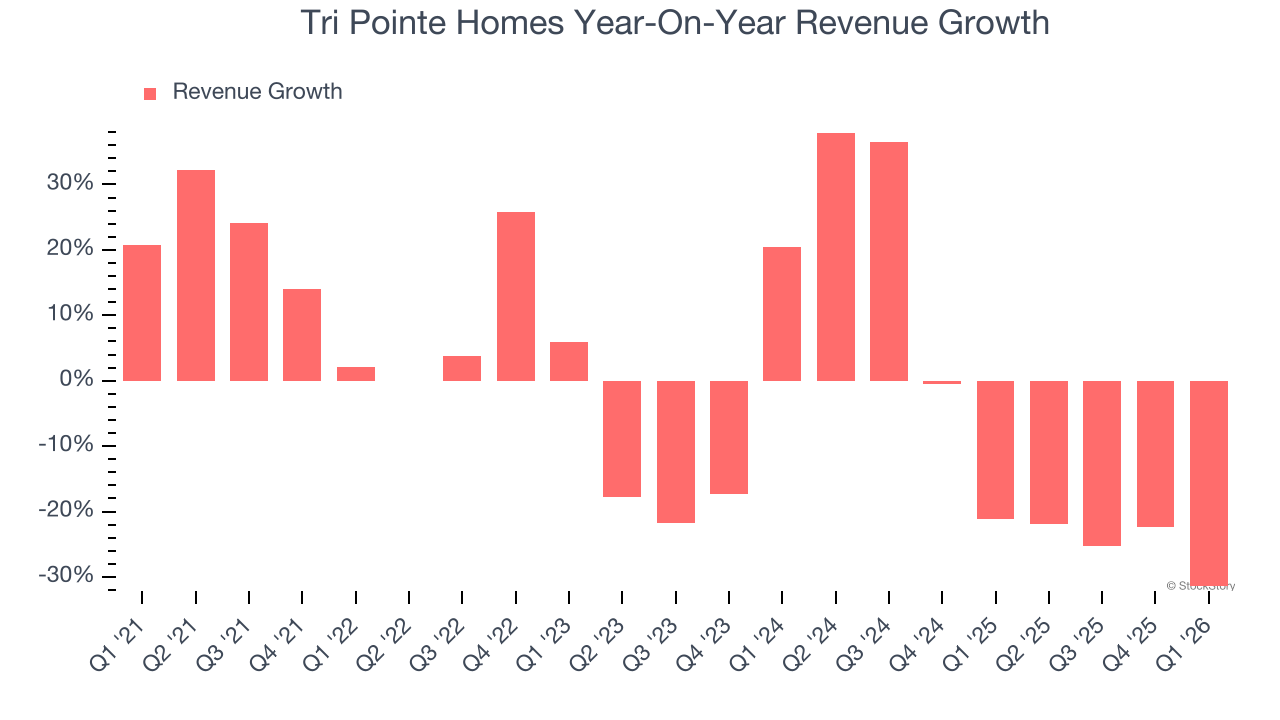
We can dig further into the company’s revenue dynamics by analyzing its backlog, or the value of its outstanding orders that have not yet been executed or delivered. Tri Pointe Homes’s backlog reached $989.9 million in the latest quarter and averaged 36.4% year-on-year declines over the last two years. Because this number is lower than its revenue growth, we can see the company hasn’t secured enough new orders to maintain its growth rate in the future. 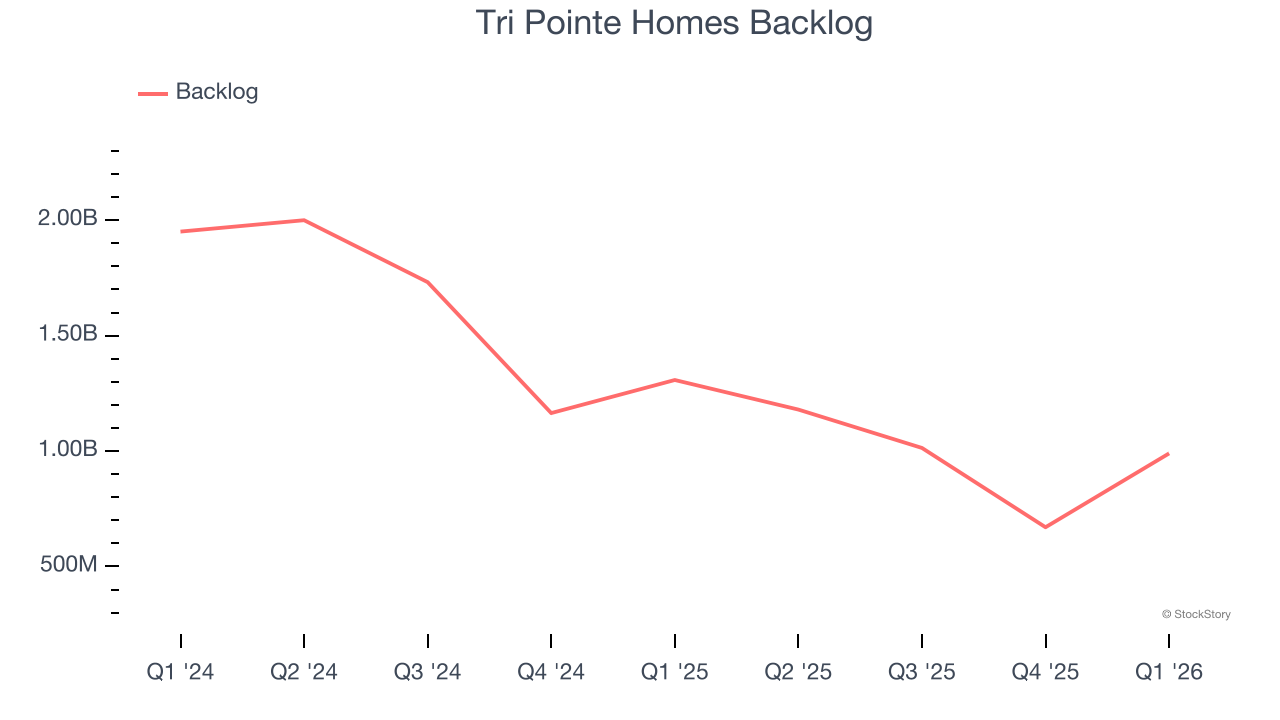
This quarter, Tri Pointe Homes missed Wall Street’s estimates and reported a rather uninspiring 31.5% year-on-year revenue decline, generating $507.9 million of revenue.
Looking ahead, sell-side analysts expect revenue to decline by 5.8% over the next 12 months. While this projection is better than its two-year trend, it’s hard to get excited about a company that is struggling with demand.
ONE MORE THING: The $21 AI Application Stock Wall Street Forgot. While Wall Street obsesses over who’s building AI, one company is already using it to print money. And nobody’s paying attention.
AI chip stocks trade at ridiculous valuations. This company processes a trillion consumer signals monthly using AI and trades at a third of the price. The gap won’t last. The institutions will figure it out. You need to see this first. Read the FREE Report Before They Notice.
Operating Margin
Operating margin is one of the best measures of profitability because it tells us how much money a company takes home after procuring and manufacturing its products, marketing and selling those products, and most importantly, keeping them relevant through research and development.
Tri Pointe Homes has been an efficient company over the last five years. It was one of the more profitable businesses in the industrials sector, boasting an average operating margin of 13.1%. This result was particularly impressive because of its low gross margin, which is mostly a factor of what it sells and takes huge shifts to move meaningfully. Companies have more control over their operating margins, and it’s a show of well-managed operations if they’re high when gross margins are low.
Analyzing the trend in its profitability, Tri Pointe Homes’s operating margin decreased by 8.9 percentage points over the last five years. Even though its historical margin was healthy, shareholders will want to see Tri Pointe Homes become more profitable in the future.
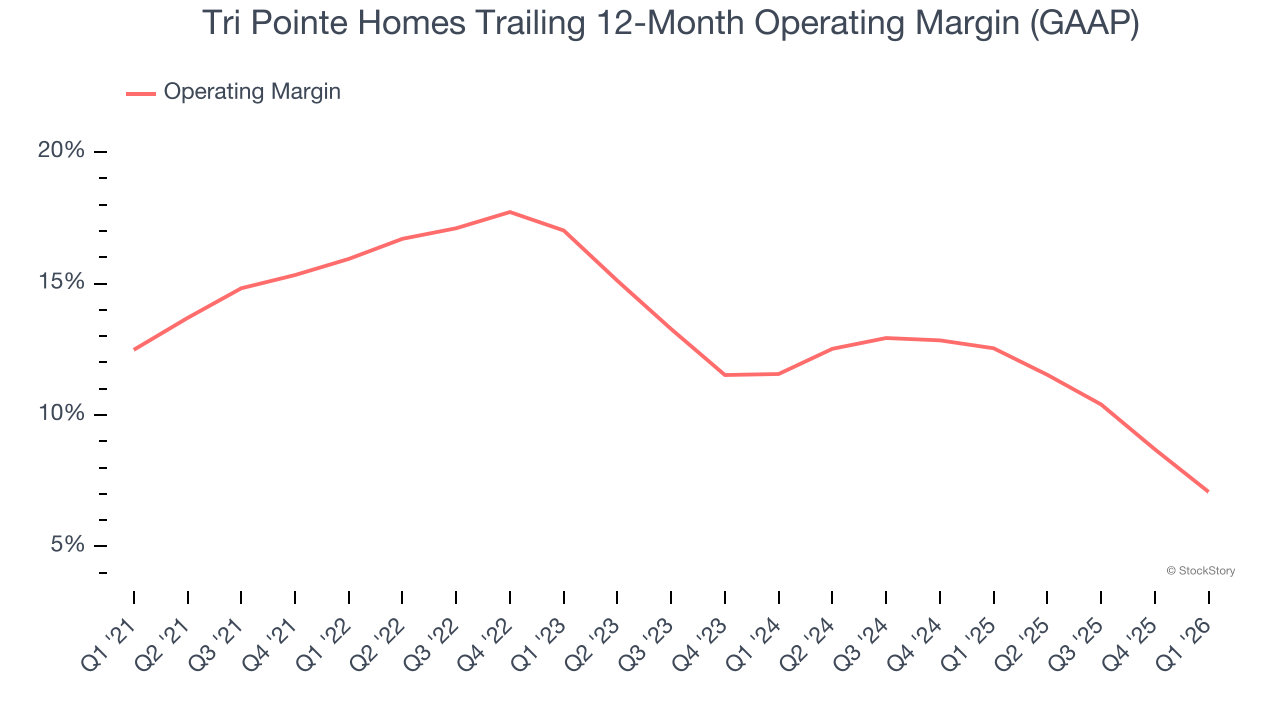
This quarter, Tri Pointe Homes’s breakeven margin was 0.8%, down 9.6 percentage points year on year. Since Tri Pointe Homes’s operating margin decreased more than its gross margin, we can assume it was less efficient because expenses such as marketing, R&D, and administrative overhead increased.
Earnings Per Share
Revenue trends explain a company’s historical growth, but the long-term change in earnings per share (EPS) points to the profitability of that growth – for example, a company could inflate its sales through excessive spending on advertising and promotions.
Sadly for Tri Pointe Homes, its EPS declined by 2.2% annually over the last five years. We tend to steer our readers away from companies with falling revenue and EPS, where diminishing earnings could imply changing secular trends and preferences.If the tide turns unexpectedly, Tri Pointe Homes’s low margin of safety could leave its stock price susceptible to large downswings.
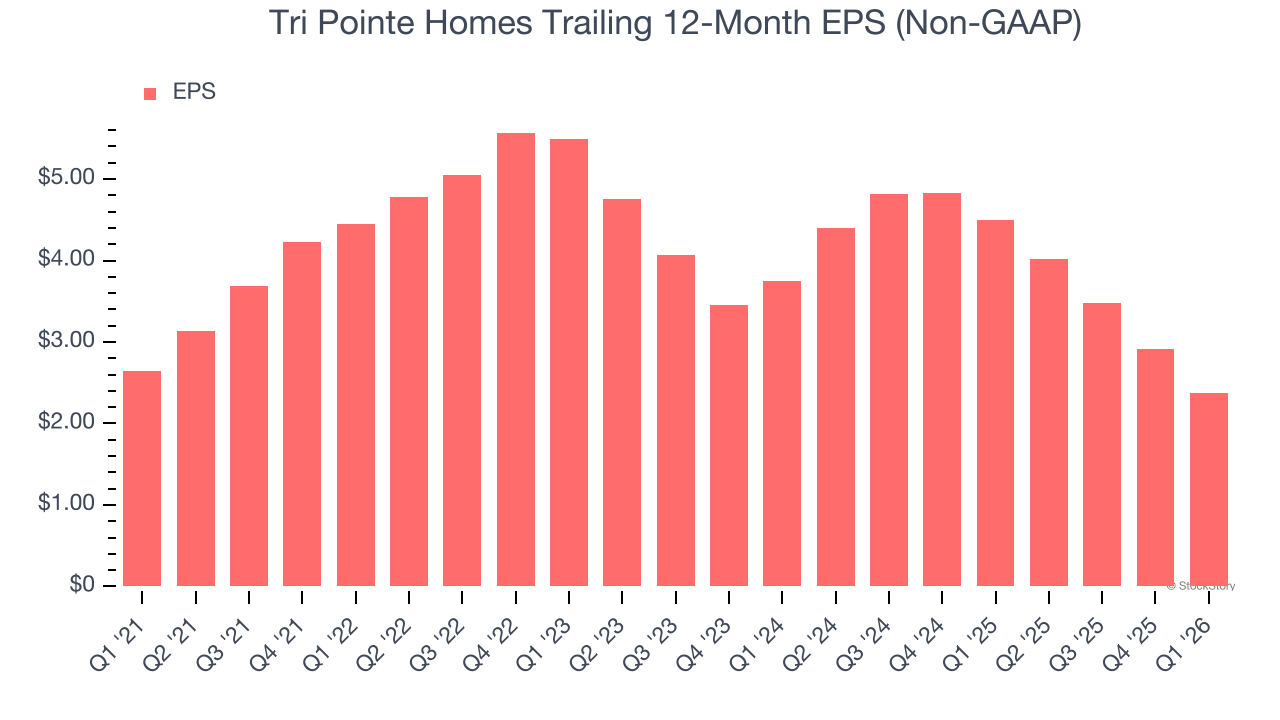
Like with revenue, we analyze EPS over a shorter period to see if we are missing a change in the business.
Tri Pointe Homes’s two-year annual EPS declines of 20.5% were bad and lower than its two-year revenue losses.
We can take a deeper look into Tri Pointe Homes’s earnings to better understand the drivers of its performance. Tri Pointe Homes’s operating margin has declined over the last two years. This was the most relevant factor (aside from the revenue impact) behind its lower earnings; interest expenses and taxes can also affect EPS but don’t tell us as much about a company’s fundamentals.
In Q1, Tri Pointe Homes reported adjusted EPS of $0.16, down from $0.70 in the same quarter last year. This print missed analysts’ estimates. Over the next 12 months, Wall Street expects Tri Pointe Homes’s full-year EPS of $2.37 to shrink by 8.3%.
Key Takeaways from Tri Pointe Homes’s Q1 Results
We struggled to find many positives in these results. Its revenue missed and its adjusted operating income fell short of Wall Street’s estimates. Overall, this quarter could have been better. The stock remained flat at $46.85 immediately after reporting.
So do we think Tri Pointe Homes is an attractive buy at the current price? We think that the latest quarter is only one piece of the longer-term business quality puzzle. Quality, when combined with valuation, can help determine if the stock is a buy. We cover that in our actionable full research report which you can read here (it’s free).