

Manufacturing company Stanley Black & Decker (NYSE: SWK) met Wall Street’s revenue expectations in Q2 CY2026, but sales were flat year on year at $3.96 billion. Its non-GAAP profit of $1.57 per share was 29.9% above analysts’ consensus estimates.
Is now the time to buy Stanley Black & Decker? Find out by accessing our full research report, it’s free.
Stanley Black & Decker (SWK) Q2 CY2026 Highlights:
- Revenue: $3.96 billion vs analyst estimates of $3.96 billion (flat year on year, in line)
- Adjusted EPS: $1.57 vs analyst estimates of $1.21 (29.9% beat)
- Adjusted EBITDA: $445.7 million vs analyst estimates of $414.8 million (11.3% margin, 7.5% beat)
- Management raised its full-year Adjusted EPS guidance to $5.50 at the midpoint, a 3.8% increase
- Operating Margin: 14.1%, up from 4.9% in the same quarter last year
- Free Cash Flow Margin: 17.6%, up from 3.4% in the same quarter last year
- Organic Revenue rose 3% year on year (beat)
- Market Capitalization: $14.64 billion
Chris Nelson, Stanley Black & Decker's President & CEO, commented, "The Stanley Black & Decker team is committed to executing our strategy and delivering profitable, organic growth. Our second quarter sales, gross margin, and cash performance keep us firmly on track to achieve our full-year targets2. We further strengthened the balance sheet and executed on our capital deployment strategy. In addition, the tariff refunds are supporting incremental growth investments.
Company Overview
With an iconic “STANLEY” logo which has remained virtually unchanged for over a century, Stanley Black & Decker (NYSE: SWK) is a manufacturer primarily catering to the tool and outdoor equipment industry.
Revenue Growth
A company’s long-term sales performance can indicate its overall quality. Any business can experience short-term success, but top-performing ones enjoy sustained growth for years. Unfortunately, Stanley Black & Decker struggled to consistently increase demand as its $15.25 billion of sales for the trailing 12 months was close to its revenue five years ago. This was below our standards and is a sign of poor business quality.
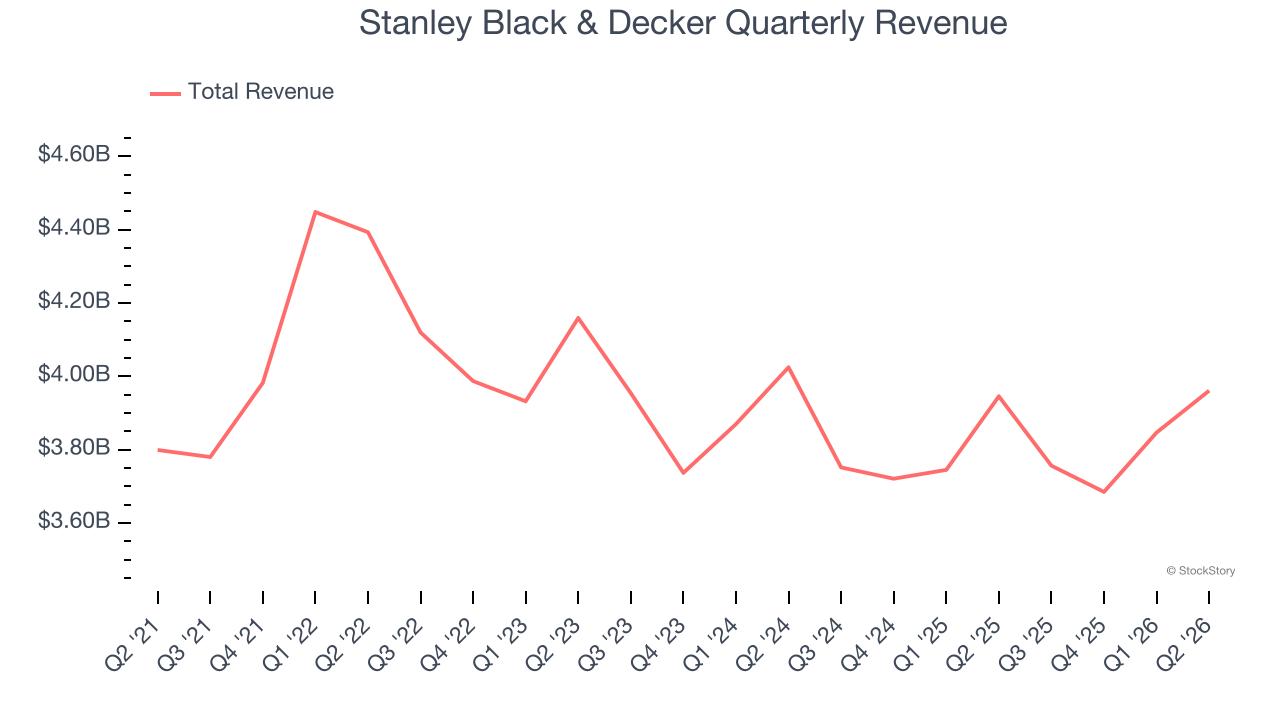
We at StockStory place the most emphasis on long-term growth, but within industrials, a half-decade historical view may miss cycles, industry trends, or a company capitalizing on catalysts such as a new contract win or a successful product line. Stanley Black & Decker’s recent performance shows its demand remained suppressed as its revenue has declined by 1.1% annually over the last two years. 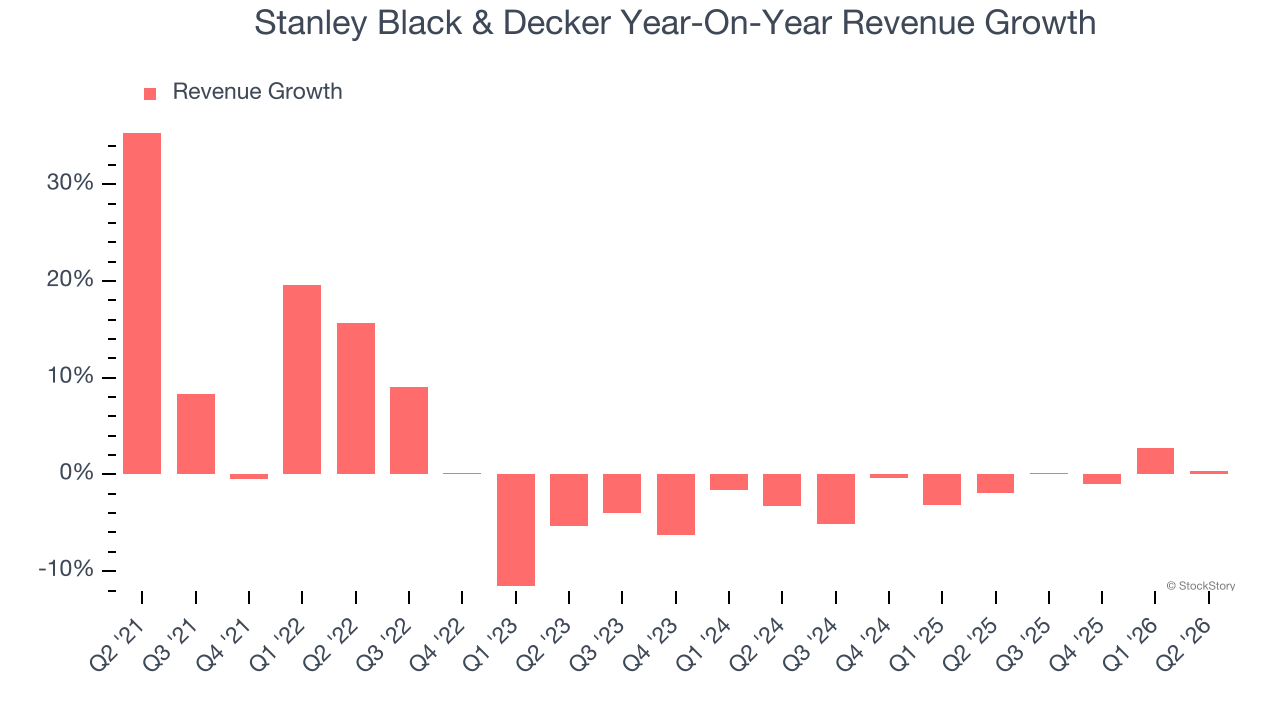
This quarter, Stanley Black & Decker’s $3.96 billion of revenue was flat year on year and in line with Wall Street’s estimates.
Looking ahead, sell-side analysts expect revenue to remain flat over the next 12 months. This projection doesn’t excite us and indicates its newer products and services will not catalyze better top-line performance yet.
WHILE YOU’RE HERE: The Next Palantir? One satellite company captures images of every point on Earth. Every single day. The Pentagon wants it. Hedge funds are using it to beat earnings. You’ve probably never heard of it.
This is what the early days of Palantir looked like before it became a giant. Same playbook. Different technology. If you missed Palantir, you need to see this. Claim The Stock Ticker for Free HERE.
Operating Margin
Operating margin is a key measure of profitability. Think of it as net income - the bottom line - excluding the impact of taxes and interest on debt, which are less connected to business fundamentals.
Stanley Black & Decker was profitable over the last five years but held back by its large cost base. Its average operating margin of 6.9% was weak for an industrials business. This result isn’t too surprising given its low gross margin as a starting point.
On the plus side, Stanley Black & Decker’s operating margin rose by 2.7 percentage points over the last five years.
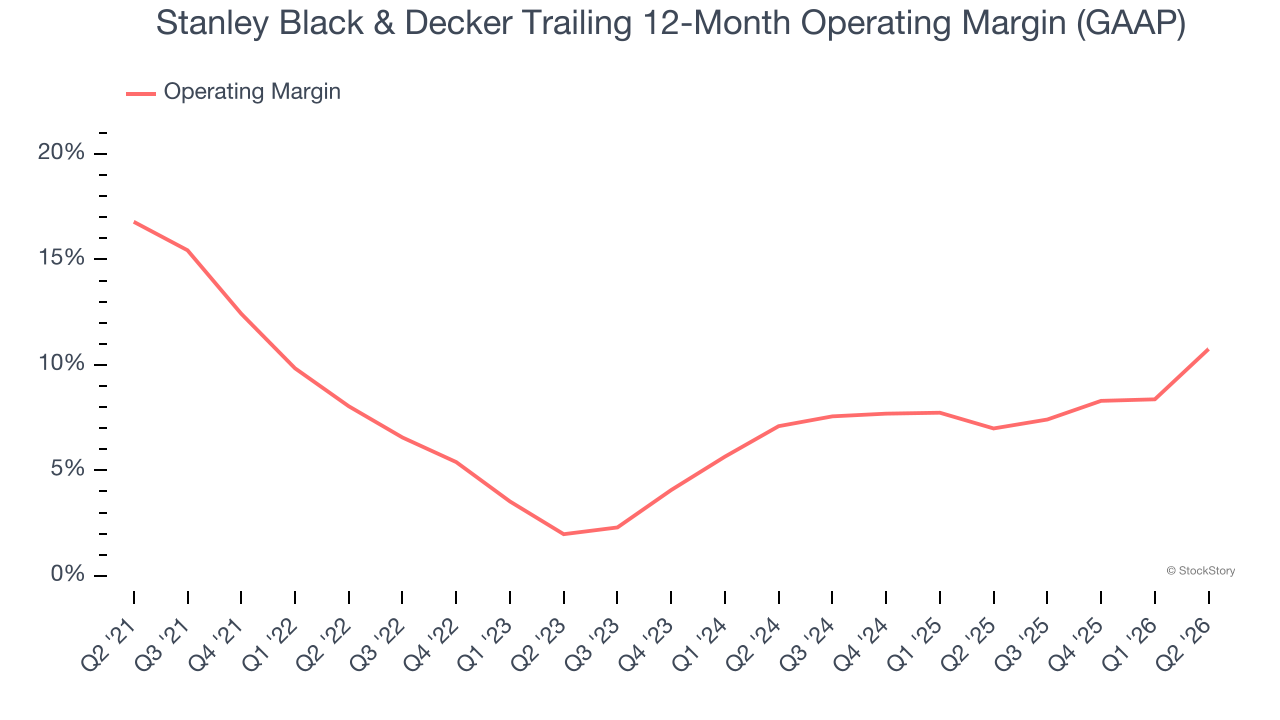
In Q2, Stanley Black & Decker generated an operating margin profit margin of 14.1%, up 9.2 percentage points year on year. The increase was solid, and because its operating margin rose more than its gross margin, we can infer it was more efficient with expenses such as marketing, R&D, and administrative overhead.
Earnings Per Share
We track the long-term change in earnings per share (EPS) for the same reason as long-term revenue growth. Compared to revenue, however, EPS highlights whether a company’s growth is profitable.
Sadly for Stanley Black & Decker, its EPS declined by 15.9% annually over the last five years while its revenue was flat. We can see the difference stemmed from higher interest expenses or taxes as the company actually improved its operating margin and repurchased its shares during this time.
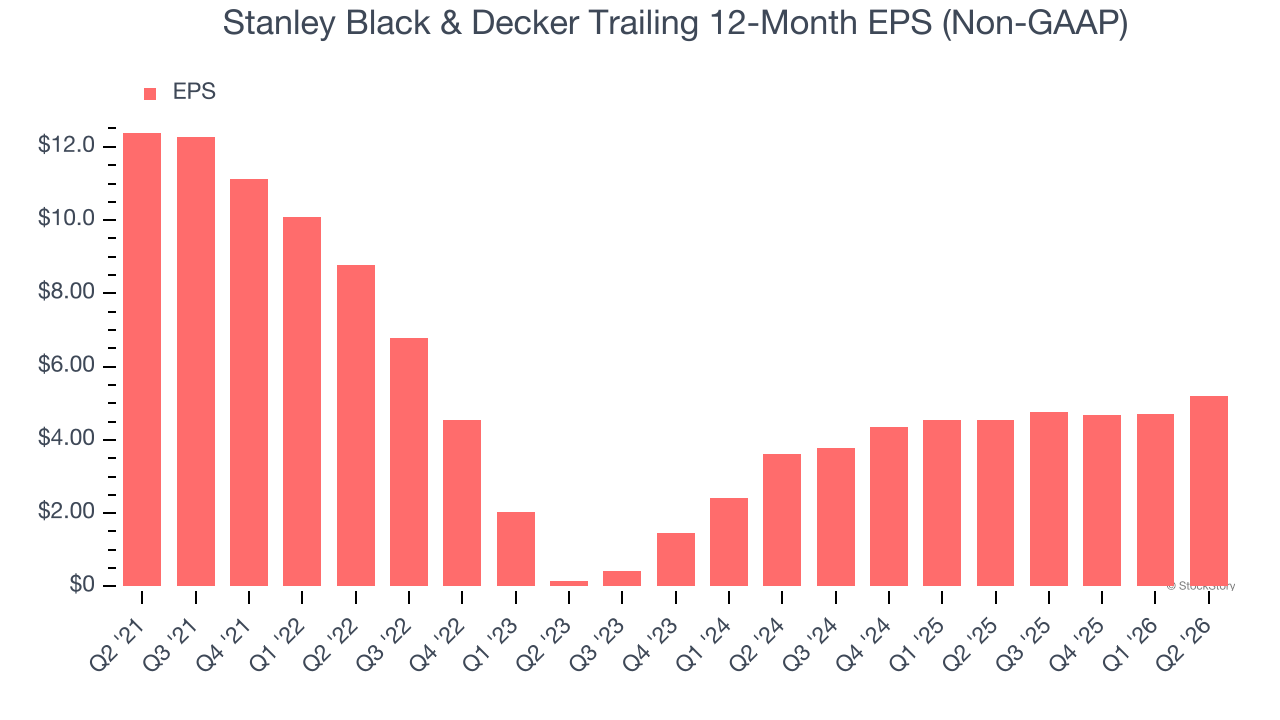
Like with revenue, we analyze EPS over a shorter period to see if we are missing a change in the business.
For Stanley Black & Decker, its two-year annual EPS growth of 20% was higher than its five-year trend. This acceleration made it one of the faster-growing industrials companies in recent history.
In Q2, Stanley Black & Decker reported adjusted EPS of $1.57, up from $1.08 in the same quarter last year. This print easily cleared analysts’ estimates, and shareholders should be content with the results. Over the next 12 months, Wall Street expects Stanley Black & Decker’s full-year EPS to grow 10.6% from $5.21 to $5.76.
Key Takeaways from Stanley Black & Decker’s Q2 Results
It was good to see Stanley Black & Decker beat analysts’ EPS expectations this quarter. We were also glad its EBITDA outperformed Wall Street’s estimates. Zooming out, we think this was a good print with some key areas of upside. The stock traded up 2% to $96.09 immediately after reporting.
Sure, Stanley Black & Decker had a solid quarter, but if we look at the bigger picture, is this stock a buy? We think that the latest quarter is only one piece of the longer-term business quality puzzle. Quality, when combined with valuation, can help determine if the stock is a buy. We cover that in our actionable full research report which you can read here (it’s free).