

Industrial supplier Fastenal (NASDAQ: FAST) reported Q2 CY2026 results topping the market’s revenue expectations, with sales up 14.7% year on year to $2.39 billion. Its GAAP profit of $0.33 per share was in line with analysts’ consensus estimates.
Is now the time to buy Fastenal? Find out by accessing our full research report, it’s free.
Fastenal (FAST) Q2 CY2026 Highlights:
- Revenue: $2.39 billion vs analyst estimates of $2.34 billion (14.7% year-on-year growth, 1.9% beat)
- EPS (GAAP): $0.33 vs analyst estimates of $0.33 (in line)
- Operating Margin: 21%, in line with the same quarter last year
- Free Cash Flow Margin: 8.4%, down from 10.1% in the same quarter last year
- Sales Volumes were flat year on year (10.8% in the same quarter last year)
- Market Capitalization: $53.99 billion
Company Overview
Founded in 1967, Fastenal (NASDAQ: FAST) provides industrial and construction supplies, including fasteners, tools, safety products, and many other product categories to businesses globally.
Revenue Growth
Examining a company’s long-term performance can provide clues about its quality. Any business can put up a good quarter or two, but many enduring ones grow for years. Over the last five years, Fastenal grew its sales at a decent 9% compounded annual growth rate. Its growth was slightly above the average industrials company and shows its offerings resonate with customers.
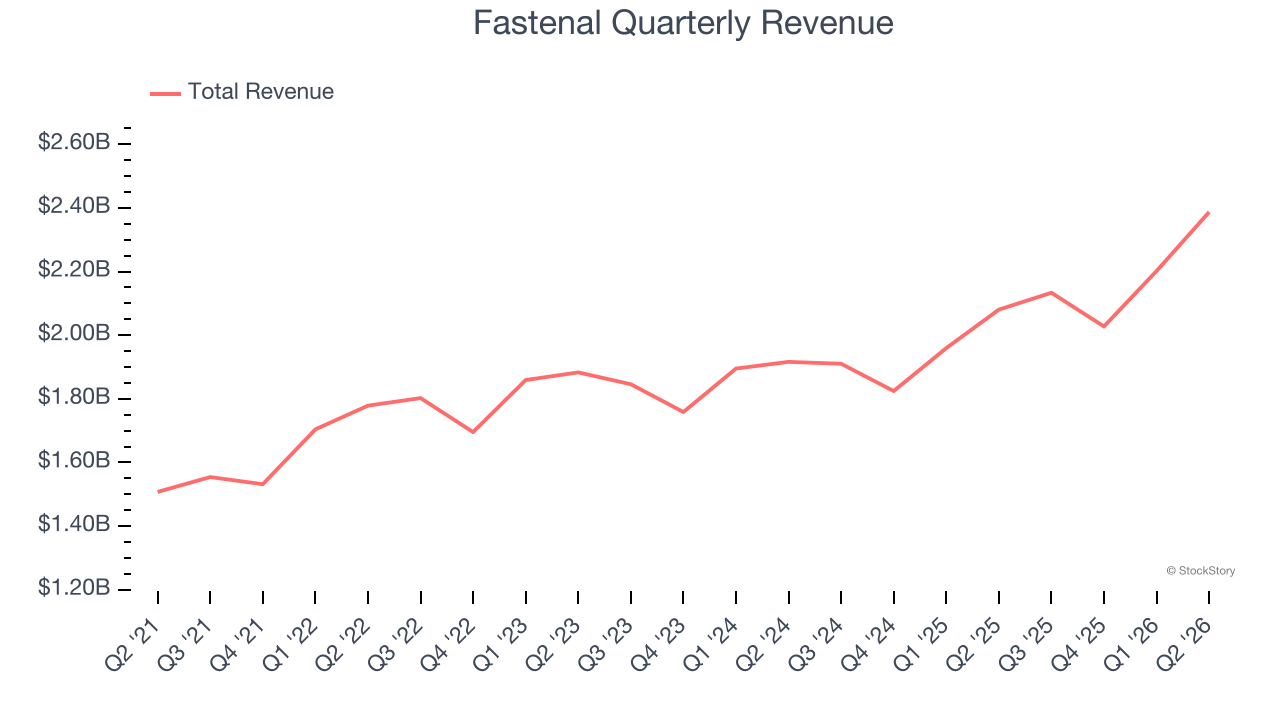
Long-term growth is the most important, but within industrials, a half-decade historical view may miss new industry trends or demand cycles. Fastenal’s annualized revenue growth of 8.6% over the last two years aligns with its five-year trend, suggesting its demand was stable. 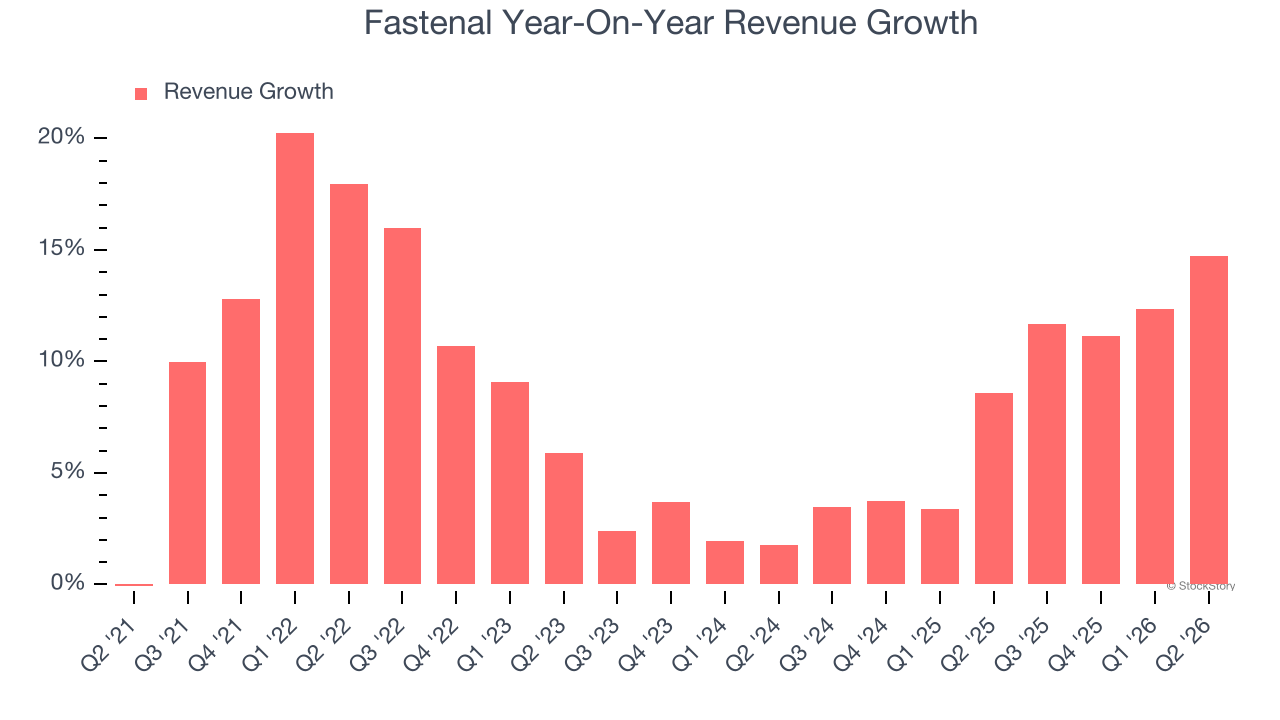
Fastenal also reports its number of units sold, which reached 132,174 in the latest quarter. Over the last two years, Fastenal’s units sold averaged 7.6% year-on-year growth. Because this number is in line with its revenue growth, we can see the company kept its prices fairly consistent. 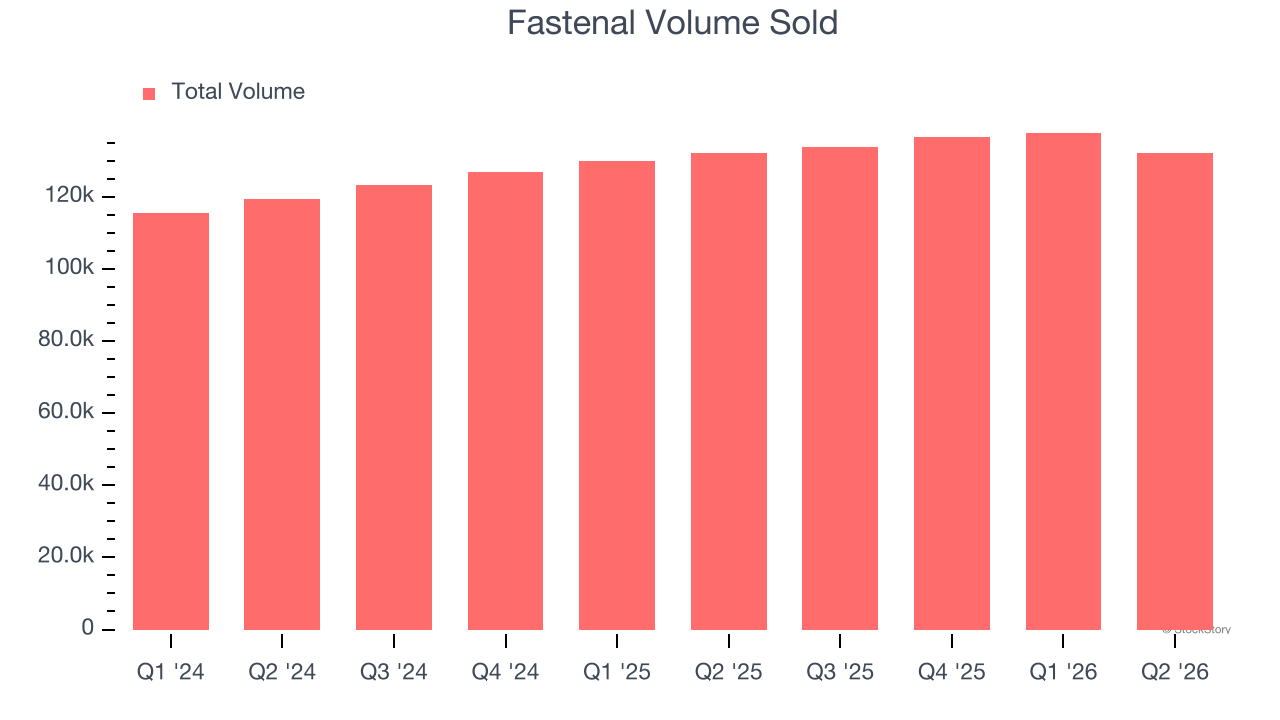
This quarter, Fastenal reported year-on-year revenue growth of 14.7%, and its $2.39 billion of revenue exceeded Wall Street’s estimates by 1.9%.
Looking ahead, sell-side analysts expect revenue to grow 9.8% over the next 12 months, similar to its two-year rate. This projection is admirable and suggests its newer products and services will fuel better top-line performance.
ONE MORE THING: 3 Hidden Platforms Growing 3X Faster than Amazon, Google, and PayPal. Amazon, Google, and Meta all followed the same playbook: Dominate an ignored market. Build an unbeatable moat. Scale until you’re unstoppable.
These three platforms are running that exact playbook right now. The early investors in Amazon made fortunes. The early investors in these could do the same. Get All 3 Stocks Here for FREE.
Operating Margin
Operating margin is one of the best measures of profitability because it tells us how much money a company takes home after procuring and manufacturing its products, marketing and selling those products, and most importantly, keeping them relevant through research and development.
Fastenal’s operating margin has more or less stayed the same over the last 12 months , averaging 20.4% over the last five years. This profitability was elite for an industrials business thanks to its efficient cost structure and economies of scale. This result isn’t surprising as its high gross margin gives it a favorable starting point.
Looking at the trend in its profitability, Fastenal’s operating margin might have fluctuated slightly but has generally stayed the same over the last five years. We like to see margin expansion, but Fastenal’s performance still shows it’s one of the better Maintenance and Repair Distributors companies as most peers saw their margins plummet.
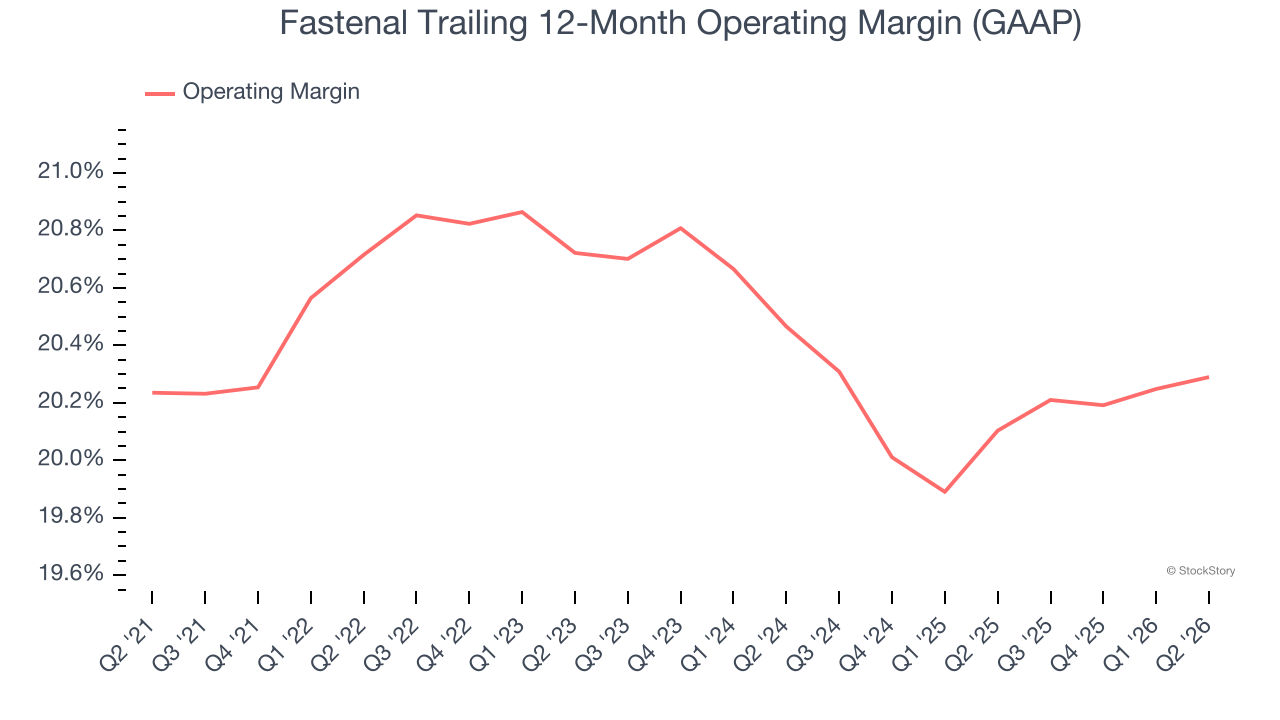
This quarter, Fastenal generated an operating margin profit margin of 21%, in line with the same quarter last year. This indicates the company’s cost structure has recently been stable.
Earnings Per Share
We track the long-term change in earnings per share (EPS) for the same reason as long-term revenue growth. Compared to revenue, however, EPS highlights whether a company’s growth is profitable.
Fastenal’s decent 9.3% annual EPS growth over the last five years aligns with its revenue performance. This tells us it maintained its per-share profitability as it expanded.
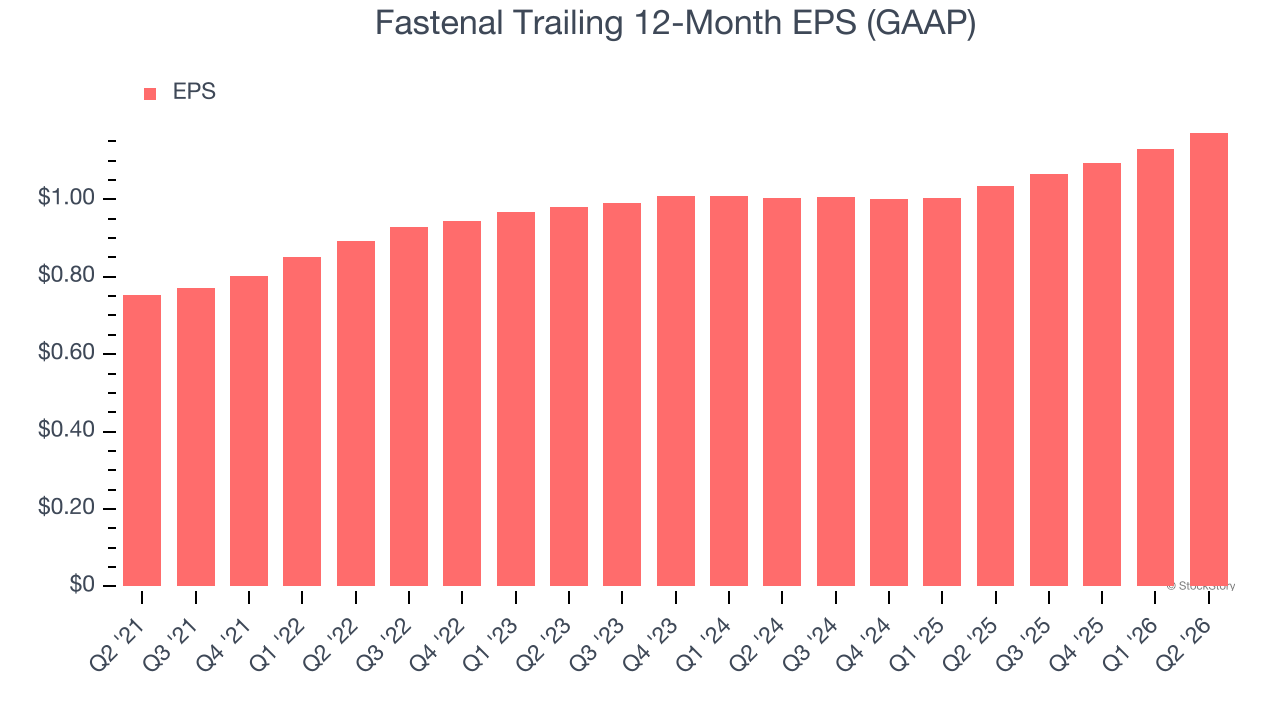
Like with revenue, we analyze EPS over a shorter period to see if we are missing a change in the business.
For Fastenal, its two-year annual EPS growth of 8% was lower than its five-year trend. This wasn’t great, but at least the company was successful in other measures of financial health.
In Q2, Fastenal reported EPS of $0.33, up from $0.29 in the same quarter last year. This print beat analysts’ estimates by 1.2%. Over the next 12 months, Wall Street expects Fastenal’s full-year EPS to grow 11.7% from $1.17 to $1.31.
Key Takeaways from Fastenal’s Q2 Results
We enjoyed seeing Fastenal beat analysts’ revenue expectations this quarter. Overall, this print had some key positives. Investors were likely hoping for more, and shares traded down 1.6% to $46.29 immediately after reporting.
Is Fastenal an attractive investment opportunity right now? When making that decision, it’s important to consider its valuation, business qualities, as well as what has happened in the latest quarter. We cover that in our actionable full research report which you can read here (it’s free).