Medical technology company Becton, Dickinson and Company (NYSE: BDX) announced better-than-expected revenue in Q1 CY2026, with sales up 5.2% year on year to $4.71 billion. Its non-GAAP profit of $2.90 per share was 4.5% above analysts’ consensus estimates.
Is now the time to buy BD? Find out by accessing our full research report, it’s free.
BD (BDX) Q1 CY2026 Highlights:
- Revenue: $4.71 billion vs analyst estimates of $4.68 billion (5.2% year-on-year growth, 0.8% beat)
- Adjusted EPS: $2.90 vs analyst estimates of $2.77 (4.5% beat)
- Adjusted EBITDA: $522 million vs analyst estimates of $1.3 billion (11.1% margin, 60% miss)
- Management slightly raised its full-year Adjusted EPS guidance to $12.62 at the midpoint
- Operating Margin: 2%, down from 8.5% in the same quarter last year
- Free Cash Flow Margin: 11.6%, up from 0.8% in the same quarter last year
- Constant Currency Revenue rose 2.6% year on year (6% in the same quarter last year)
- Market Capitalization: $41.22 billion
"We delivered a solid second quarter, with revenue, margins and EPS all ahead of our expectations," said Tom Polen, chairman, CEO and president of BD.
Company Overview
With a history dating back to 1897 and a presence in virtually every hospital around the globe, Becton Dickinson (NYSE: BDX) develops and manufactures medical supplies, devices, laboratory equipment and diagnostic products used by healthcare institutions and professionals worldwide.
Revenue Growth
A company’s long-term sales performance is one signal of its overall quality. Any business can experience short-term success, but top-performing ones enjoy sustained growth for years. Unfortunately, BD struggled to consistently increase demand as its $18.93 billion of sales for the trailing 12 months was close to its revenue five years ago. This was below our standards and is a sign of lacking business quality.
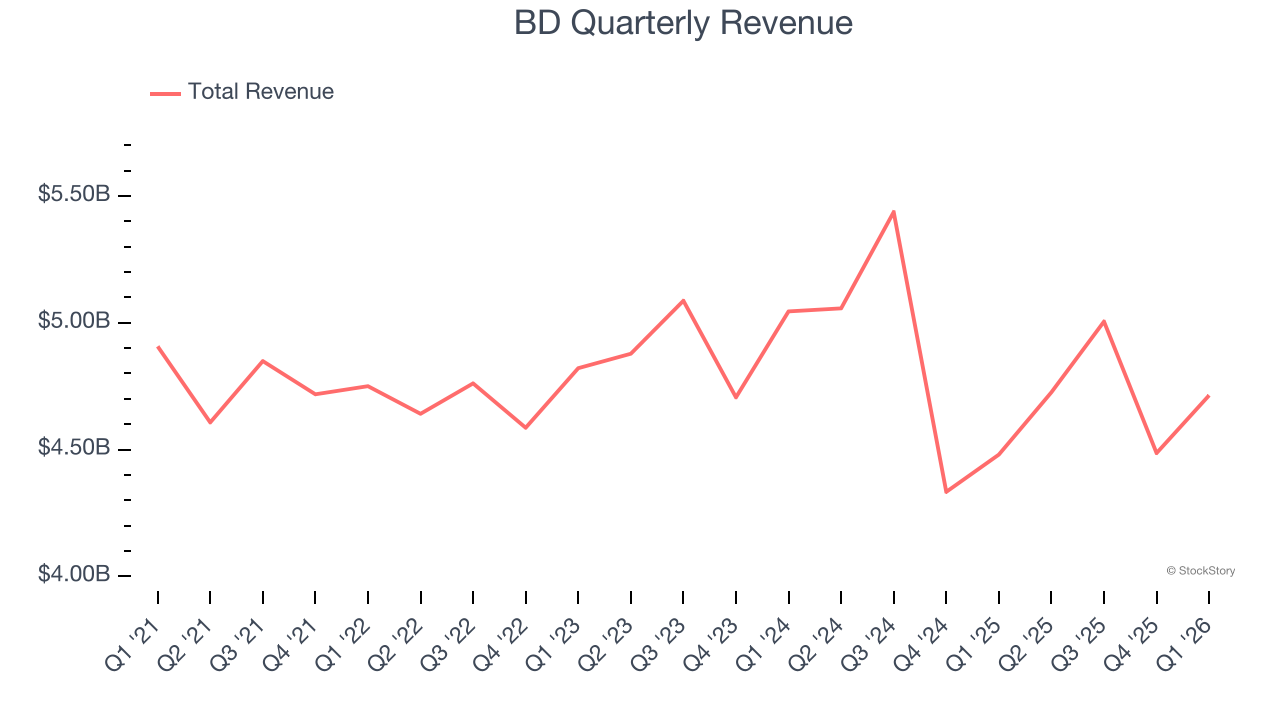
We at StockStory place the most emphasis on long-term growth, but within healthcare, a half-decade historical view may miss recent innovations or disruptive industry trends. BD’s recent performance shows its demand remained suppressed as its revenue has declined by 2% annually over the last two years. 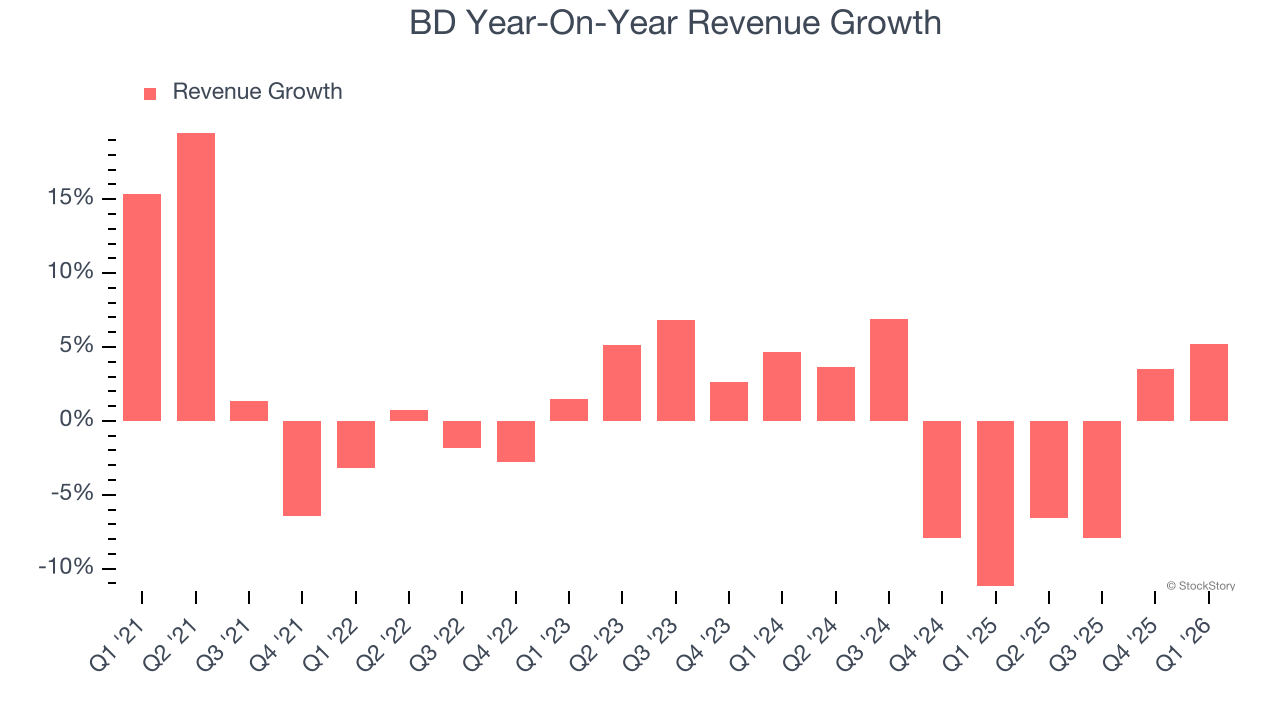
We can dig further into the company’s sales dynamics by analyzing its constant currency revenue, which excludes currency movements that are outside their control and not indicative of demand. Over the last two years, its constant currency sales averaged 5.6% year-on-year growth. Because this number is better than its normal revenue growth, we can see that foreign exchange rates have been a headwind for BD. 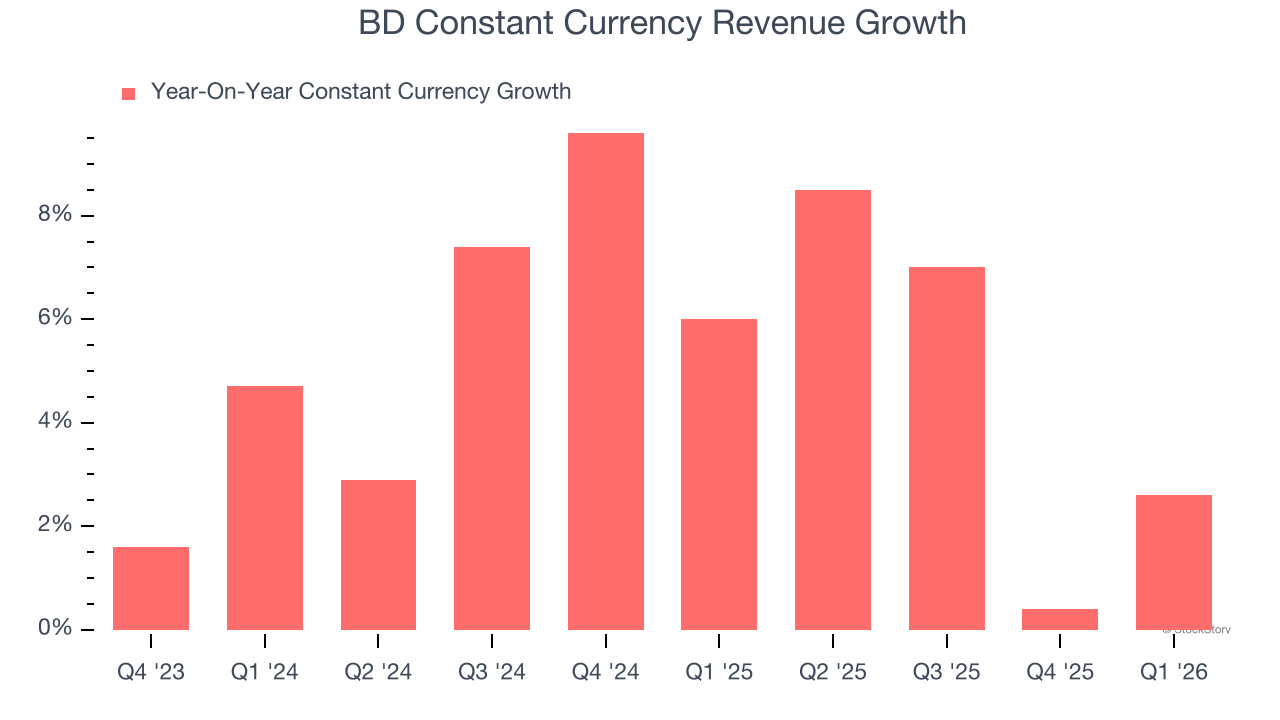
This quarter, BD reported year-on-year revenue growth of 5.2%, and its $4.71 billion of revenue exceeded Wall Street’s estimates by 0.8%.
Looking ahead, sell-side analysts expect revenue to grow 2.5% over the next 12 months. Although this projection implies its newer products and services will catalyze better top-line performance, it is still below average for the sector.
ONE MORE THING: 3 Hidden Platforms Growing 3X Faster than Amazon, Google, and PayPal. Amazon, Google, and Meta all followed the same playbook: Dominate an ignored market. Build an unbeatable moat. Scale until you’re unstoppable.
These three platforms are running that exact playbook right now. The early investors in Amazon made fortunes. The early investors in these could do the same. Get All 3 Stocks Here for FREE.
Adjusted Operating Margin
BD has been an efficient company over the last five years. It was one of the more profitable businesses in the healthcare sector, boasting an average adjusted operating margin of 22.1%.
Analyzing the trend in its profitability, BD’s adjusted operating margin decreased by 1.4 percentage points over the last five years. This performance was caused by more recent speed bumps as the company’s margin fell by 4.3 percentage points on a two-year basis. We’re disappointed in these results because it shows its expenses were rising and it couldn’t pass those costs onto its customers.
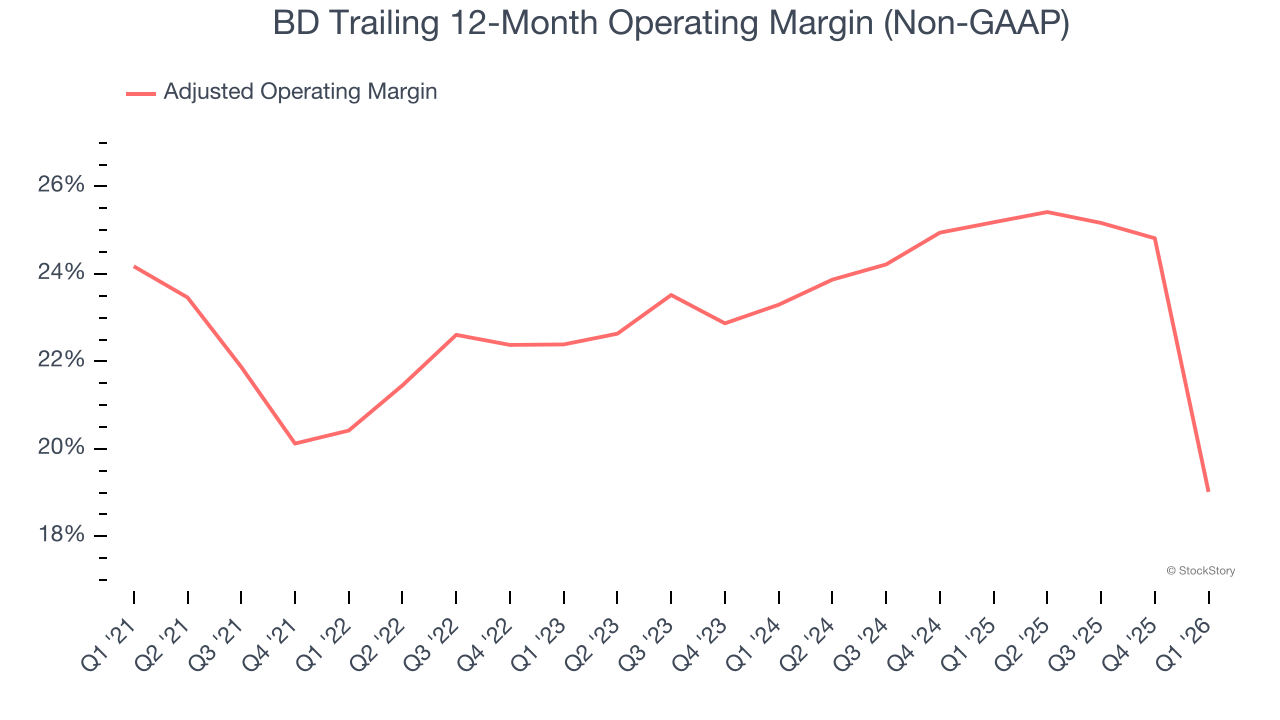
In Q1, BD generated an adjusted operating margin profit margin of 2%, down 23.3 percentage points year on year. This contraction shows it was less efficient because its expenses grew faster than its revenue.
Earnings Per Share
Revenue trends explain a company’s historical growth, but the long-term change in earnings per share (EPS) points to the profitability of that growth – for example, a company could inflate its sales through excessive spending on advertising and promotions.
BD’s unimpressive 1.1% annual EPS growth over the last five years aligns with its revenue performance. This tells us it maintained its per-share profitability as it expanded.
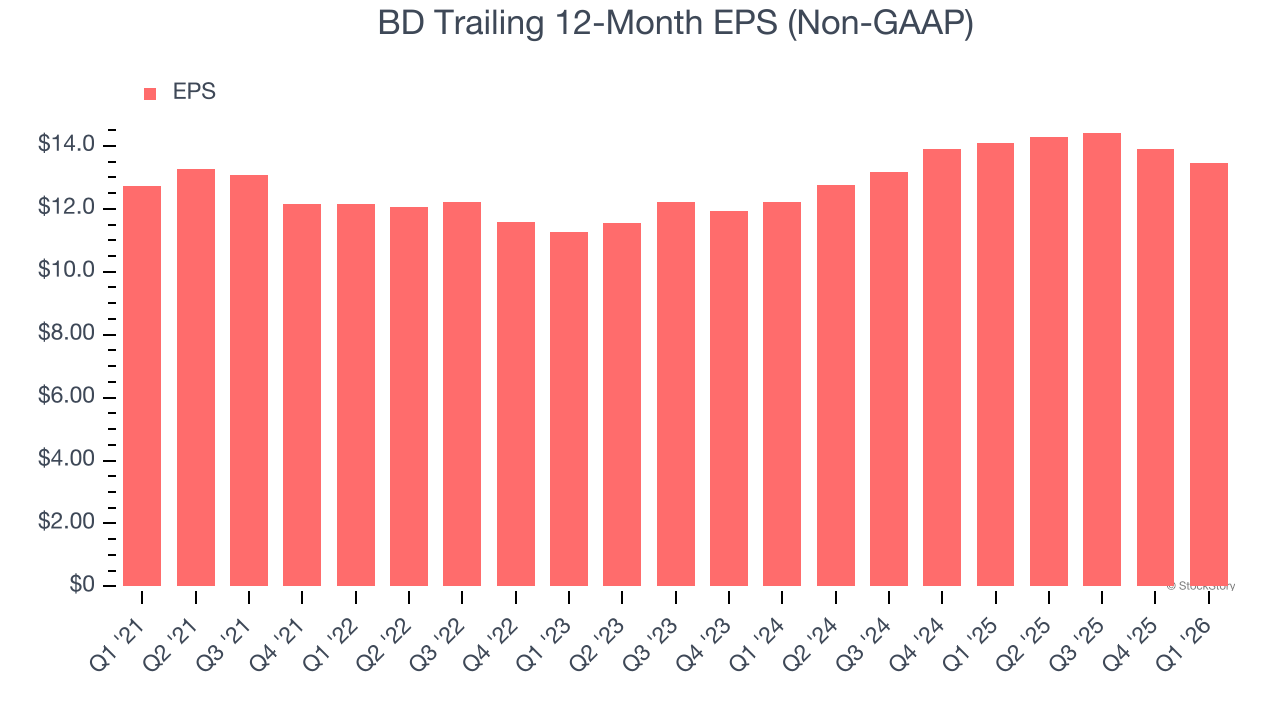
In Q1, BD reported adjusted EPS of $2.90, down from $3.35 in the same quarter last year. Despite falling year on year, this print beat analysts’ estimates by 4.5%. Over the next 12 months, Wall Street expects BD’s full-year EPS of $13.45 to shrink by 2.4%. This is unusual as its revenue and operating margin are anticipated to increase, signaling the fall likely stems from "below-the-line" items such as taxes.
Key Takeaways from BD’s Q1 Results
It was good to see BD narrowly top analysts’ full-year EPS guidance expectations this quarter. We were also glad its EPS outperformed Wall Street’s estimates. Overall, this print had some key positives. The stock traded up 2.5% to $148.32 immediately following the results.
Big picture, is BD a buy here and now? We think that the latest quarter is only one piece of the longer-term business quality puzzle. Quality, when combined with valuation, can help determine if the stock is a buy. We cover that in our actionable full research report which you can read here (it’s free).