
Biorefining company Green Plains (NASDAQ: GPRE) fell short of the market’s revenue expectations in Q3 2026, with revenue falling 2.5% year on year to $496 million. Its GAAP profit of $1.03 per share was 77% above analysts’ consensus estimates.
For more on Green Plains, read our full research report, available free.
Green Plains (GPRE) Q3 2026 highlights:
- Revenue $496 million vs S&P analysts’ consensus estimates of $519.9 million (2.5% year-on-year decline, 4.6% miss)
- EPS (GAAP) $1.03 vs analysts’ consensus estimates of $0.58 (77% beat)
- Adjusted EBITDA $118 million vs analysts’ consensus estimates of $84.8 million (23.8% margin, 39.1% beat)
- Operating margin 18.7%, up from 6.7% in the same quarter last year
- Free cash flow -$11.32 million, down from $35.76 million in the same quarter last year
- Market capitalization $957.5 million
“Green Plains delivered record operating performance across the platform in the third quarter, demonstrating the earnings power we’ve built across the business,” said Chris Osowski, President and Chief Executive Officer of Green Plains. “Following quarter-end, the execution of our 45Z monetization agreement marked another important milestone by providing greater visibility into converting that value into cash. Together, a stronger base business and increased financial flexibility position us to invest in our platform and pursue opportunities where we believe Green Plains can create additional value for shareholders.”
Revenue growth
Cyclical industries such as energy can make mediocre companies look strong for a time, but a long-term view reveals which businesses can withstand and adapt to changing conditions. Green Plains struggled to consistently generate demand over the last five years as its revenue dropped at a 6.2% annual rate. That underwhelming result suggests it is a low-quality business.
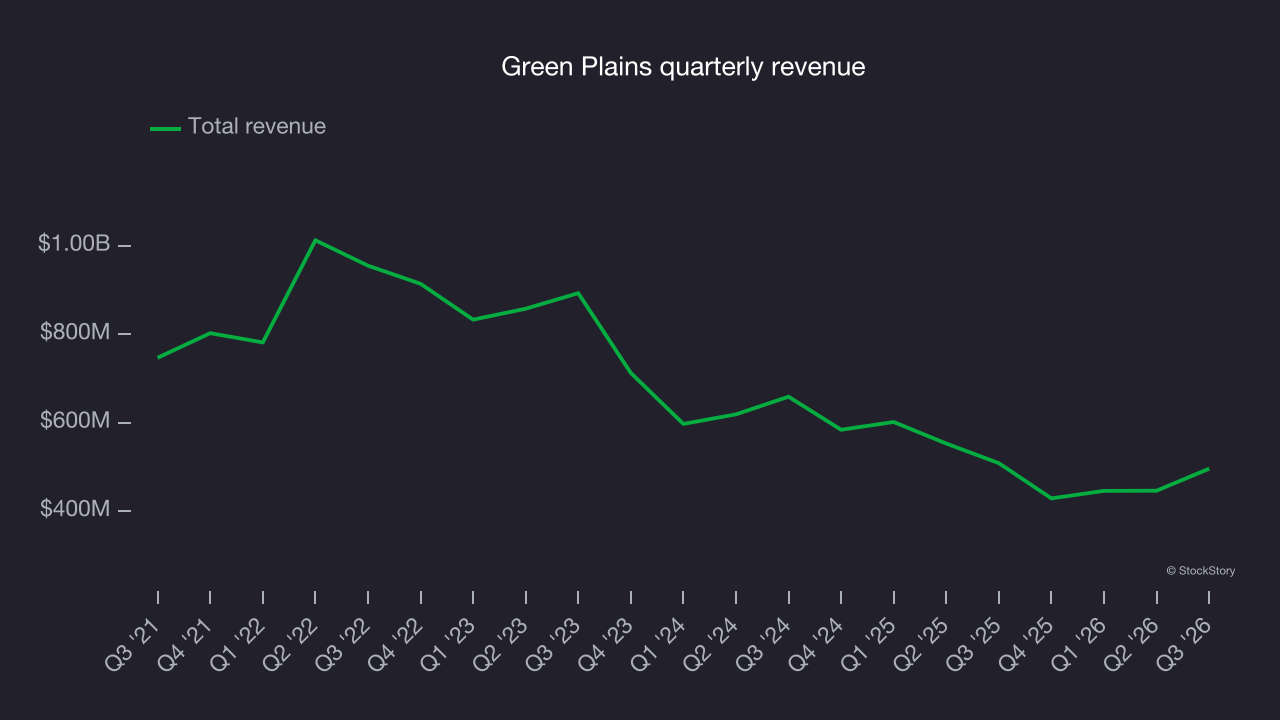
Within energy, a single time frame, even a long one, only sheds light on how well a company navigated the last commodity cycle. To better assess whether a company compounds through cycles, we validate our view with an even longer, ten-year view. Green Plains’s annualized revenue declines of 5.6% over the last ten years align with its five-year trend, suggesting its demand has consistently shrunk.
This quarter, Green Plains missed Wall Street’s consensus estimates and reported an uninspiring 2.5% year-on-year revenue decline, generating $496 million of revenue.
Adjusted EBITDA margin
Green Plains was profitable over the last five years but held back by its large cost base. Its average EBITDA margin of 3.4% was among the worst in the energy upstream and integrated energy sector.
On the positive side, Green Plains’s EBITDA margin rose by 17.6 percentage points over the last year.
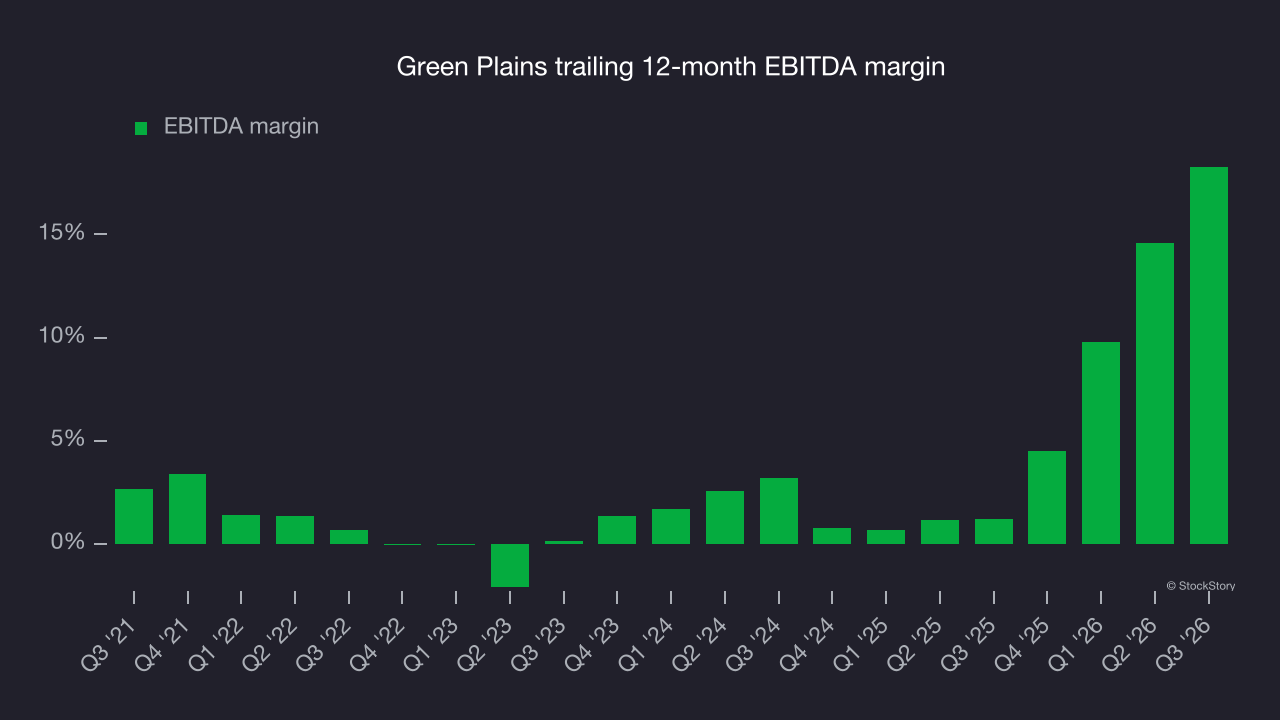
This quarter, Green Plains generated an EBITDA margin of 23.8%, up 13.4 percentage points year on year. The increase was notable given the revenue decline, showing improved efficiency as it reduced expenses. Adjusted EBITDA beat Wall Street’s consensus estimates by 39.1%.
Free cash flow
Adjusted EBITDA shows how profitable a company’s existing “rock” is before financing and reinvestment, while free cash flow, or FCF, shows how much value remains after paying to replace those wells. Because production declines over time, strong EBITDA can coexist with weak FCF if drilling is expensive or declines are steep. FCF therefore captures both operating efficiency and the cost of sustaining production.
Green Plains’s demanding reinvestments have consumed substantial resources over the last five years, contributing to an average free cash flow margin of negative 1.9%. This means it burned $1.89 in cash for every $100 in revenue.
While the level of free cash flow margins is important, their consistency matters just as much.
Green Plains’s ratio of quarterly free cash flow volatility to West Texas Intermediate, or WTI, crude price volatility over the past five years was 42.4 (lower is better), indicating that its cash generation is far more sensitive to commodity-price swings than most peers. This elevated volatility limits its access to capital in downturns and makes it unlikely to act as a consolidator when weaker competitors come under pressure.
This stability analysis compares free cash flow with commodity prices. Why not compare revenue or EBITDA with WTI crude prices in Green Plains’s case? Because what ultimately matters is not how much revenue or profit a company earns when prices are high but how much cash it can generate when prices are low. Free cash flow is the superior metric because it includes everything from hedging effectiveness to growth and maintenance capex to management behavior during good times and bad.
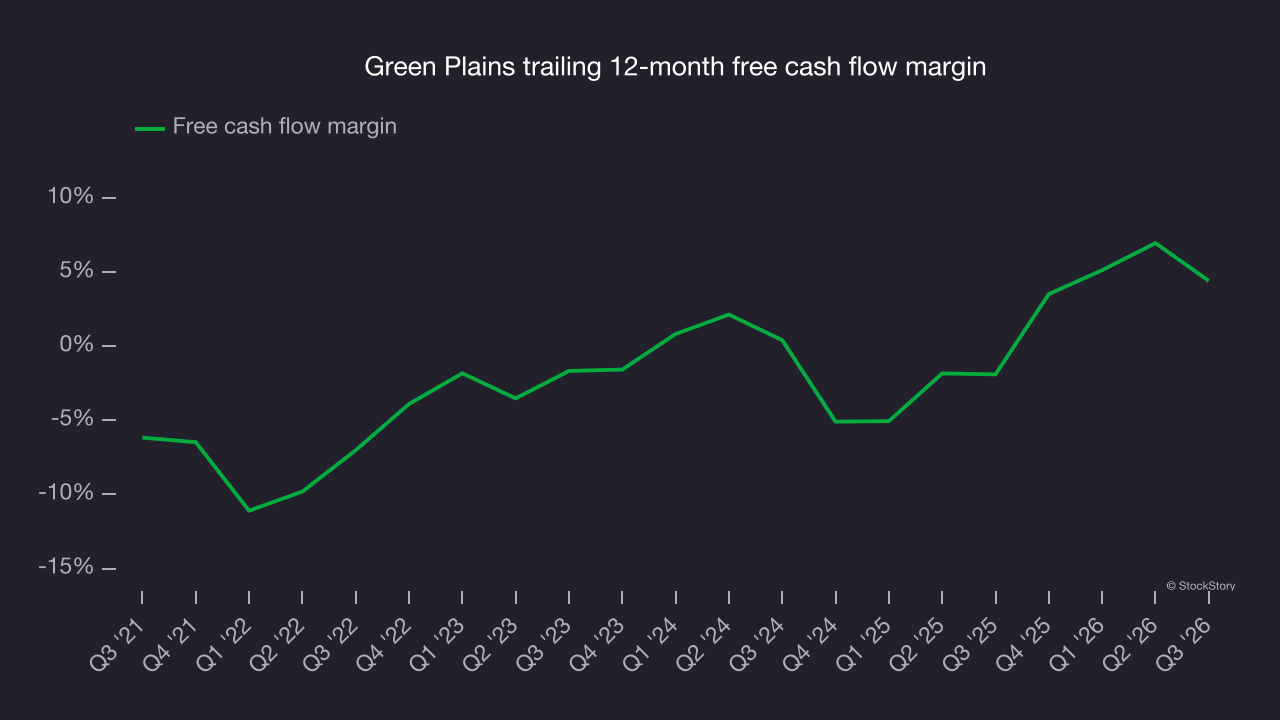
Green Plains used $11.32 million of cash in Q3, equivalent to a negative 2.3% margin. The company’s cash flow turned negative after being positive in the same quarter last year, warranting closer attention. Short-term fluctuations typically aren’t a major concern because investment needs can be seasonal, but whether the trend continues in future quarters bears watching.
Key takeaways from Green Plains’s Q3 results
Green Plains delivered some important positives in Q3: EPS beat analysts’ consensus estimates, and EBITDA topped Wall Street’s consensus by a wide margin. Revenue, however, missed expectations, leaving the results mixed. Shares rose 3.6% to $14.20 immediately after the report.
Green Plains may have had a good quarter, but that alone doesn’t make it a buy. An investment decision should take into account the bigger picture of valuation, business quality and the latest earnings. For more on Green Plains, read our full research report here (it’s free).