
Internet service provider Cogent Communications (NASDAQ: CCOI) missed Wall Street’s revenue expectations in Q3 2026, with revenue falling 4.4% year on year to $231.2 million. Its GAAP loss of $0.62 per share was 18.7% above analysts’ consensus estimates.
For more on Cogent, read our free full research report.
Cogent (CCOI) Q3 2026 highlights:
- Revenue $231.2 million vs S&P analysts’ consensus estimates of $234.9 million (4.4% year-on-year decline, 1.6% miss)
- EPS (GAAP) -$0.62 vs analysts’ consensus estimates of -$0.76 (18.7% beat)
- Adjusted EBITDA $73.9 million vs analysts’ consensus estimates of $75.3 million (32% margin, 1.9% miss)
- Operating margin -3%, up from -7.5% in the same quarter last year
- Free cash flow -$32.52 million compared to -$33.15 million in the same quarter last year
- Total connections 114.7 million, down 3.6 million year on year
- Market capitalization $325.4 million
Revenue growth
A company’s long-term revenue performance can indicate its overall quality. Any business can have short-term success, but a top-tier one grows for years.
With $946.5 million in revenue over the past 12 months, Cogent is a small player in the business services space, which sometimes brings disadvantages compared to larger competitors benefiting from economies of scale and numerous distribution channels. On the positive side, it can grow faster because it has more room to expand.
Cogent’s 10% annualized revenue growth over the last five years was impressive. This shows it had high demand.
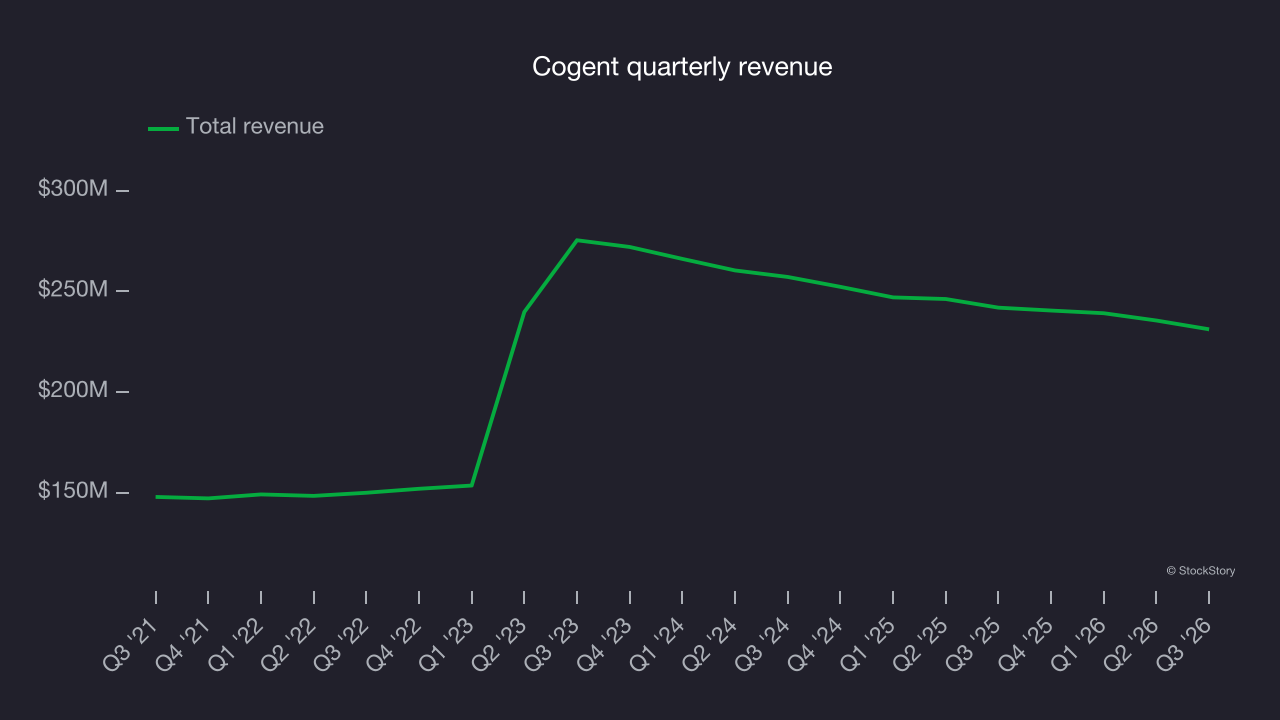
Long-term growth is the most important, but within business services, a half-decade historical view may miss new innovations or demand cycles. Cogent’s recent performance marks a sharp pivot from its five-year trend as its revenue has shown annualized declines of 5.3% over the last two years. 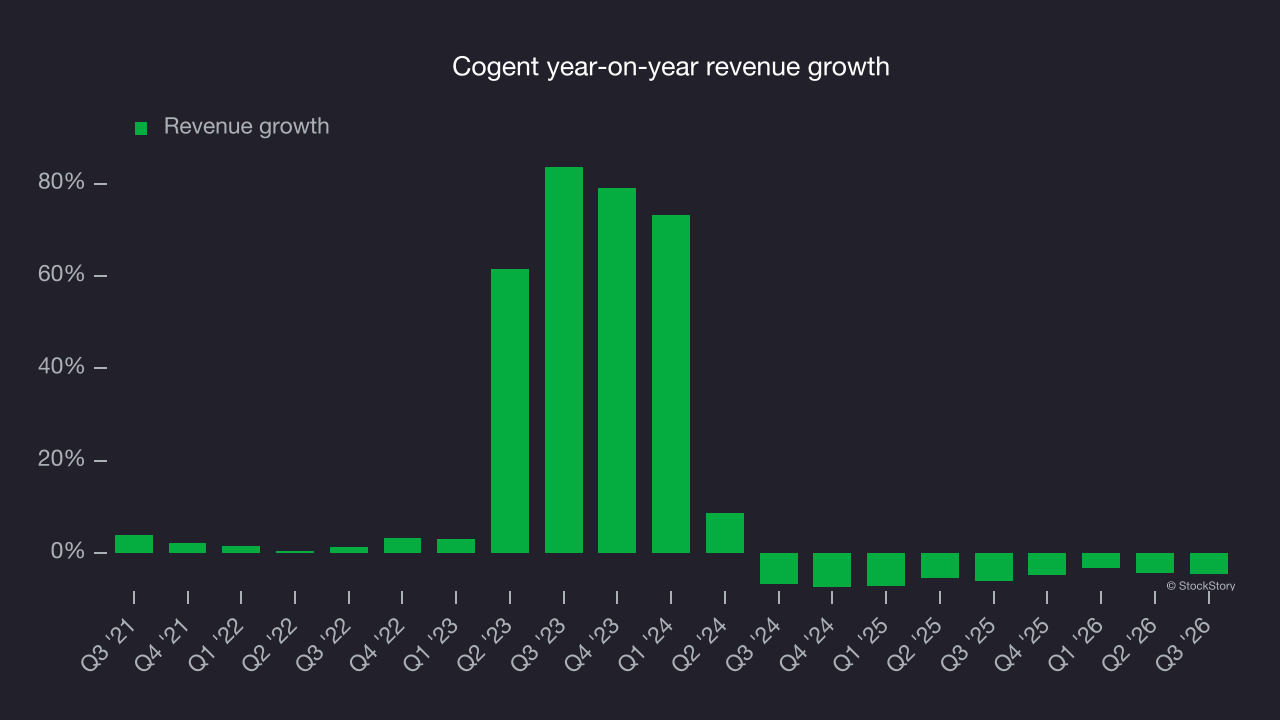
This quarter, Cogent missed Wall Street’s consensus estimates and reported an uninspiring 4.4% year-on-year revenue decline, generating $231.2 million of revenue.
Looking ahead, sell-side analysts expect revenue to remain flat over the next 12 months, according to S&P. Although this projection suggests its newer products and services will lead to better revenue performance, it is still below the sector average.
Adjusted operating margin
Although Cogent broke even this quarter from an operational perspective, it’s generally struggled over a longer time period. Its expensive cost structure has contributed to an average adjusted operating margin of negative 3.9% over the last five years. Unprofitable business services companies warrant closer scrutiny because they can be vulnerable in a downturn. That raises doubts about the business’s ability to endure a full cycle.
Analyzing the trend in its profitability, Cogent’s adjusted operating margin decreased by 10.6 percentage points over the last five years. This raises questions about the company’s expense base because its revenue growth should have given it leverage on its fixed costs, resulting in better economies of scale and profitability. Cogent’s performance was poor, showing that costs were rising and it couldn’t pass them on to its customers.
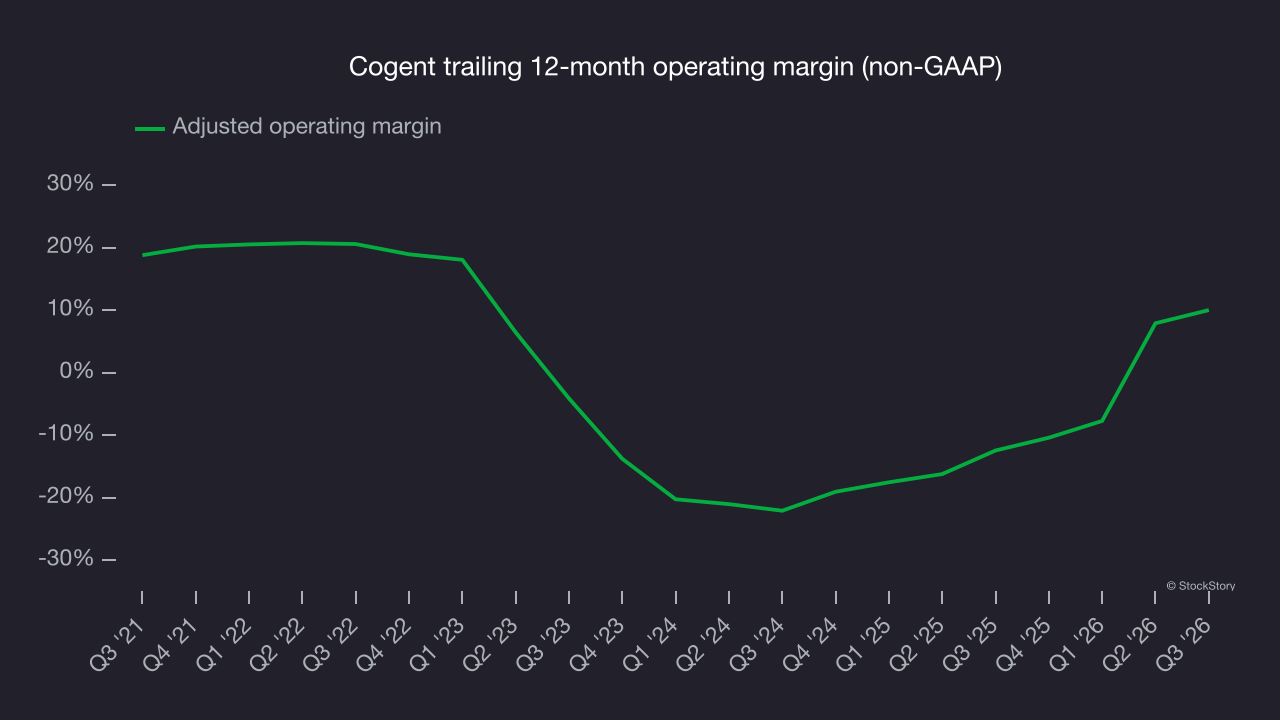
This quarter, Cogent’s breakeven margin was 0.4%, up 7.9 percentage points year on year. This increase was a positive development, especially since its revenue fell, showing it was more efficient because it scaled down its expenses.
Earnings per share
We track the long-term change in earnings per share, or EPS, for the same reason as long-term revenue growth. Compared to revenue, however, EPS highlights whether a company’s growth is profitable.
Cogent’s EPS declined by 28.2% annually over the last five years while its revenue grew by 10%. This tells us the company became less profitable on a per-share basis as it expanded.
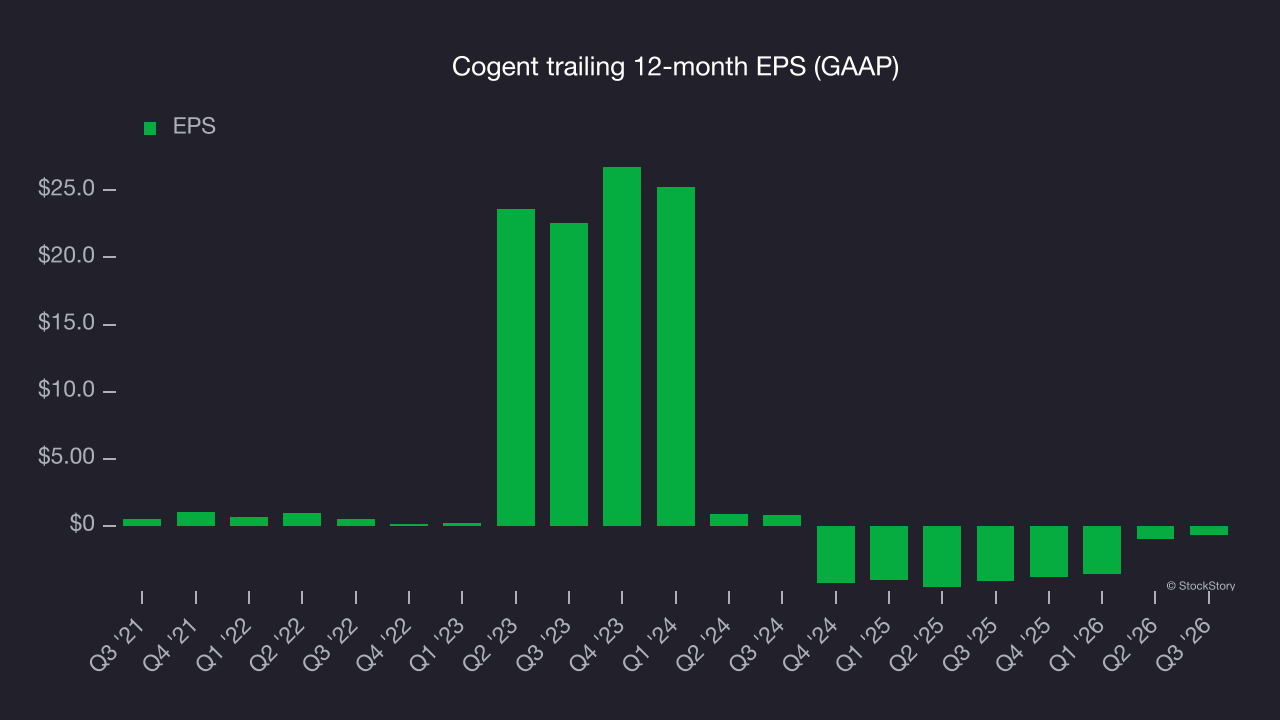
We can take a deeper look into Cogent’s earnings to better understand the drivers of its performance. As we mentioned earlier, Cogent’s adjusted operating margin expanded this quarter but declined by 10.6 percentage points over the last five years. Its share count also grew by 2.4%, meaning the company not only became less efficient with its operating expenses but also diluted its shareholders. 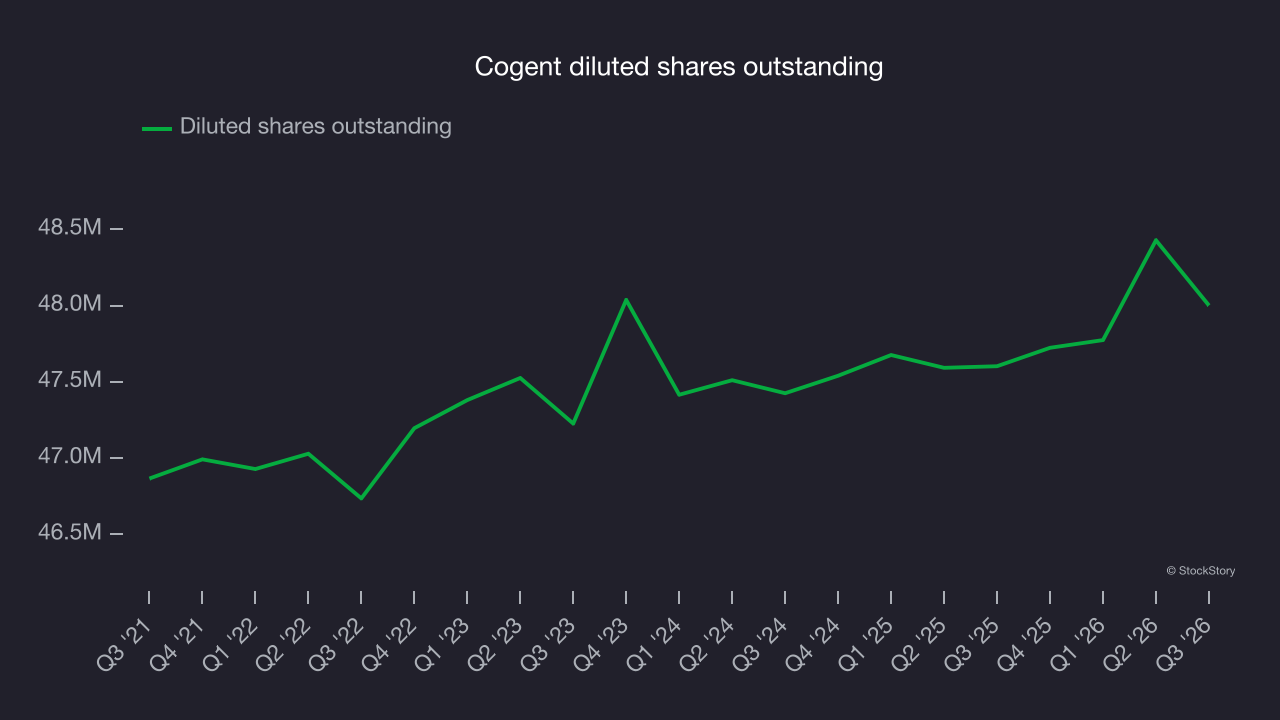
Like with revenue, we analyze EPS over a more recent period because it can provide insight into an emerging theme or development for the business.
For Cogent, its two-year annual EPS declines of 70.9% show it’s continued to underperform. The results were poor across both periods.
In Q3, Cogent reported EPS of negative $0.62, up from negative $0.87 in the same quarter last year. This result beat analysts’ consensus estimates by a wide margin, a positive outcome for shareholders. Over the next 12 months, Wall Street expects Cogent to perform poorly. Analysts forecast its full-year EPS will decline from negative $0.72 to negative $3.08, according to S&P.
Key takeaways from Cogent’s Q3 results
Cogent’s Q3 results had some key positives, including EPS that beat analysts’ consensus estimates, but revenue fell short. The market seemed to be hoping for more: Shares fell 2.1% to $6.65 immediately after the results.
For investors evaluating Cogent, the latest quarter matters, but not nearly as much as longer-term fundamentals and valuation. For more on those factors, read the full research report here (it’s free).