

Construction equipment company Astec (NASDAQ: ASTE) fell short of the market’s revenue expectations in Q3 2026, with revenue flat year on year at $352.4 million. Its non-GAAP loss of $0.01 per share was significantly below analysts’ consensus estimates.
For more on Astec, read our free full research report.
Astec (ASTE) Q3 2026 highlights:
- Revenue $352.4 million vs S&P analysts’ consensus estimates of $375.5 million (flat year on year, 6.1% miss)
- Adjusted EPS -$0.01 vs S&P analysts’ consensus estimates of $0.47 (significant miss)
- Adjusted EBITDA $18.9 million vs analysts’ consensus estimates of $31.37 million (5.4% margin, 39.7% miss)
- Operating margin -0.9%, down from 4.1% in the same quarter last year
- Free cash flow $10.7 million, up from -$12.3 million in the same quarter last year
- Backlog $670.5 million at quarter end, up 49.2% year on year
- Market capitalization $904.9 million
"Third quarter financial results were less than expected as ongoing macroeconomic uncertainty caused a pause in orders earlier in the year by select asphalt plant customers. This, combined with inflationary headwinds, impacted our sales, mix, absorption and margins during the third quarter. Despite this temporary pause and the delayed renewal of the U.S. federal highway bill, underlying demand rebounded in the third quarter as evidenced by our 49.2% growth in backlog," said Jaco van der Merwe, Chief Executive Officer.
Revenue growth
A company’s long-term revenue performance is one signal of its overall quality. Any business can experience short-term success, but top-performing ones sustain growth for years. Astec’s revenue grew at a decent 7.8% compounded annual growth rate over the last five years. Its growth was slightly above the average industrials company and shows its offerings resonate with customers.
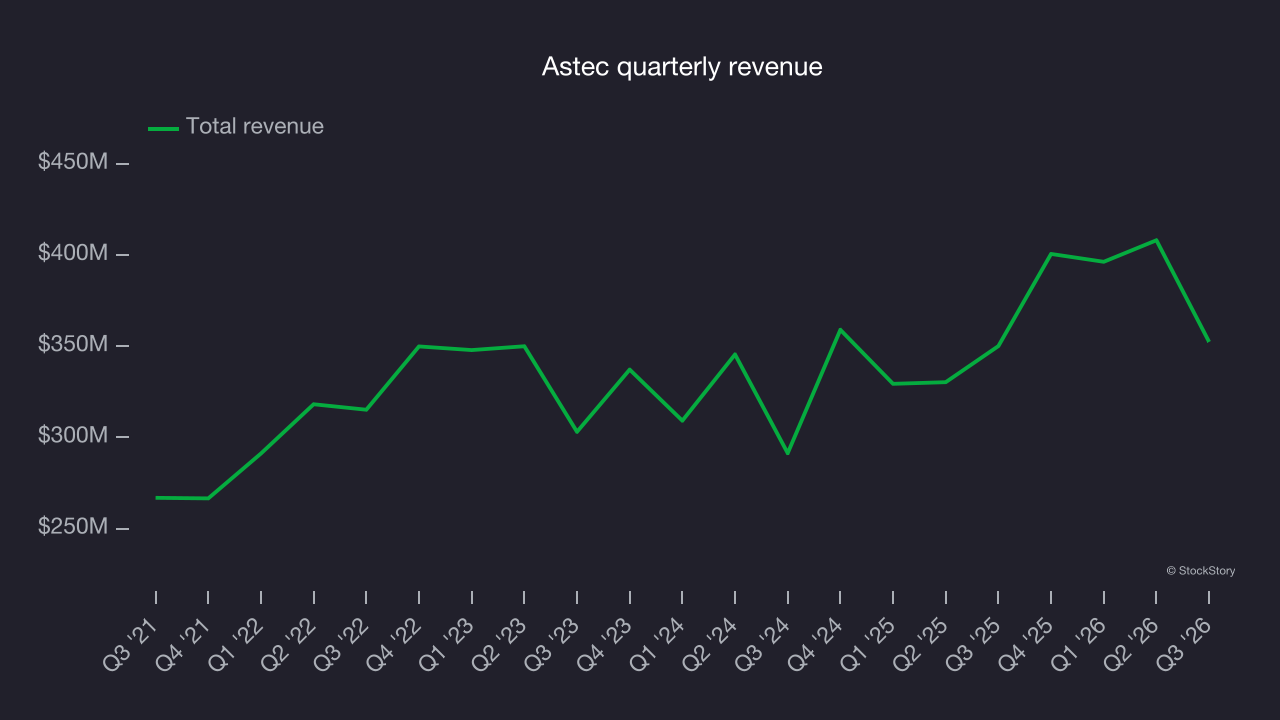
Long-term growth is the most important, but within industrials, a half-decade historical view may miss new industry trends or demand cycles. Astec’s annualized revenue growth of 10.2% over the last two years is above its five-year trend, suggesting its demand recently accelerated. 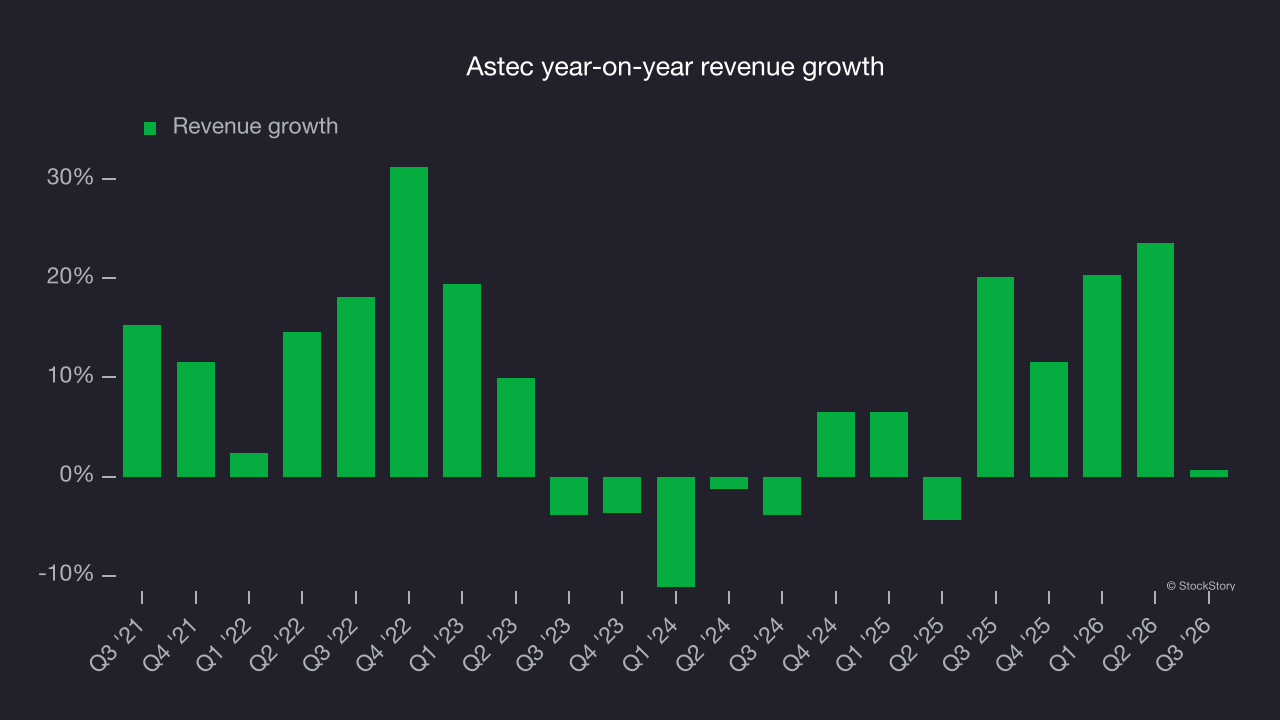
The company’s backlog, or the value of its outstanding orders that have not yet been executed or delivered, provides a clearer view of its revenue dynamics. Astec’s backlog reached $670.5 million in the latest quarter and averaged 9.7% year-on-year growth over the last two years. This was in line with revenue growth, indicating that the company effectively balanced new order intake and fulfillment. 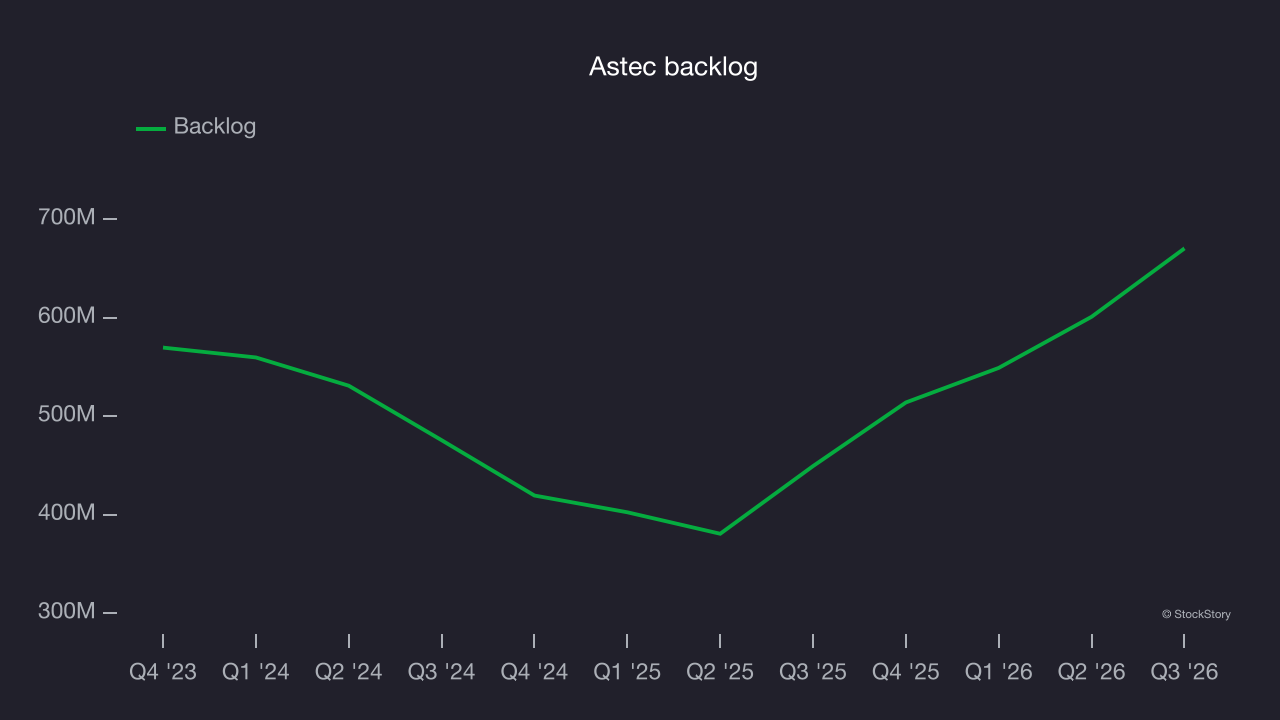
This quarter, Astec’s $352.4 million of revenue was flat year on year, falling short of Wall Street’s consensus estimates.
Looking ahead, sell-side analysts expect revenue to grow 10.2% over the next 12 months, according to S&P, similar to its two-year rate. This projection is healthy and suggests the market sees success for its products and services.
Operating margin
Operating margin is one of the best measures of profitability because it shows how much a company earns after procuring and manufacturing its products, marketing and selling them and, most importantly, keeping them relevant through research and development.
Astec was profitable over the last five years but held back by its large cost base. Its average operating margin of 5% was weak for an industrials business. That outcome is unsurprising given its low gross margin baseline.
On the positive side, Astec’s operating margin rose by 3.5 percentage points over the last five years, as its revenue growth provided operating leverage.
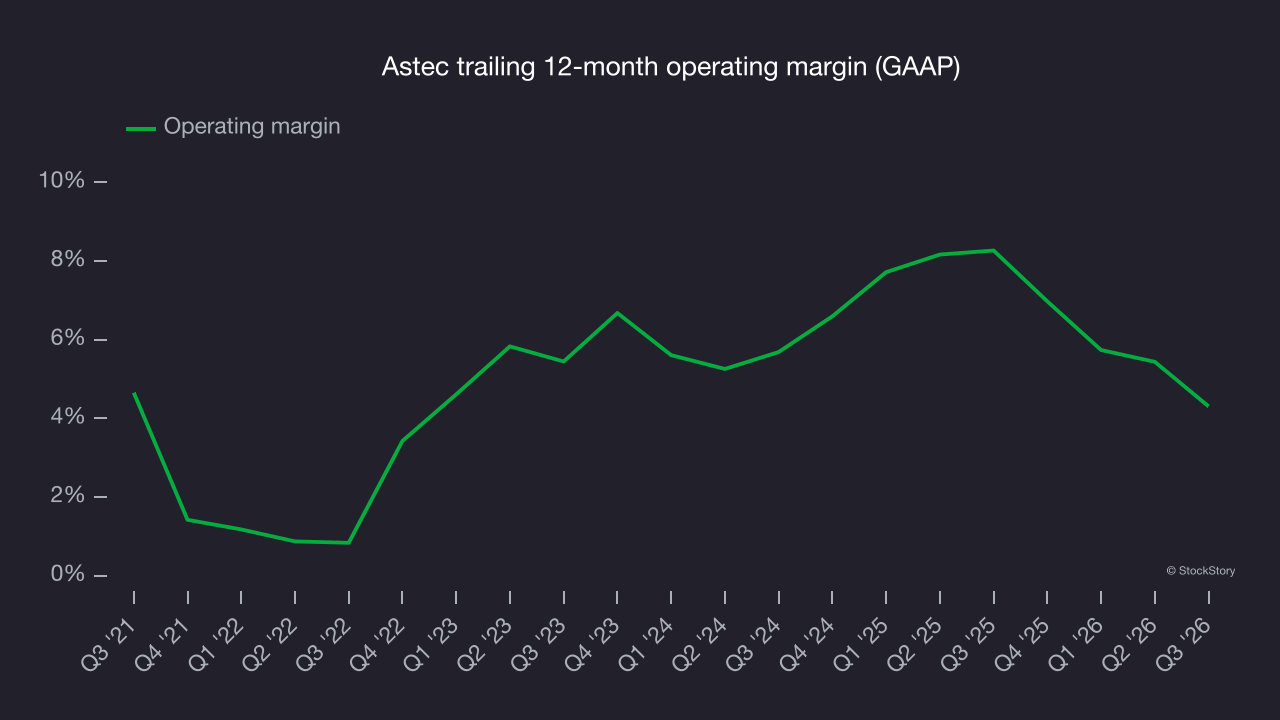
This quarter, Astec’s breakeven margin was -0.9%, down 5 percentage points year on year. Its operating margin declined more than its gross margin, suggesting lower efficiency as expenses such as marketing, research and development and administrative overhead increased.
Earnings per share
We track the long-term change in earnings per share (EPS) for the same reason as long-term revenue growth. Compared to revenue, however, EPS highlights whether a company’s growth is profitable.
Astec’s EPS grew at an unimpressive 5.2% compounded annual growth rate over the last five years, lower than its 7.8% annualized revenue growth. However, its operating margin improved during this time, indicating that non-fundamental factors such as interest expenses and taxes affected its ultimate earnings.
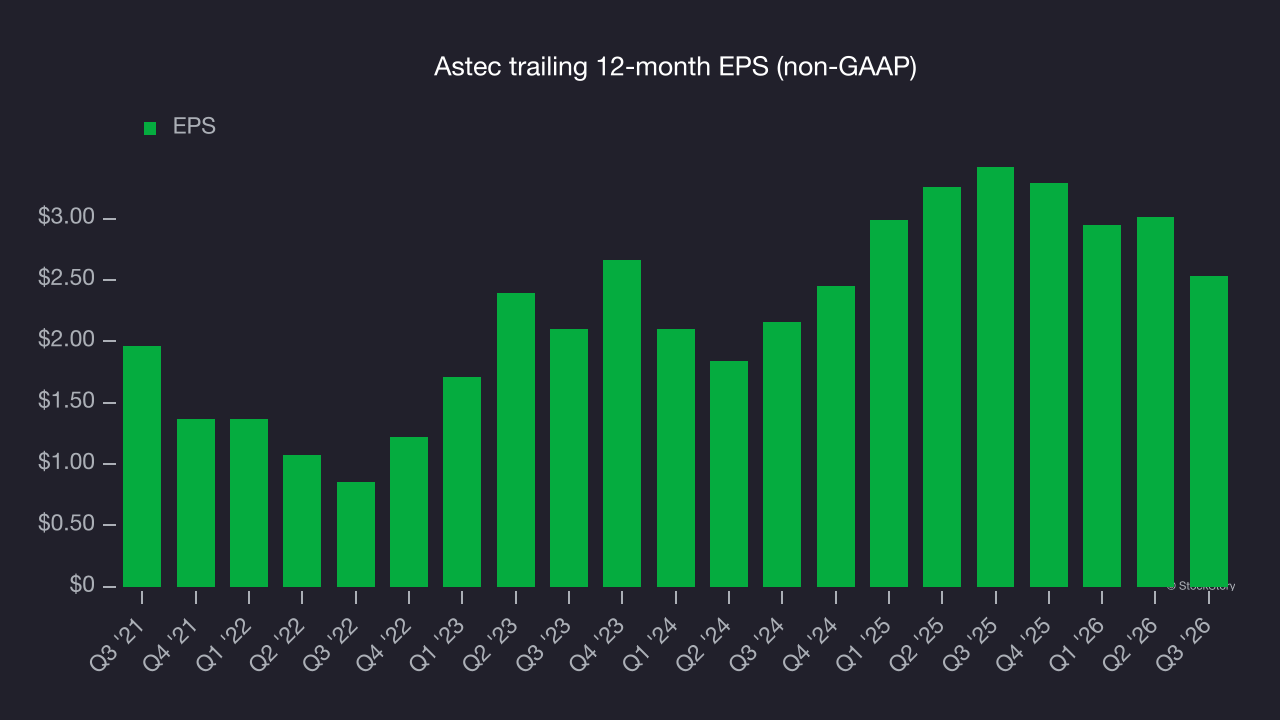
As with revenue, we analyze EPS over a shorter period to see if we are missing a change in the business.
For Astec, its two-year annual EPS growth of 8.2% was higher than its five-year trend. Accelerating earnings growth is almost always a positive sign.
In Q3, Astec reported adjusted EPS of negative $0.01, down from $0.47 in the same quarter last year. This result missed analysts’ consensus estimates. Over the next 12 months, Wall Street expects Astec’s full-year EPS to grow 53.1% from $2.53 to $3.87, according to S&P.
Key takeaways from Astec’s Q3 results
Astec’s Q3 results offered few positives: Both revenue and EBITDA fell short of Wall Street’s consensus estimates, making this a weaker quarter. Shares remained flat at $38.95 immediately after the report.
Astec may have had a tough quarter, but does that create an investment opportunity? That decision calls for a broader look at valuation, business quality and the latest earnings. For more on Astec, read our full research report here (it’s free).