

Scientific instrument company Bruker (NASDAQ: BRKR) reported Q3 2026 results exceeding the market’s revenue expectations, with revenue up 1.6% year on year to $874 million. The company expects the full year’s revenue to be around $3.54 billion, close to analysts’ consensus estimates. Its non-GAAP profit of $0.56 per share was 34.6% above analysts’ consensus estimates.
For more on Bruker, read our free full research report.
Bruker (BRKR) Q3 2026 highlights:
- Revenue $874 million vs S&P analysts’ consensus estimates of $866.4 million (1.6% year-on-year growth, 0.9% beat)
- Adjusted EPS $0.56 vs S&P analysts’ consensus estimates of $0.42 (34.6% beat)
- Revenue guidance The company reconfirmed its revenue guidance for the full year of $3.54 billion at the midpoint
- Adjusted EPS guidance Management reiterated its full-year adjusted EPS guidance of $2.13 at the midpoint
- Operating margin 16.3%, up from -6% in the same quarter last year
- Free cash flow $96.7 million, up from -$54.1 million in the same quarter last year
- Organic revenue was flat year on year (beat)
- Market capitalization $8.61 billion
He continued: “In the third quarter, we achieved very significant margin expansion and non-GAAP EPS growth, driven by our focus on cost discipline and execution. Bruker’s positive booking trends continued with the fifth consecutive quarter of Bruker Scientific Instruments (BSI) book-to-bill greater than one. We see strengthening demand in most of our end markets, and in Q3 also in the US academic market. With BSI organic bookings and backlog both up mid-single digits % year-to-date, we expect revenue growth acceleration, continued margin expansion and double-digit EPS growth in FY27.”
Revenue growth
A company’s long-term performance is an indicator of its overall quality. Any business can experience short-term success, but top-performing ones enjoy sustained growth for years. Bruker’s 8.3% annualized revenue growth over the last five years was decent. Its growth was slightly above the average healthcare company and shows its offerings resonate with customers.
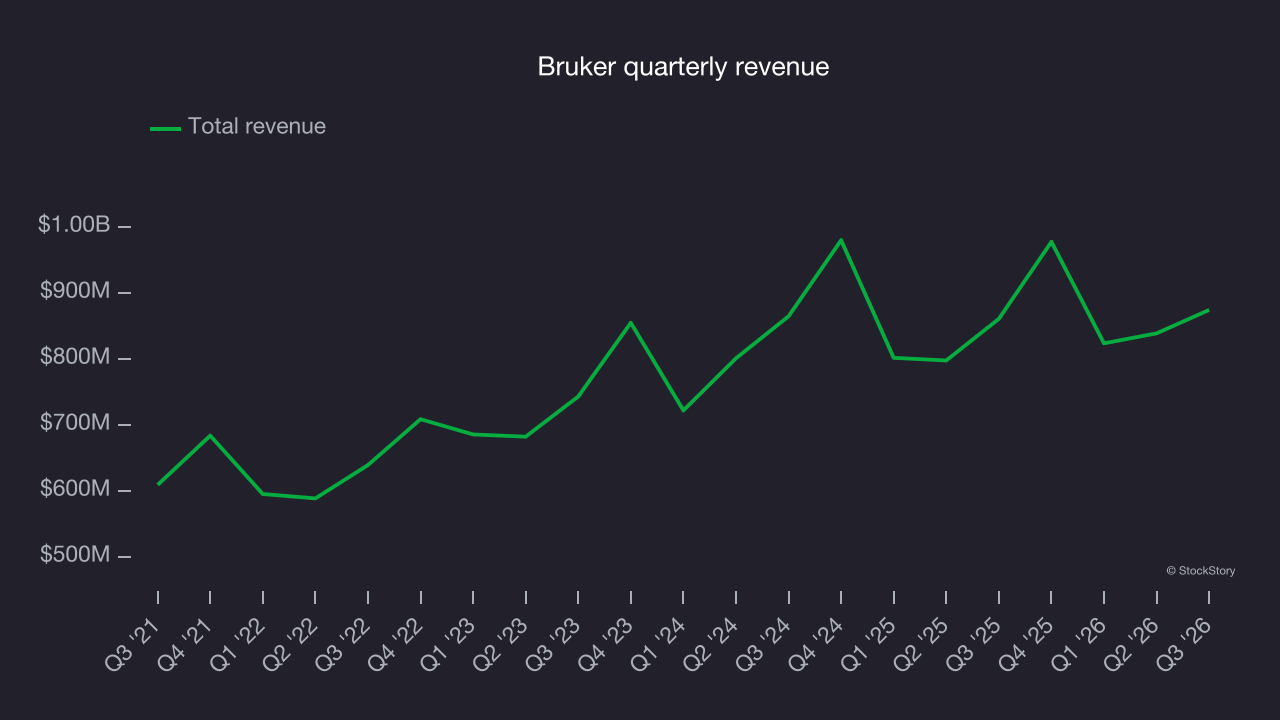
Long-term growth matters most, but within healthcare, a half-decade historical view may miss recent innovations or disruptive industry trends. Bruker’s recent performance shows its demand has slowed as its annualized revenue growth of 4.1% over the last two years was below its five-year trend. Decelerating revenue growth in the sector warrants caution, as it could signal changing consumer tastes aided by low switching costs. 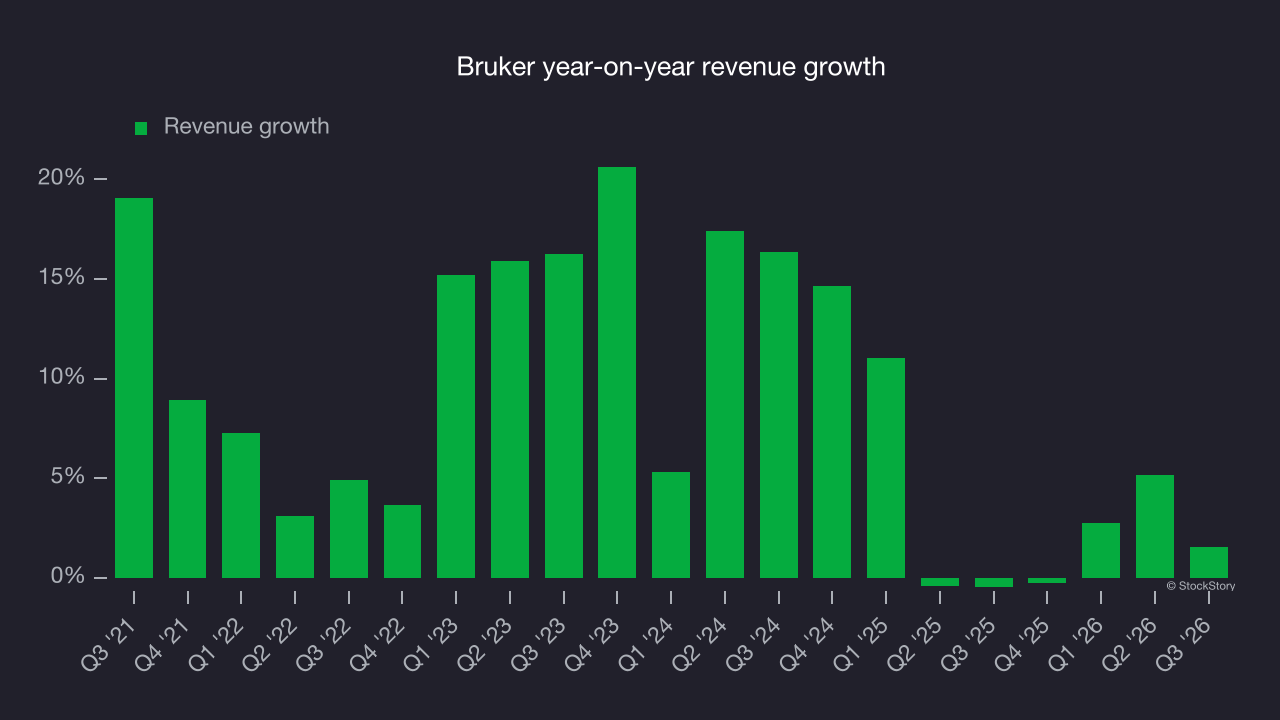
Bruker also reports organic revenue, which strips out one-time events like acquisitions and currency fluctuations that don’t accurately reflect its fundamentals. Over the last two years, Bruker’s organic revenue averaged 1.3% year-on-year declines. Organic revenue growth trailed total revenue growth over that period, indicating that some combination of acquisitions and foreign exchange rates boosted its headline results. 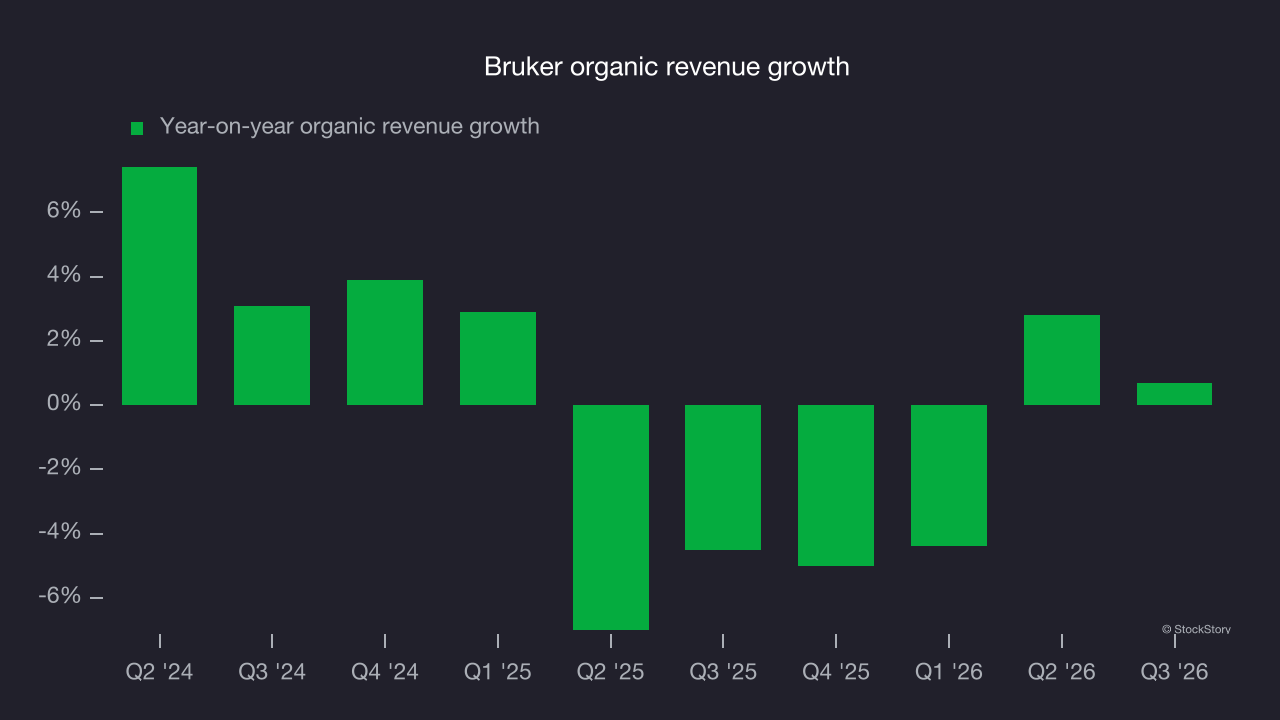
This quarter, Bruker reported modest year-on-year revenue growth of 1.6% but beat Wall Street’s consensus estimates by 0.9%.
Looking ahead, sell-side analysts expect revenue to grow 4% over the next 12 months, according to S&P, similar to its two-year rate. This projection is underwhelming and suggests its newer products and services will not catalyze better top-line performance yet.
Adjusted operating margin
Bruker has managed its cost base well over the last five years. It demonstrated solid profitability for a healthcare business, producing an average adjusted operating margin of 16.1%.
Bruker’s adjusted operating margin decreased by 5.8 percentage points over the last five years. The company’s two-year trajectory also shows it failed to restore profitability to its peak, as its margin fell by 1.1 percentage points. This was a poor performance across both periods, indicating that expenses were rising and it couldn’t pass those costs on to customers.
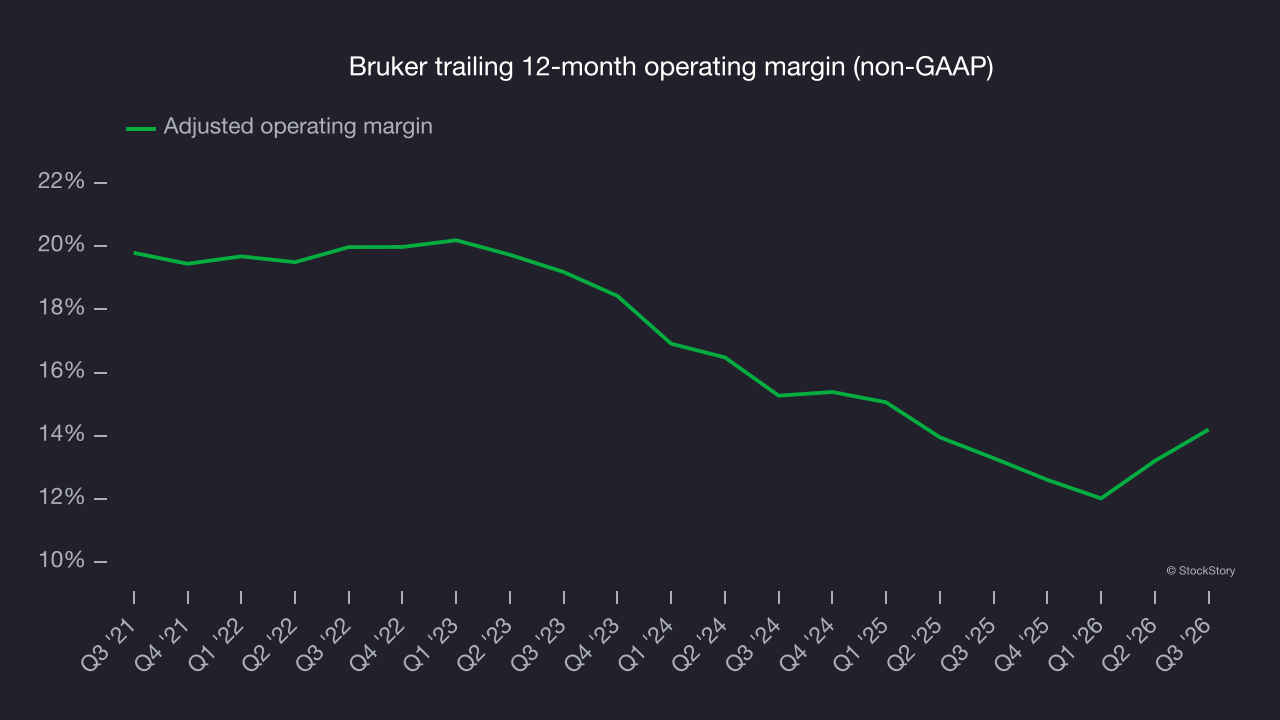
In Q3, Bruker generated an adjusted operating margin of 16.3%, up 4 percentage points year on year. This increase was a positive development and shows it was more efficient.
Earnings per share
Revenue trends explain a company’s historical growth, but the long-term change in earnings per share (EPS) points to the profitability of that growth – for example, a company could inflate its revenue through excessive spending on advertising and promotions.
Bruker’s EPS declined by 1.4% annually over the last five years while its revenue grew by 8.3%. This indicates the company became less profitable on a per-share basis as it expanded.
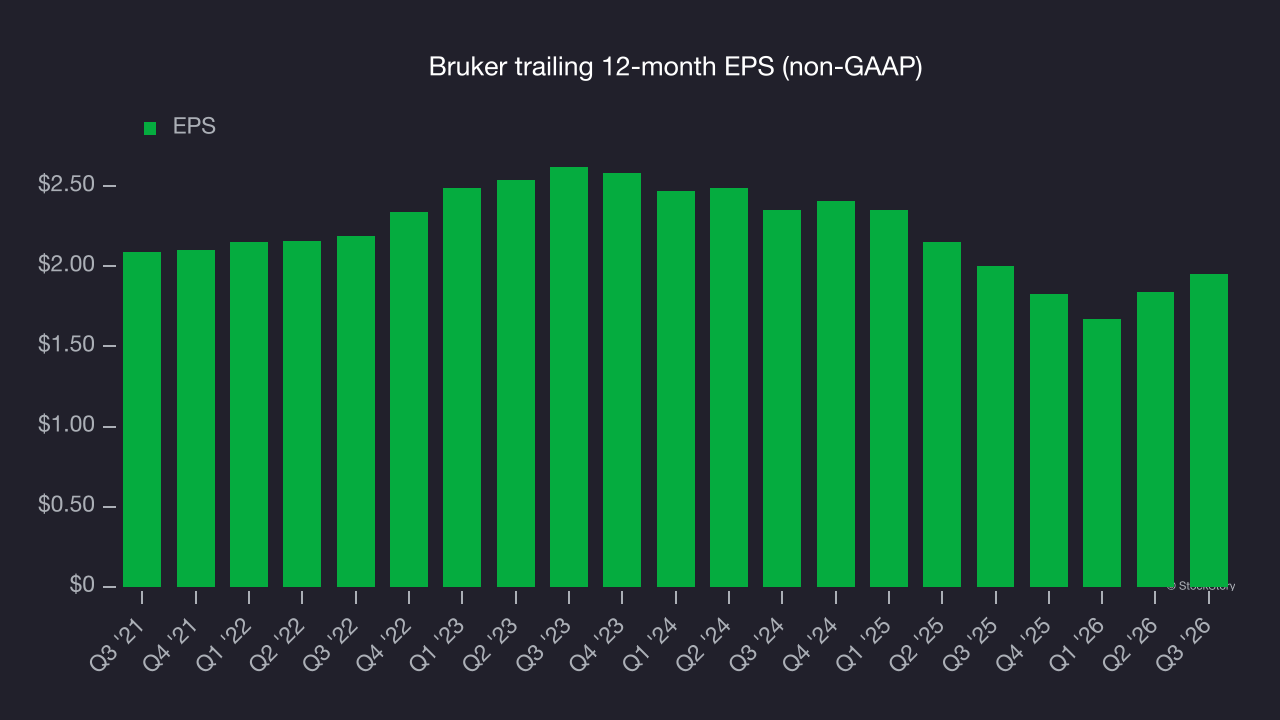
Diving into the nuances of Bruker’s earnings can give us a better understanding of its performance. As we mentioned earlier, Bruker’s adjusted operating margin expanded this quarter but declined by 5.8 percentage points over the last five years. This was the most relevant factor (aside from the revenue impact) behind its lower earnings; interest expenses and taxes can also affect EPS but don’t tell us as much about a company’s fundamentals.
In Q3, Bruker reported adjusted EPS of $0.56, up from $0.45 in the same quarter last year. Adjusted EPS comfortably beat analysts’ consensus estimates, a positive result for shareholders. Over the next 12 months, Wall Street expects Bruker’s full-year EPS to grow 22.6% from $1.95 to $2.39, according to S&P.
Key takeaways from Bruker’s Q3 results
Bruker delivered a solid Q3, with EPS beating analysts’ consensus estimates and revenue narrowly topping Wall Street’s consensus. Full-year revenue guidance, however, was only in line with expectations. Shares surged 8.1% to $61.05 immediately after the results.
Is Bruker an attractive investment at its current price? That decision calls for considering valuation and business quality as well as the latest earnings. Read the full research report here (it’s free).