
Semi-trailer and liquid transportation container manufacturer Wabash (NYSE: WNC) reported Q3 2026 results exceeding the market’s revenue expectations, with revenue up 24.8% year on year to $476.4 million. The company expects next quarter’s revenue to be around $435 million, close to analysts’ consensus estimates. Its non-GAAP loss of $0.63 per share was 38.5% below analysts’ consensus estimates.
For more on Wabash, read our full research report for free.
Wabash (WNC) Q3 2026 highlights:
- Revenue $476.4 million vs S&P analysts’ consensus estimates of $453.8 million (24.8% year-on-year growth, 5% beat)
- Adjusted EPS -$0.63 vs S&P analysts’ consensus estimates of -$0.46 (38.5% miss)
- Adjusted EBITDA -$10.45 million vs analysts’ consensus estimates of $500,000 (-2.2% margin, significant miss)
- Revenue guidance $435 million at the midpoint for Q4 2026, roughly in line with analysts’ consensus estimates
- Adjusted EPS guidance -$0.65 at the midpoint for Q4 2026, below analysts’ consensus estimates of -$0.18
- Operating margin -4.2%, down from 15.2% in the same quarter last year
- Free cash flow -$40.77 million, down from $60.62 million in the same quarter last year
- Backlog $1.20 billion at quarter end, up 44.5% year on year
- Market capitalization $563 million
"Our third quarter results represent another step forward in what continues to be a transition year for Wabash", explained Brent Yeagy, president and chief executive officer. "Beneath the results we have explicit and material evidence in demonstrated customer demand. That gives confidence that the conditions required for a broader recovery are solidly in place. As a direct result of customer order activity at scale, we aggressively pulled forward capacity addition actions into Q3, actions previously slated for Q1 and Q2 of 2027, to increase dry van output in direct response".
Revenue growth
Examining a company’s long-term performance can provide clues about its quality. Even a bad business can perform well for one or two quarters, but a top-tier one grows for years. Wabash’s demand was weak over the last five years as its revenue fell at a 2.6% annual rate. That underwhelming result suggests poor business quality.
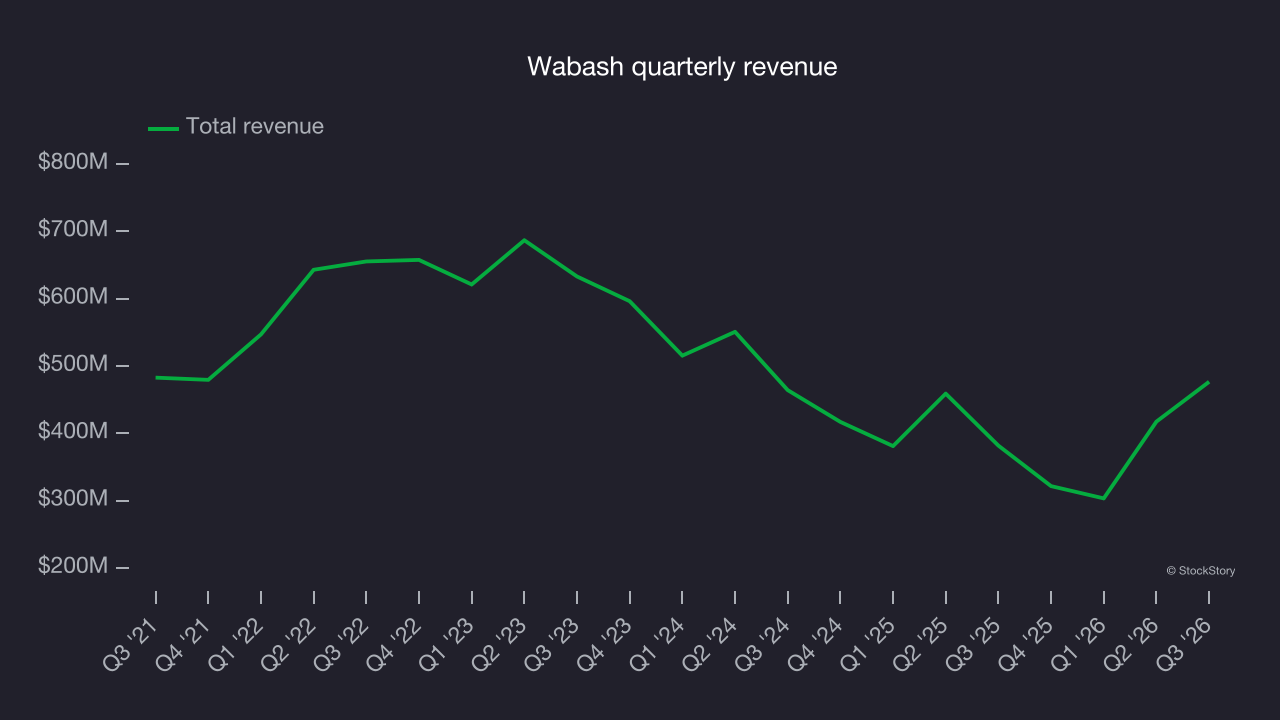
Long-term growth matters most, but within industrials, a half-decade historical view may miss cycles, industry trends or a company capitalizing on catalysts such as a new contract win or a successful product line. Wabash’s recent performance shows its demand remained suppressed as its revenue has declined by 15.5% annually over the last two years. 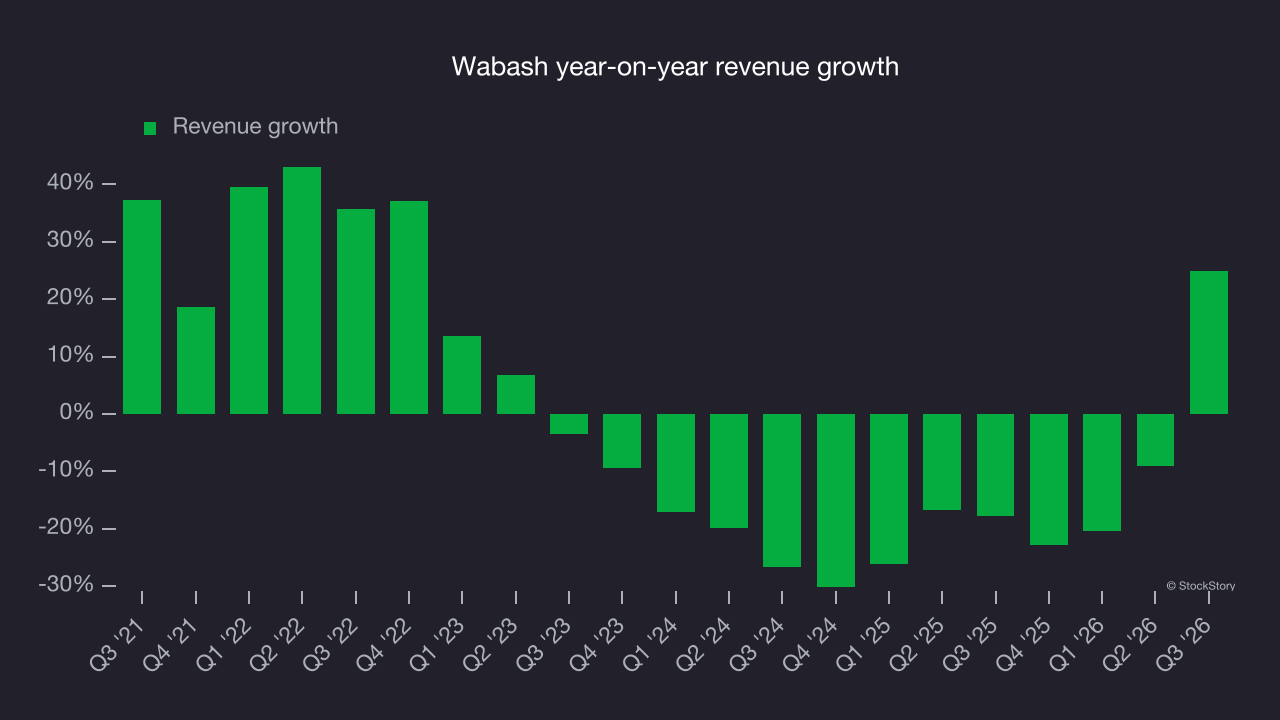
Analyzing the company’s backlog, or the value of its outstanding orders that have not yet been executed or delivered, provides more detail on its revenue dynamics. Wabash’s backlog reached $1.20 billion in the latest quarter and averaged 15% year-on-year declines over the last two years. This trend was in line with its revenue growth, indicating that the company effectively balanced its new order intake and fulfillment processes. 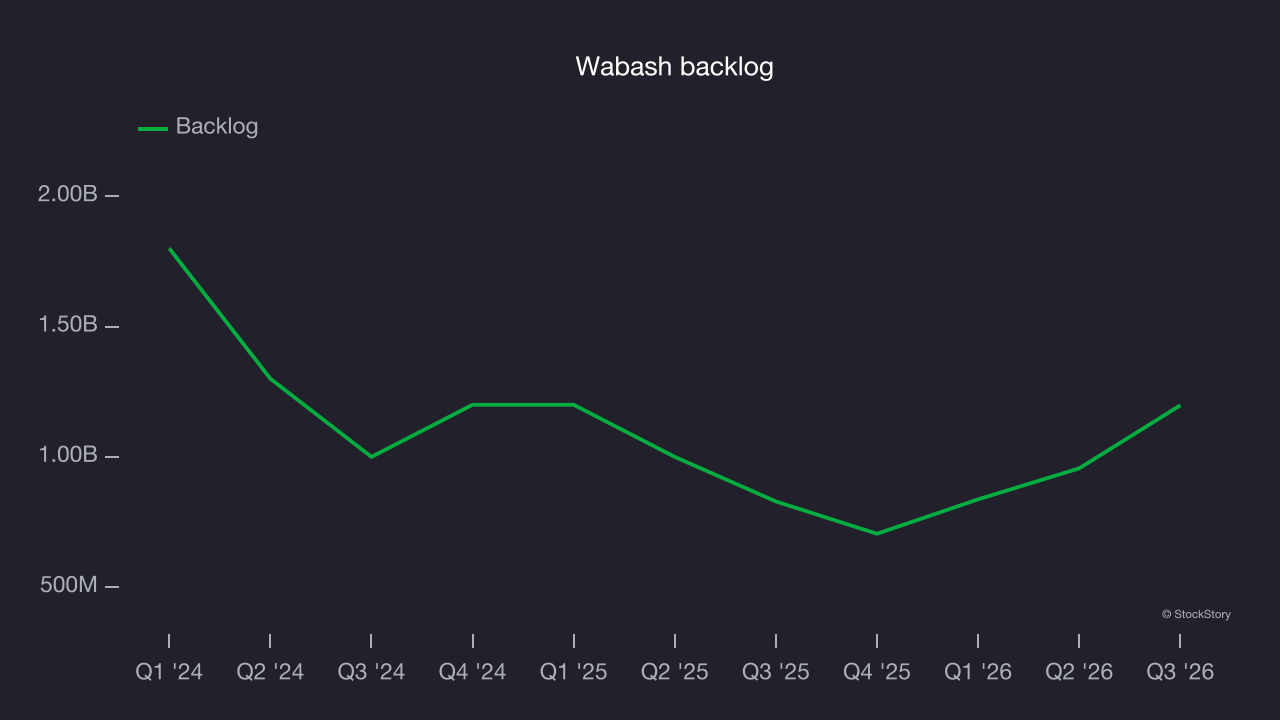
This quarter, Wabash reported year-on-year revenue growth of 24.8%, and its $476.4 million of revenue topped Wall Street’s consensus estimates by 5%. Company management is currently guiding for a 35.3% year-on-year increase in revenue next quarter.
Looking further ahead, sell-side analysts expect revenue to grow 29.6% over the next 12 months, according to S&P, an improvement versus the last two years. This strong projection implies its newer products and services will drive better revenue performance.
Operating margin
Wabash was profitable over the last five years but held back by its large cost base. Its average operating margin of 3.5% was weak for an industrials business. That outcome is unsurprising given its low gross margin baseline.
Analyzing the trend in its profitability, Wabash’s operating margin decreased by 14.8 percentage points over the last five years. Wabash’s performance was poor, indicating that costs were rising and it couldn’t pass them on to its customers.
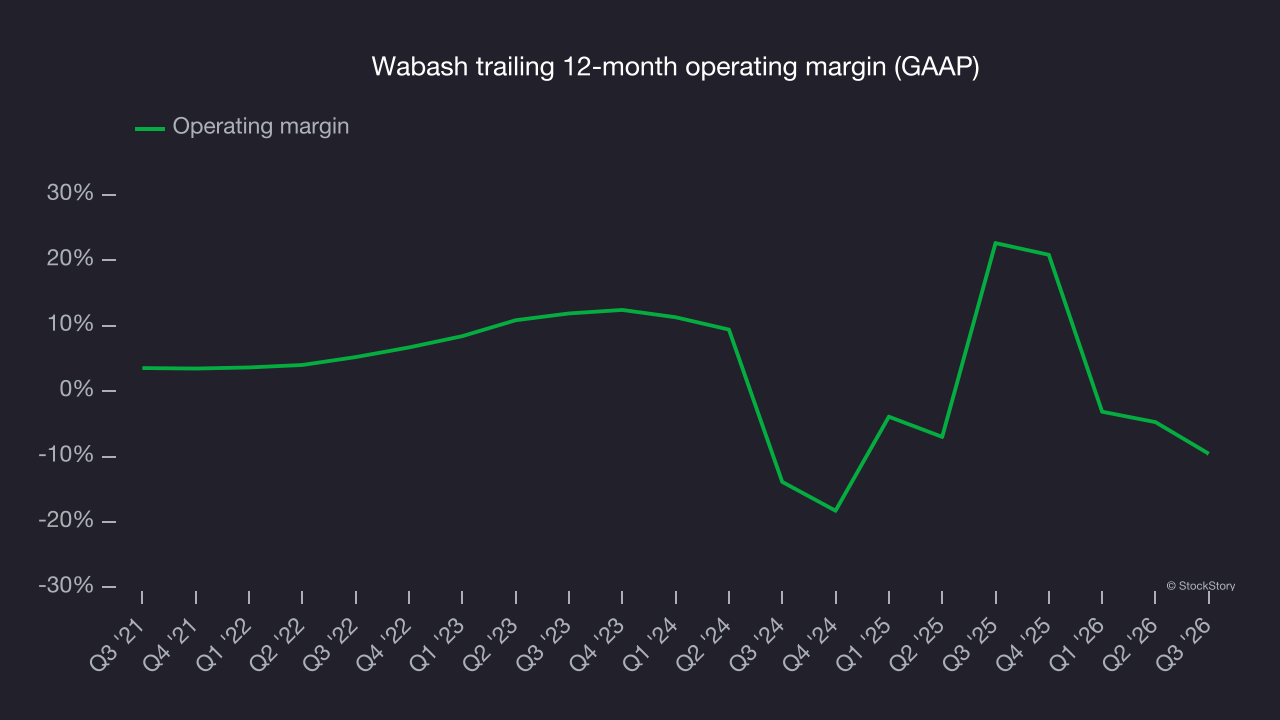
This quarter, Wabash generated an operating margin of negative 4.2%, down 19.4 percentage points year on year. Since Wabash’s operating margin decreased more than its gross margin, it was likely less efficient because expenses such as marketing, R&D and administrative overhead increased.
Earnings per share
Revenue trends explain a company’s historical growth, but the long-term change in earnings per share (EPS) points to the profitability of that growth. For example, a company could inflate its revenue through excessive spending on advertising and promotions.
Wabash’s EPS declined by 49.7% annually over the last five years, more than its revenue. This indicates the company struggled because its fixed cost base made it difficult to adjust to shrinking demand.
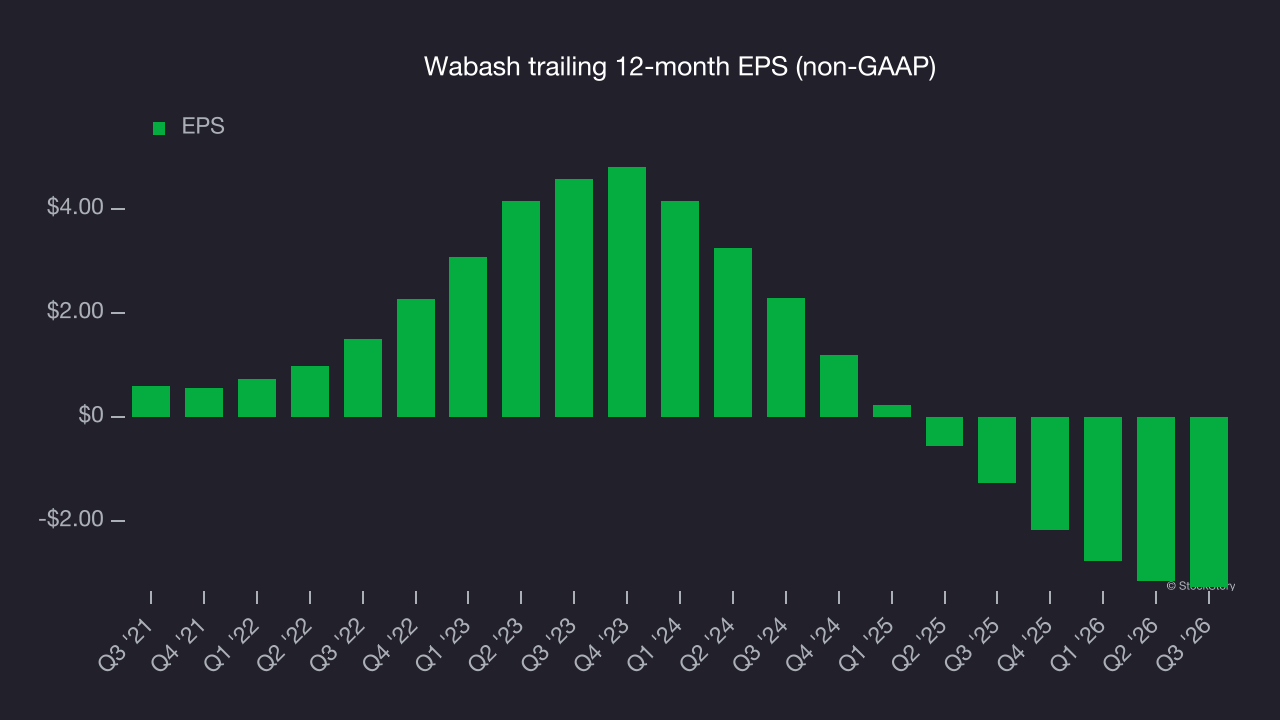
A closer look at Wabash’s earnings helps explain its performance. As noted earlier, Wabash’s operating margin declined by 14.8 percentage points over the last five years. This was the most relevant factor (aside from the revenue impact) behind its lower earnings; interest expenses and taxes can also affect EPS but don’t tell us as much about a company’s fundamentals.
As with revenue, we analyze EPS over a more recent period because it can provide insight into an emerging theme or development for the business.
For Wabash, its two-year annual EPS declines of 85% show it’s continued to underperform. These results were poor across the periods examined.
In Q3, Wabash reported adjusted EPS of negative $0.63, down from negative $0.51 in the same quarter last year. This result missed analysts’ consensus estimates. Over the next 12 months, Wall Street expects an improvement. Analysts forecast Wabash’s full-year EPS will turn positive, from negative $3.26 to positive $0.30, according to S&P.
Key takeaways from Wabash’s Q3 results
Wabash’s revenue came in well above analysts’ consensus estimates, but earnings fell short: EBITDA missed expectations, as did EPS. Those shortfalls made this a softer quarter overall. Shares remained flat at $13.82 immediately after the results.
Wabash’s earnings report left something to be desired. The question is whether this quarter has created an opportunity to buy the stock. The latest quarter is only one piece of the longer-term business quality picture. Quality, when combined with valuation, can help determine if the stock is a buy. For more on Wabash, read our full research report here (it’s free).