

Medical technology company Stryker (NYSE: SYK) missed Wall Street’s revenue expectations in Q3 2026, but revenue rose 7.6% year on year to $6.52 billion. Its non-GAAP profit of $3.52 per share was 0.8% below analysts’ consensus estimates.
For more on Stryker, read our free full research report.
Stryker (SYK) Q3 2026 highlights:
- Revenue $6.52 billion vs S&P analysts’ consensus estimates of $6.62 billion (7.6% year-on-year growth, 1.5% miss)
- Adjusted EPS $3.52 vs S&P analysts’ consensus estimates of $3.55 (0.8% miss)
- Adjusted EPS guidance Management lowered its full-year adjusted EPS guidance to $14.85 at the midpoint, a 1.2% decrease
- Operating margin 15.9%, down from 18.7% in the same quarter last year
- Free cash flow margin 18.8%, down from 22.3% in the same quarter last year
- Organic revenue rose 7.7% year on year (miss)
- Market capitalization $116.6 billion
“We delivered 7.7% organic sales growth and double-digit adjusted earnings growth in the quarter,” said Kevin A. Lobo, Chair and CEO. “While, in absolute terms, this reflected good overall performance, it did fall short of our expectations. The underlying fundamentals of the business remain strong, and we expect a solid performance in Q4 and good momentum heading into 2027.”
Revenue growth
A company’s long-term performance is an indicator of its overall quality. Any business can deliver a good quarter or two, but the best consistently grow over the long term. Over the last five years, Stryker grew its revenue at a decent 9.5% compounded annual growth rate. Its growth was slightly above that of the average healthcare company and shows its offerings resonate with customers.
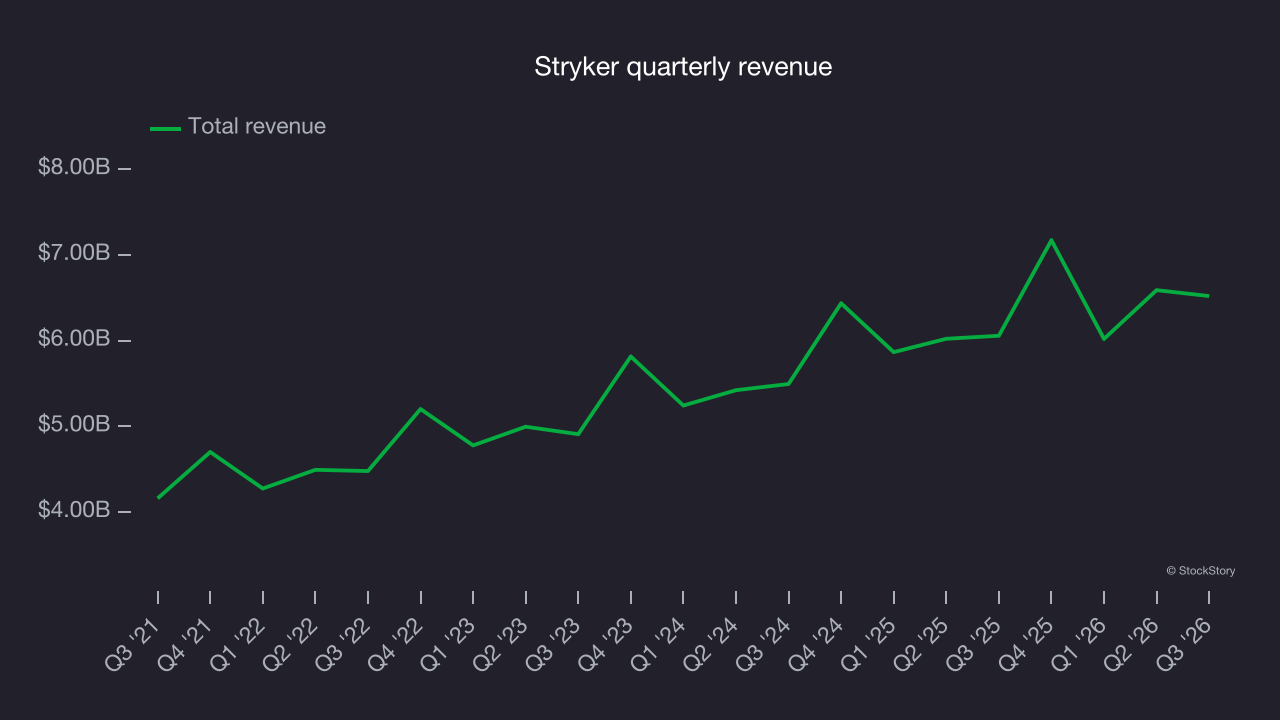
Long-term growth is the most important, but within healthcare, a half-decade historical view may miss new innovations or demand cycles. Stryker’s annualized revenue growth of 9.4% over the last two years aligns with its five-year trend, suggesting its demand was stable. 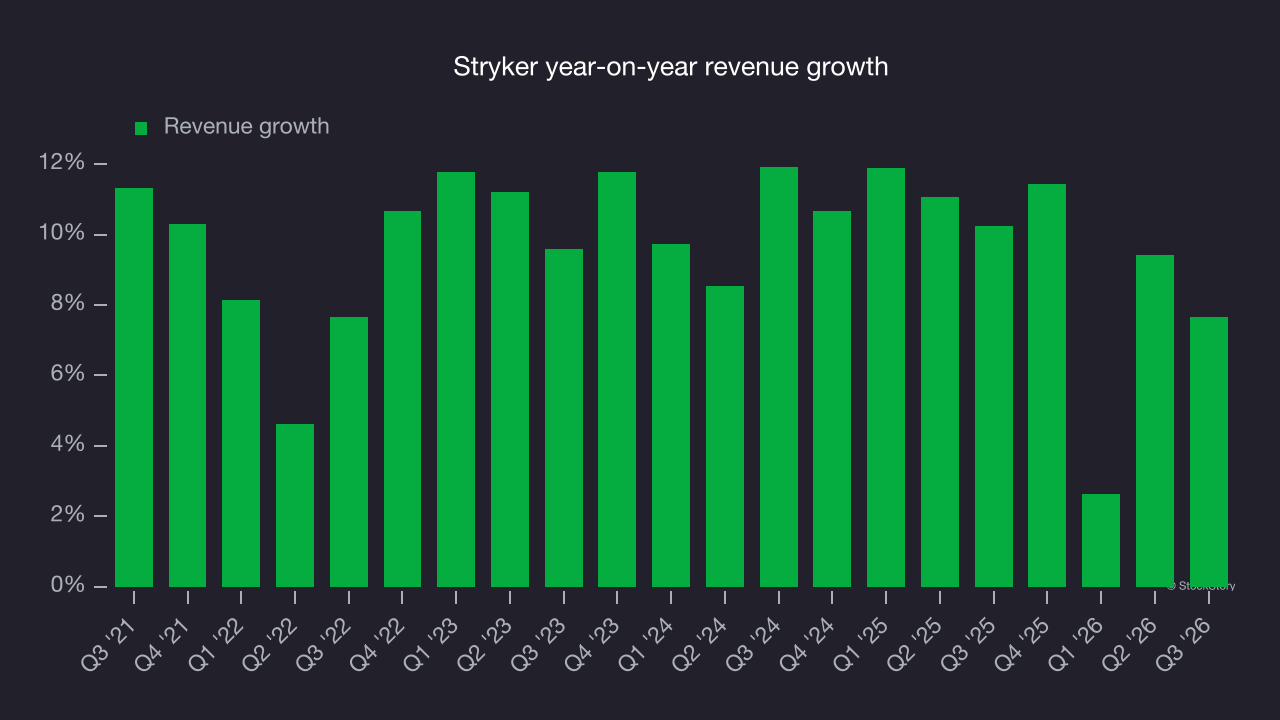
The company’s organic revenue provides a closer look at its revenue dynamics by stripping out one-time events like acquisitions and currency fluctuations that don’t accurately reflect its fundamentals. Over the last two years, Stryker’s organic revenue averaged 8.8% year-on-year growth. This was in line with its two-year revenue growth, indicating that core operations, rather than acquisitions and divestitures, drove most of its results. 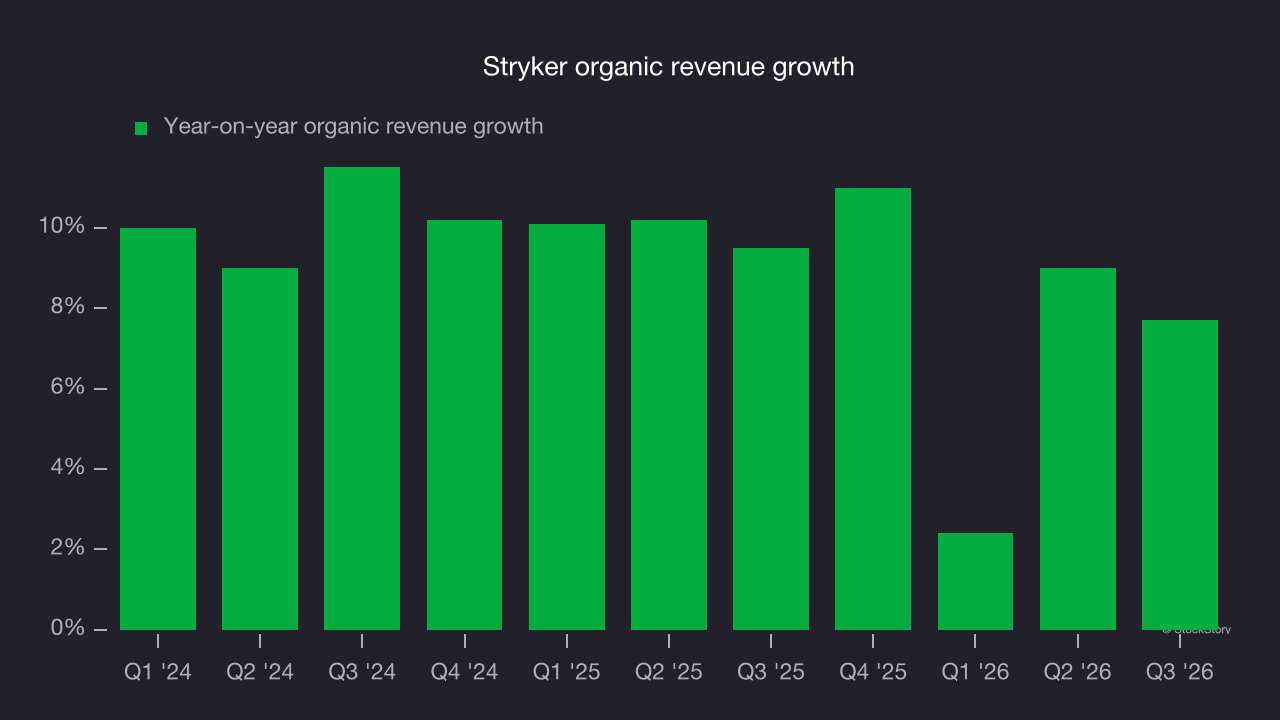
This quarter, Stryker’s revenue grew by 7.6% year on year to $6.52 billion, missing Wall Street’s consensus estimates.
Looking ahead, sell-side analysts expect revenue to grow 9.7% over the next 12 months, according to S&P, similar to its two-year rate. This projection is particularly healthy for a company of its scale and suggests the market expects success for its products and services.
Adjusted operating margin
Adjusted operating margin is an important measure of profitability as it shows the portion of revenue left after accounting for all core expenses, from the cost of goods sold to advertising and wages. It’s also useful for comparing profitability across companies because it excludes non-recurring expenses, interest on debt and taxes.
Stryker’s adjusted operating margin has stayed roughly the same over the last 12 months, averaging 24.5% over the last five years. This profitability was high for a healthcare business, showing it’s a well-run company with an efficient cost structure.
Stryker’s adjusted operating margin might have fluctuated slightly but has generally stayed the same over the last five years. This raises questions about the company’s expense base because its revenue growth should have given it leverage on its fixed costs, resulting in better economies of scale and profitability.
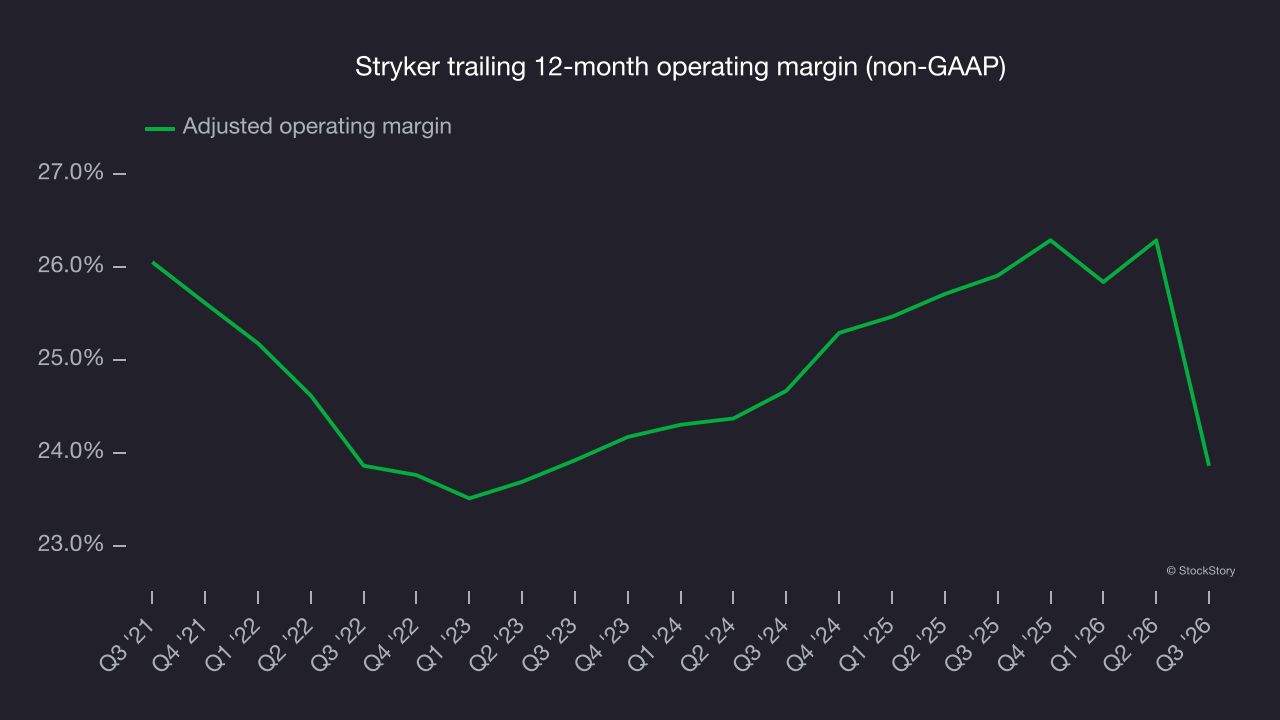
In Q3, Stryker generated an adjusted operating margin of 15.9%, down 9.7 percentage points year on year. This contraction shows it was less efficient because its expenses grew faster than its revenue.
Earnings per share
The long-term change in earnings per share (EPS) is worth tracking for the same reason as long-term revenue growth. Compared to revenue, however, EPS highlights whether a company’s growth is profitable.
Stryker’s strong 9.2% annual EPS growth over the last five years aligns with its revenue performance. This indicates it maintained its per-share profitability as it expanded.
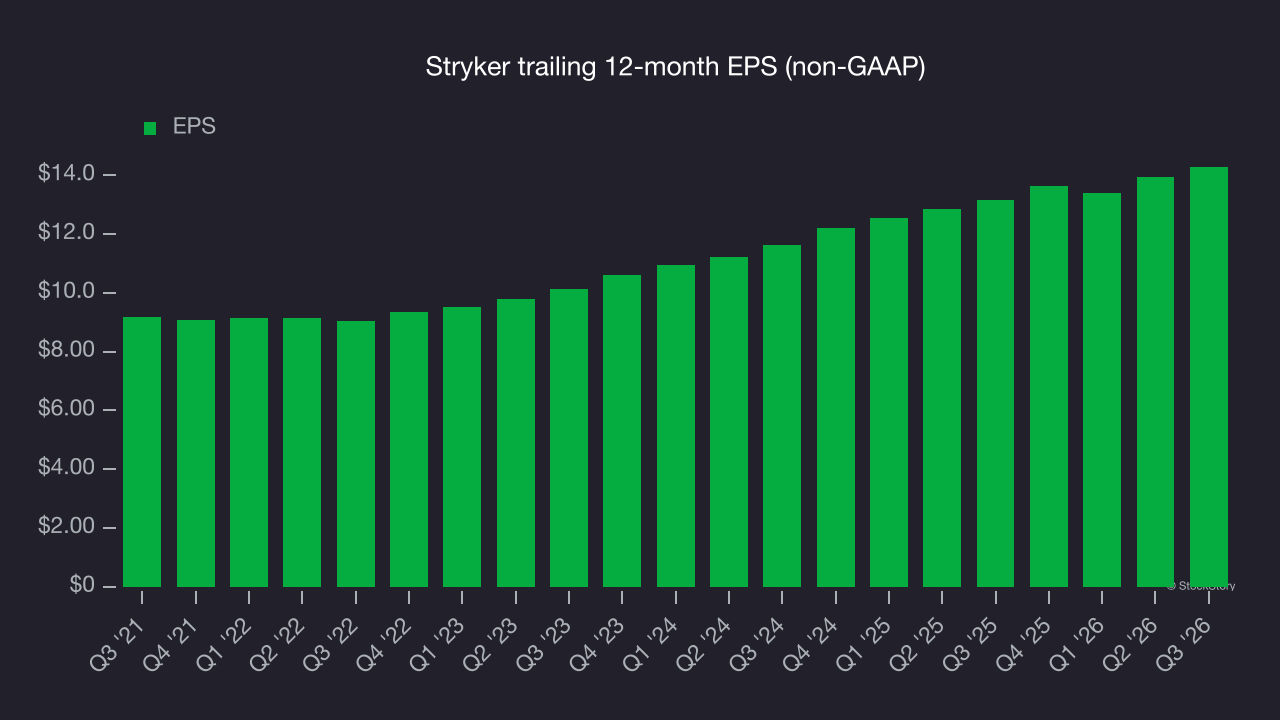
In Q3, Stryker reported adjusted EPS of $3.52, up from $3.19 in the same quarter last year. This result was close to analysts’ consensus estimates. Over the next 12 months, Wall Street expects Stryker’s full-year EPS to grow 14.7% from $14.28 to $16.38, according to S&P.
Key takeaways from Stryker’s Q3 results
Stryker’s Q3 results offered few positives: revenue narrowly missed Wall Street’s consensus estimates, and organic revenue also fell short. The quarter could have been better. Shares tumbled 8.5% to $285.23 immediately after the report.
Stryker may have had a tough quarter, but does that create an investment opportunity at the current price? The latest quarter is only one part of the company’s longer-term business quality. Quality, when combined with valuation, can help determine if the stock is a buy. For more on Stryker, read our full research report here (it’s free).