

Industrial equipment and engineered products manufacturer Albany (NYSE: AIN) reported Q3 2026 results topping the market’s revenue expectations, with revenue up 33.7% year on year to $349.5 million. Its non-GAAP profit of $1.68 per share was 13.5% above analysts’ consensus estimates.
For more on Albany, read our free full research report.
Albany (AIN) Q3 2026 highlights:
- Revenue $349.5 million vs S&P analysts’ consensus estimates of $326.1 million (33.7% year-on-year growth, 7.2% beat)
- Adjusted EPS $1.68 vs S&P analysts’ consensus estimates of $1.48 (13.5% beat)
- Adjusted EBITDA $100.1 million vs analysts’ consensus estimates of $51.88 million (28.6% margin, 93% beat)
- Operating margin 17%, up from -43.7% in the same quarter last year
- Free cash flow margin 10.4%, similar to the same quarter last year
- Market capitalization $1.78 billion
Kleveland continued, “In Machine Clothing, our team navigated a dynamic market environment and delivered sales at the high-end of expectations, reflecting the resilience of the business and the strength of our team. Taken together, our performance reflects the progress we have made to optimize Albany’s operating model and reduce risk across our portfolio. We are pleased with the performance across the organization and look forward to updating investors on our path forward at our upcoming investor day in December.”
Revenue growth
A company’s long-term revenue performance is one signal of its overall quality. Any business can put up a good quarter or two, but many enduring ones grow for years. Albany’s revenue grew at a mediocre 7.4% compounded annual growth rate over the last five years, falling short of the industrials sector standard.
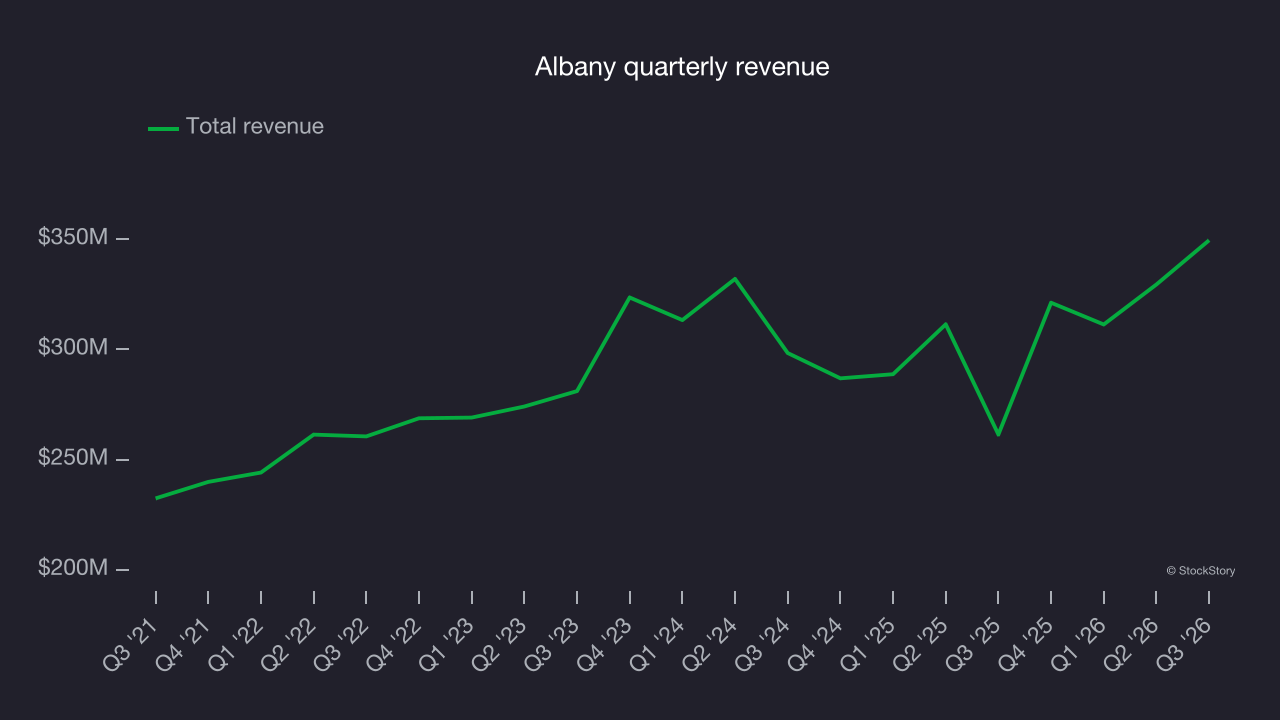
Long-term growth matters most, but within industrials, a half-decade historical view may miss cycles, industry trends or a company capitalizing on catalysts such as a new contract win or a successful product line. Albany’s recent performance shows its demand has slowed as its annualized revenue growth of 1.7% over the last two years was below its five-year trend. Decelerating revenue growth in the sector is a concern, as it could signal changing consumer tastes aided by low switching costs. 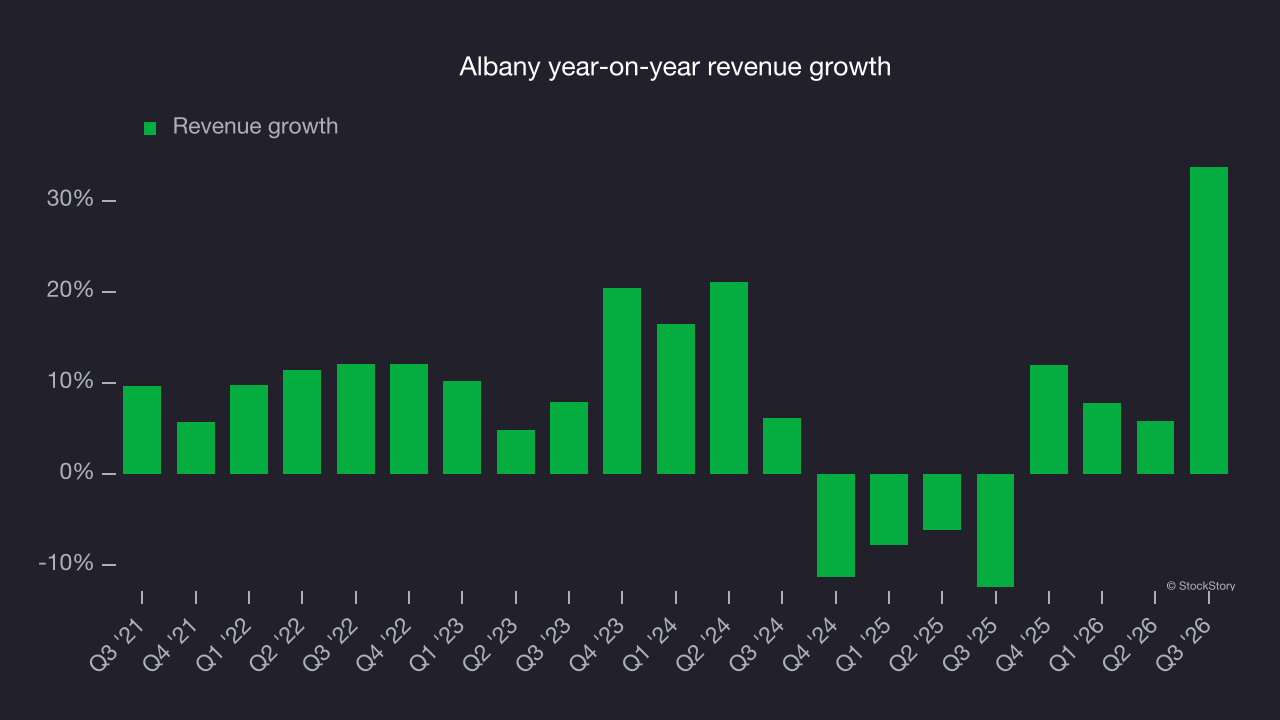
We can better understand the company’s revenue dynamics by analyzing its most important segment, Machine Clothing. Over the last two years, Albany’s Machine Clothing revenue (paper manufacturing belts) averaged 4.6% year-on-year declines. This segment has lagged the company’s overall revenue. 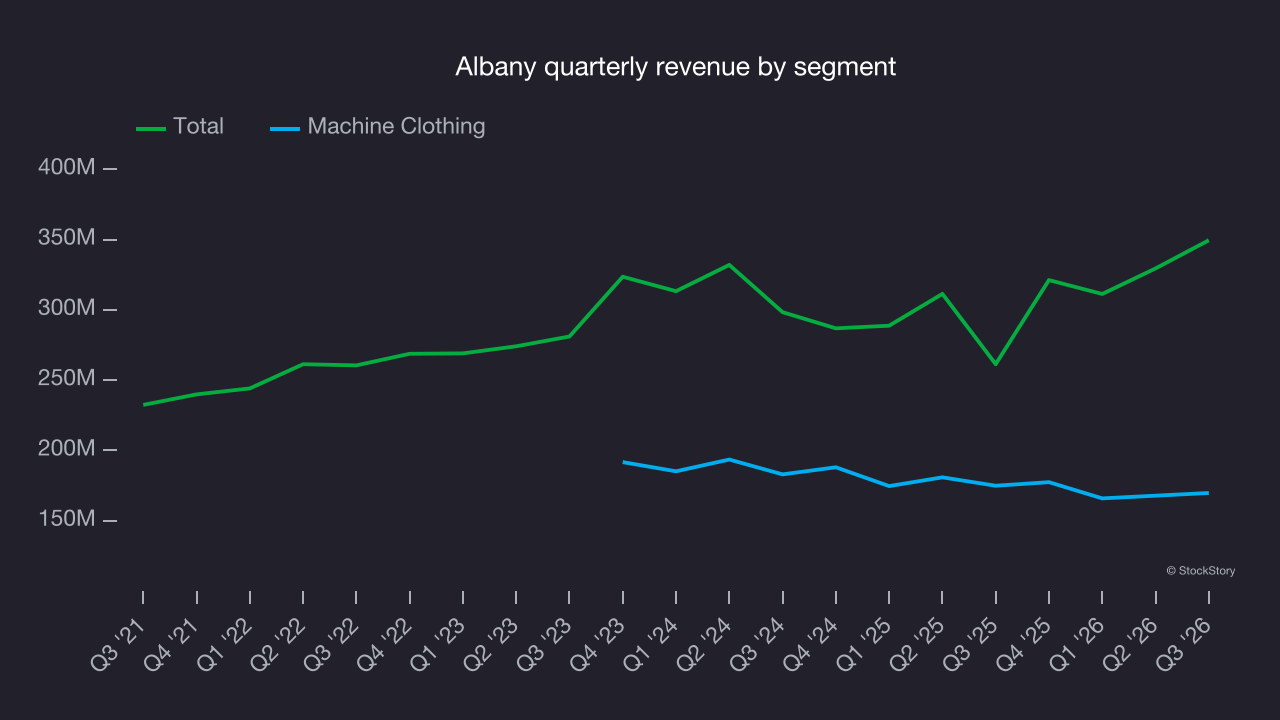
This quarter, Albany reported strong year-on-year revenue growth of 33.7%, and its $349.5 million of revenue exceeded Wall Street’s consensus estimates by 7.2%.
Projected revenue growth is another way to assess companies, but not enough Wall Street analysts cover Albany for it to have reliable consensus estimates.
Operating margin
Albany has managed its cost base well over the last five years. It demonstrated solid profitability for an industrials business, producing an average operating margin of 10.9%.
Analyzing the trend in its profitability, Albany’s operating margin decreased by 6.6 percentage points over the last five years. This raises questions about the company’s expense base because its revenue growth should have given it leverage on its fixed costs, resulting in better economies of scale and profitability.
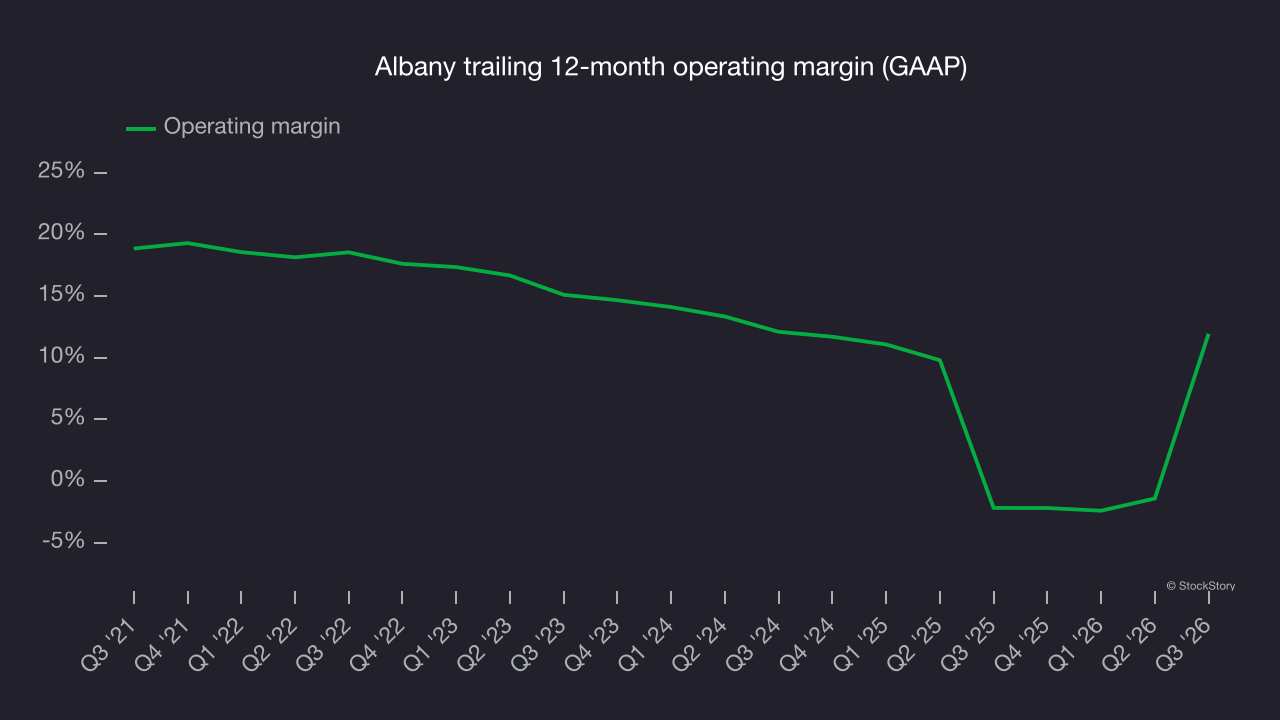
In Q3, Albany generated an operating margin of 17%, up 60.7 percentage points year on year. The increase was solid, and its operating margin rose more than its gross margin, indicating greater efficiency in expenses such as marketing, R&D and administrative overhead.
Earnings per share
Revenue trends explain a company’s historical growth, but the long-term change in earnings per share (EPS) points to the profitability of that growth. For example, a company could inflate its revenue through excessive spending on advertising and promotions.
Albany’s flat EPS over the last five years was below its 7.4% annualized revenue growth. This indicates the company became less profitable on a per-share basis as it expanded due to non-fundamental factors such as interest expenses and taxes.
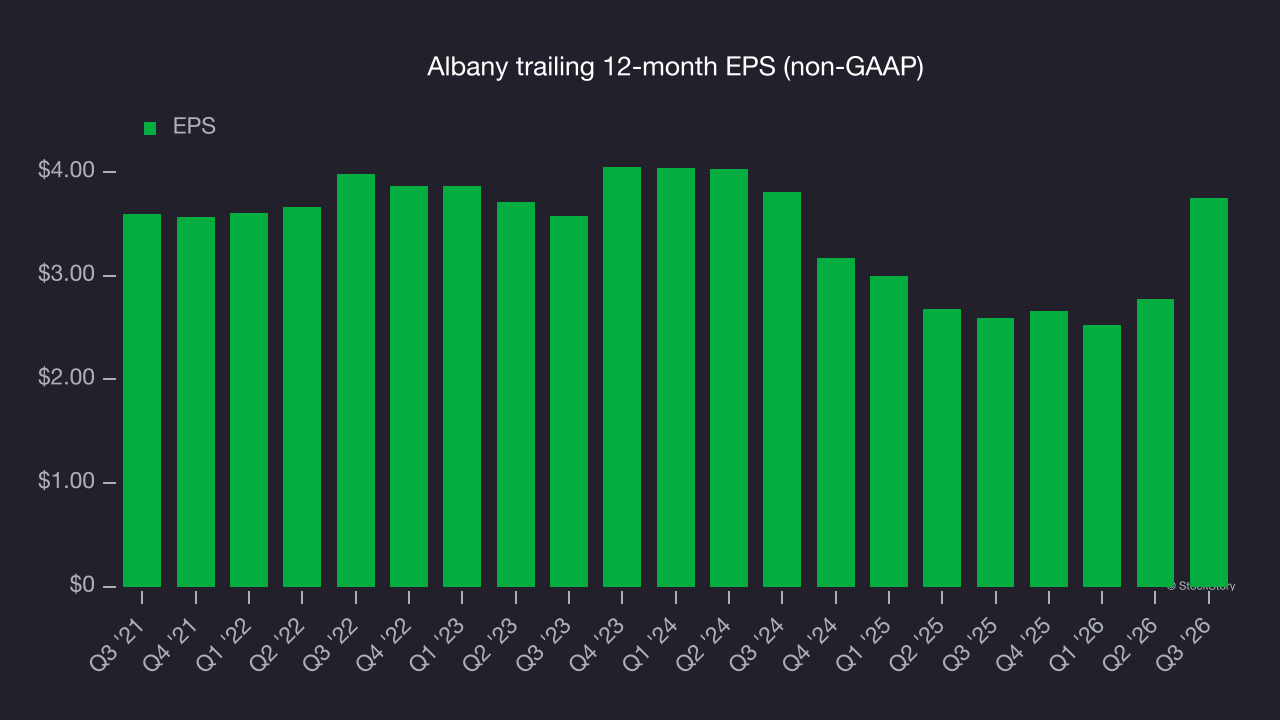
We can take a deeper look into Albany’s earnings to better understand the drivers of its performance. As we mentioned earlier, Albany’s operating margin expanded this quarter but declined by 6.6 percentage points over the last five years. This was the most relevant factor (aside from the revenue impact) behind its lower earnings; interest expenses and taxes can also affect EPS but don’t tell us as much about a company’s fundamentals.
As with revenue, analyzing EPS over a more recent period can provide insight into an emerging theme or development for the business.
Albany’s earnings performance did not improve over the last two years, as its EPS remained flat.
In Q3, Albany’s adjusted EPS rose to $1.68 from $0.71 in the same quarter last year. This was well above analysts’ consensus estimates, a positive result for shareholders. Expected EPS growth based on Wall Street analysts’ consensus projections would offer further insight, but there is insufficient data.
Key takeaways from Albany’s Q3 results
Albany delivered two sizable beats in Q3, with EBITDA and revenue both exceeding analysts’ consensus estimates by wide margins. Those results gave the quarter some important positives. Shares remained flat at $62.52 immediately following the results.
Is Albany an attractive investment at its current price? The latest quarter matters, but not nearly as much as longer-term fundamentals and valuation when deciding whether to invest. Read the full research report here (it’s free).