
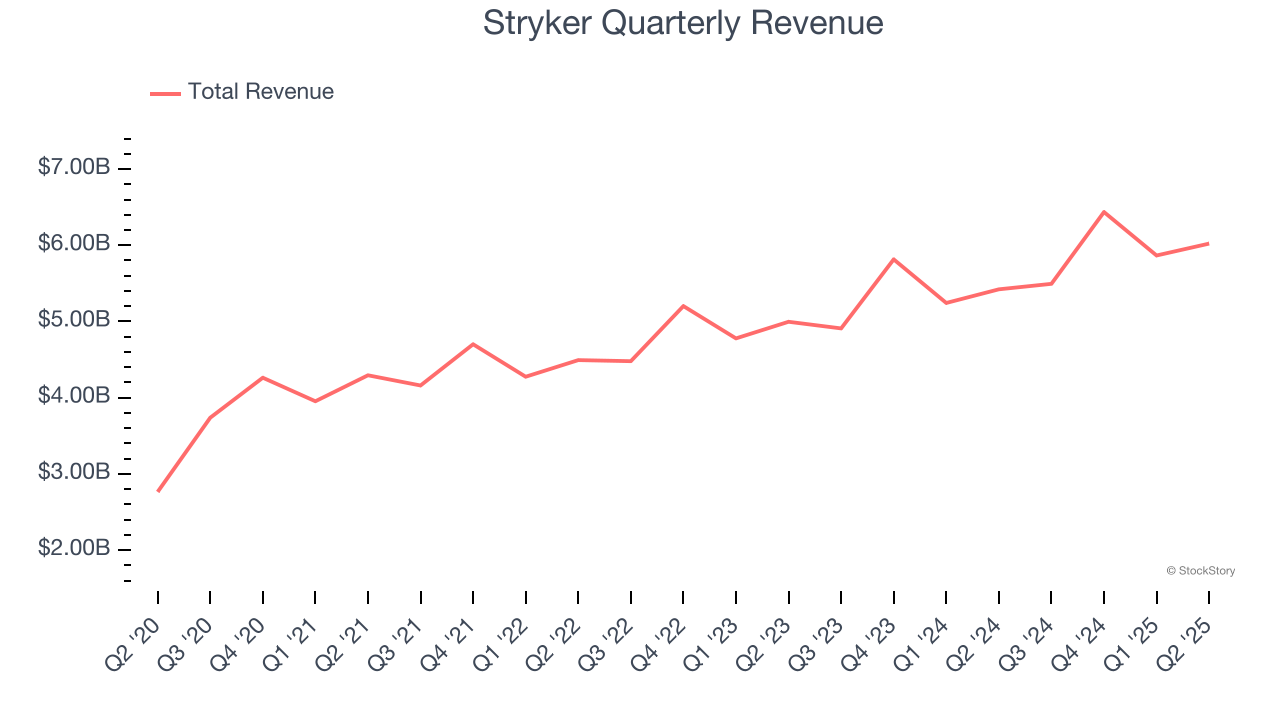
Medical technology company Stryker (NYSE: SYK) reported Q2 CY2025 results topping the market’s revenue expectations, with sales up 11.1% year on year to $6.02 billion. Its non-GAAP profit of $3.13 per share was 1.9% above analysts’ consensus estimates.
Is now the time to buy Stryker? Find out by accessing our full research report, it’s free.
Stryker (SYK) Q2 CY2025 Highlights:
- Revenue: $6.02 billion vs analyst estimates of $5.93 billion (11.1% year-on-year growth, 1.6% beat)
- Adjusted EPS: $3.13 vs analyst estimates of $3.07 (1.9% beat)
- Adjusted EBITDA: $1.3 billion vs analyst estimates of $1.61 billion (21.6% margin, 19.2% miss)
- Management raised its full-year Adjusted EPS guidance to $13.50 at the midpoint, a 1.3% increase
- Operating Margin: 18.5%, in line with the same quarter last year
- Free Cash Flow Margin: 15.4%, up from 8.9% in the same quarter last year
- Organic Revenue rose 10.2% year on year (9% in the same quarter last year)
- Market Capitalization: $153 billion
“We again delivered double-digit sales and adjusted earnings per share growth in the second quarter,” said Kevin A. Lobo, Chair and CEO.
Company Overview
With over 150 million patients impacted annually through its innovative healthcare technologies, Stryker (NYSE: SYK) develops and manufactures advanced medical devices and equipment across orthopedics, surgical tools, neurotechnology, and patient care solutions.
Revenue Growth
A company’s long-term sales performance is one signal of its overall quality. Any business can have short-term success, but a top-tier one grows for years. Over the last five years, Stryker grew its sales at a decent 11.1% compounded annual growth rate. Its growth was slightly above the average healthcare company and shows its offerings resonate with customers.
We at StockStory place the most emphasis on long-term growth, but within healthcare, a half-decade historical view may miss recent innovations or disruptive industry trends. Stryker’s annualized revenue growth of 10.6% over the last two years aligns with its five-year trend, suggesting its demand was stable. 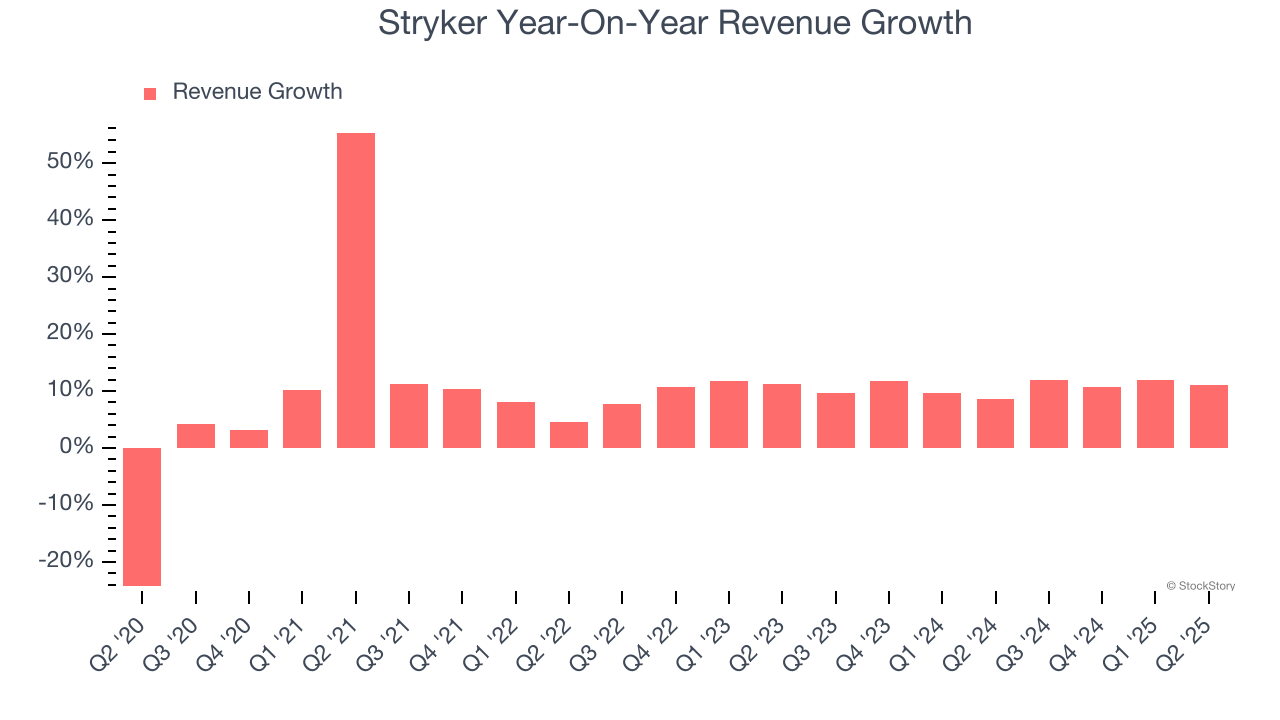
Stryker also reports organic revenue, which strips out one-time events like acquisitions and currency fluctuations that don’t accurately reflect its fundamentals. Over the last two years, Stryker’s organic revenue averaged 10.2% year-on-year growth. Because this number aligns with its two-year revenue growth, we can see the company’s core operations (not acquisitions and divestitures) drove most of its results. 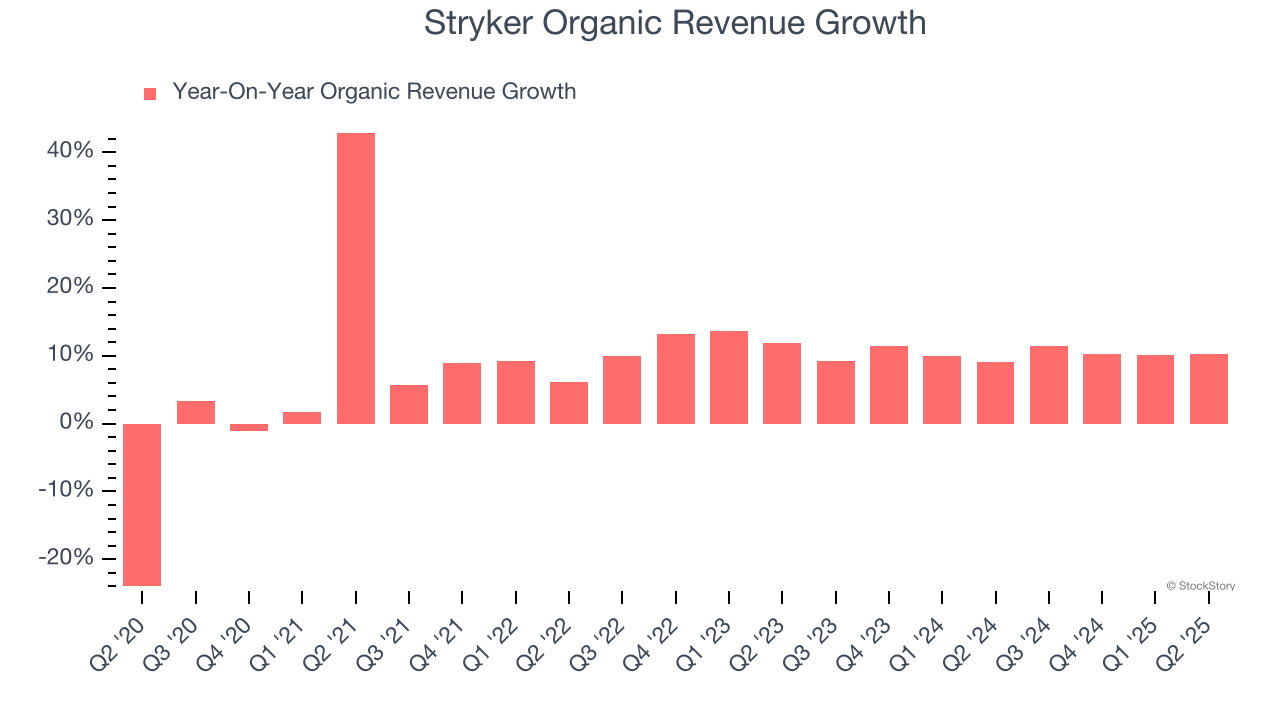
This quarter, Stryker reported year-on-year revenue growth of 11.1%, and its $6.02 billion of revenue exceeded Wall Street’s estimates by 1.6%.
Looking ahead, sell-side analysts expect revenue to grow 8% over the next 12 months, a slight deceleration versus the last two years. We still think its growth trajectory is attractive given its scale and indicates the market is baking in success for its products and services.
Today’s young investors won’t have read the timeless lessons in Gorilla Game: Picking Winners In High Technology because it was written more than 20 years ago when Microsoft and Apple were first establishing their supremacy. But if we apply the same principles, then enterprise software stocks leveraging their own generative AI capabilities may well be the Gorillas of the future. So, in that spirit, we are excited to present our Special Free Report on a profitable, fast-growing enterprise software stock that is already riding the automation wave and looking to catch the generative AI next.
Operating Margin
Stryker has managed its cost base well over the last five years. It demonstrated solid profitability for a healthcare business, producing an average operating margin of 16.8%.
Looking at the trend in its profitability, Stryker’s operating margin decreased by 2 percentage points over the last five years. The company’s two-year trajectory also shows it failed to get its profitability back to the peak as its margin fell by 1.9 percentage points. We still like Stryker but would like to see some improvement in the future.
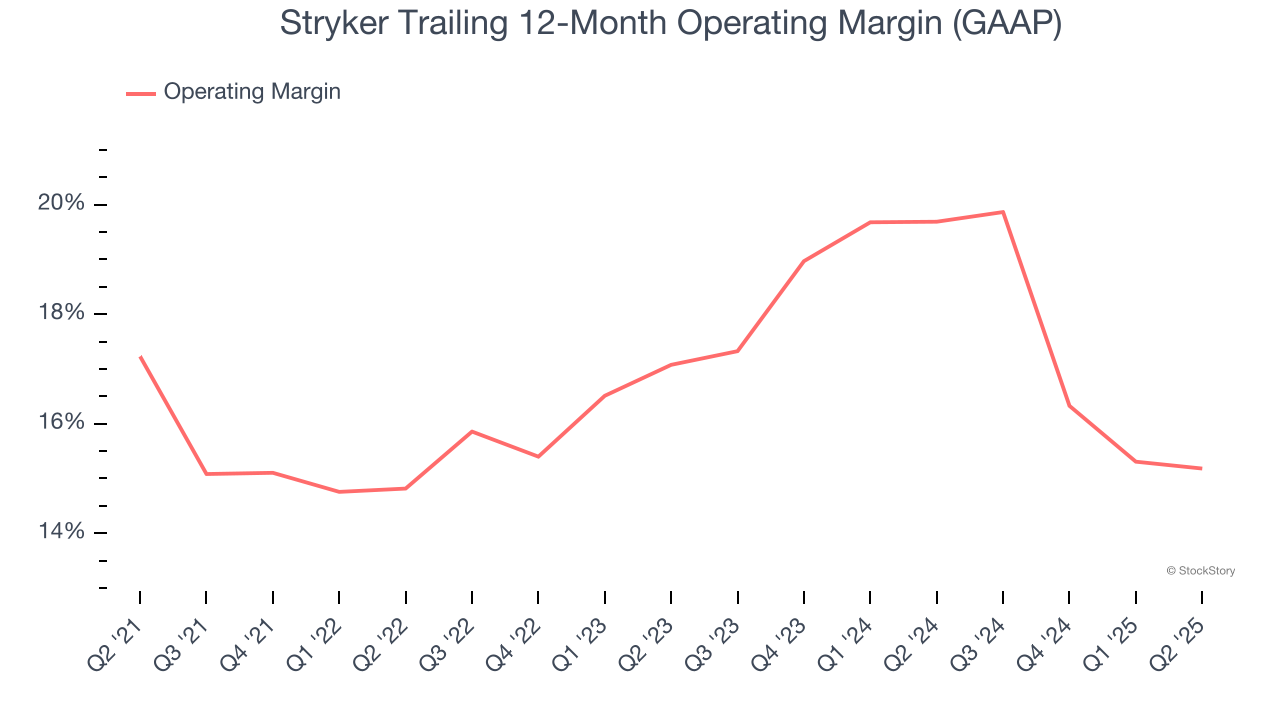
This quarter, Stryker generated an operating margin profit margin of 18.5%, in line with the same quarter last year. This indicates the company’s overall cost structure has been relatively stable.
Earnings Per Share
Revenue trends explain a company’s historical growth, but the long-term change in earnings per share (EPS) points to the profitability of that growth – for example, a company could inflate its sales through excessive spending on advertising and promotions.
Stryker’s EPS grew at a spectacular 13.3% compounded annual growth rate over the last five years, higher than its 11.1% annualized revenue growth. This tells us the company became more profitable on a per-share basis as it expanded.
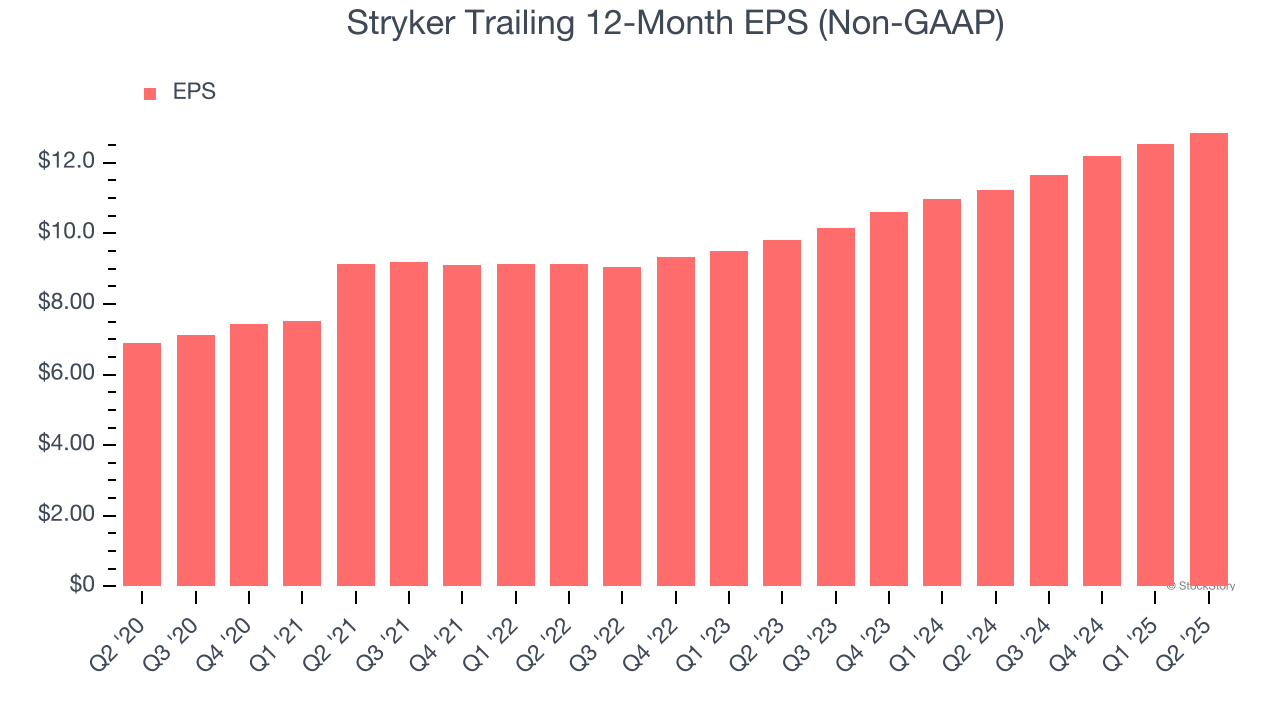
In Q2, Stryker reported adjusted EPS at $3.13, up from $2.81 in the same quarter last year. This print beat analysts’ estimates by 1.9%. Over the next 12 months, Wall Street expects Stryker’s full-year EPS of $12.85 to grow 8.8%.
Key Takeaways from Stryker’s Q2 Results
We enjoyed seeing Stryker beat analysts’ organic revenue expectations this quarter. We were also happy its revenue outperformed Wall Street’s estimates. Overall, we think this was a solid quarter with some key areas of upside. Investors were likely hoping for more, and shares traded down 5.2% to $373.85 immediately following the results.
So should you invest in Stryker right now? The latest quarter does matter, but not nearly as much as longer-term fundamentals and valuation, when deciding if the stock is a buy. We cover that in our actionable full research report which you can read here, it’s free.


