
Building products installation services company Installed Building Products (NYSE: IBP) reported Q1 CY2025 results topping the market’s revenue expectations, but sales fell by 1.2% year on year to $684.8 million. Its non-GAAP profit of $2.08 per share was 5.5% below analysts’ consensus estimates.
Is now the time to buy Installed Building Products? Find out by accessing our full research report, it’s free.
Installed Building Products (IBP) Q1 CY2025 Highlights:
- Revenue: $684.8 million vs analyst estimates of $674.4 million (1.2% year-on-year decline, 1.5% beat)
- Adjusted EPS: $2.08 vs analyst expectations of $2.20 (5.5% miss)
- Adjusted EBITDA: $102.4 million vs analyst estimates of $107.6 million (15% margin, 4.9% miss)
- Operating Margin: 10.2%, down from 12.7% in the same quarter last year
- Free Cash Flow Margin: 10.5%, up from 9.1% in the same quarter last year
- Market Capitalization: $4.53 billion
“IBP delivered solid first quarter financial results, reflecting our focus on maintaining a high level of installation service for our customers across the U.S. In the first quarter, our core homebuilding customers continued to navigate industry-wide housing affordability challenges and a slower-than-expected spring selling season. While we expect housing demand to remain connected to changes in affordability and the macroeconomic backdrop this year, we believe the long-term opportunities across our residential and commercial end markets remain attractive,” stated Jeff Edwards, Chairman and Chief Executive Officer.
Company Overview
Founded in 1977, Installed Building Products (NYSE: IBP) is a company specializing in the installation of insulation, waterproofing, and other complementary building products for residential and commercial construction.
Sales Growth
A company’s long-term performance is an indicator of its overall quality. Any business can experience short-term success, but top-performing ones enjoy sustained growth for years. Over the last five years, Installed Building Products grew its sales at an excellent 13.4% compounded annual growth rate. Its growth beat the average industrials company and shows its offerings resonate with customers, a helpful starting point for our analysis.
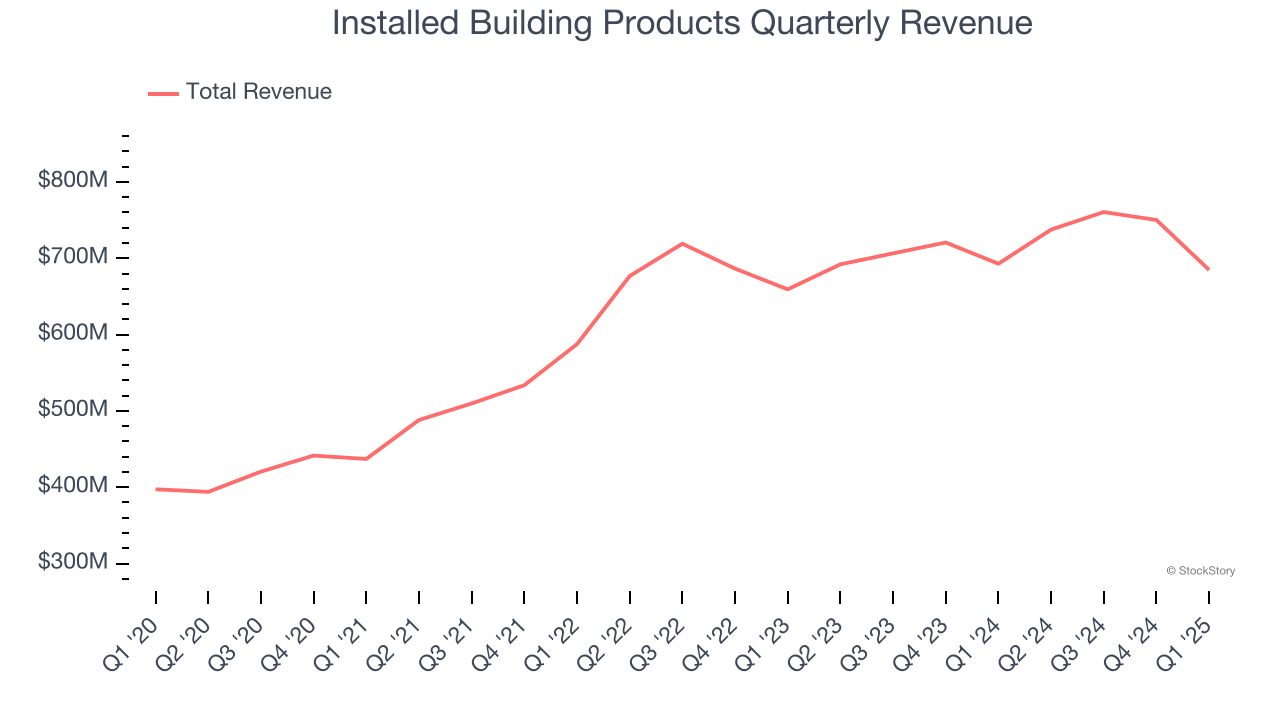
Long-term growth is the most important, but within industrials, a half-decade historical view may miss new industry trends or demand cycles. Installed Building Products’s recent performance shows its demand has slowed significantly as its annualized revenue growth of 3.4% over the last two years was well below its five-year trend. 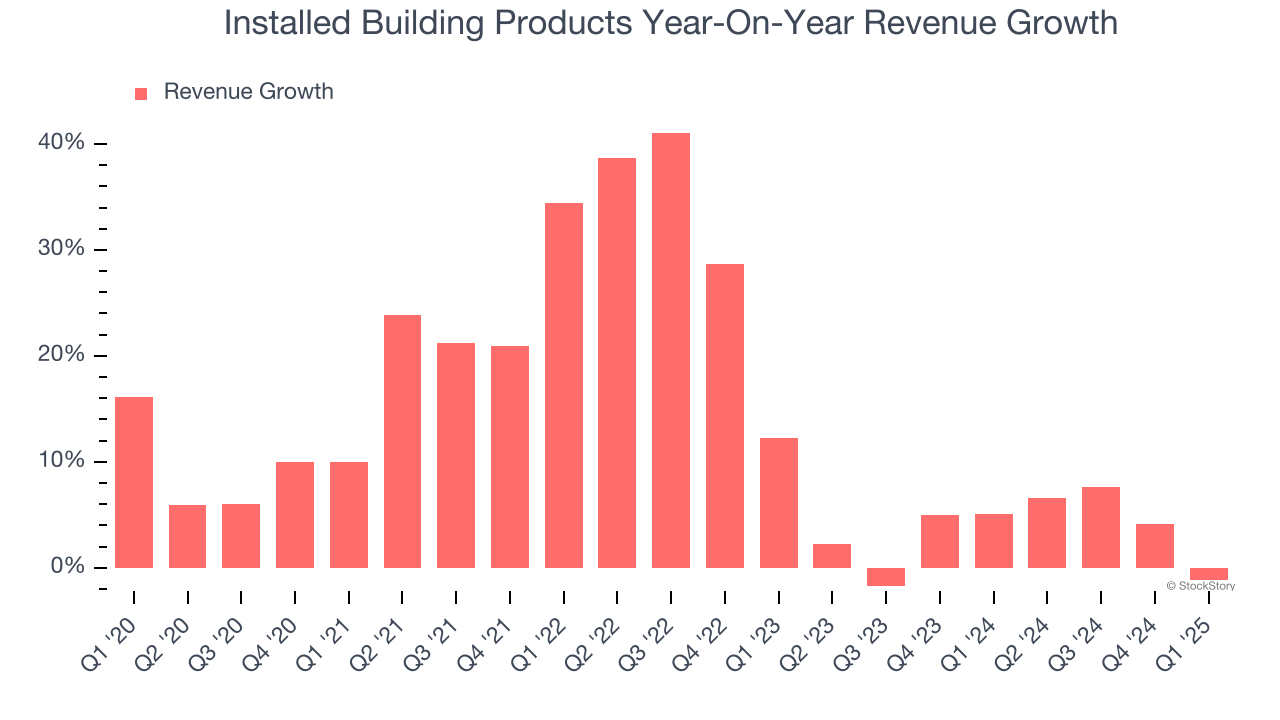
This quarter, Installed Building Products’s revenue fell by 1.2% year on year to $684.8 million but beat Wall Street’s estimates by 1.5%.
Looking ahead, sell-side analysts expect revenue to remain flat over the next 12 months, a deceleration versus the last two years. This projection is underwhelming and implies its products and services will see some demand headwinds. At least the company is tracking well in other measures of financial health.
Here at StockStory, we certainly understand the potential of thematic investing. Diverse winners from Microsoft (MSFT) to Alphabet (GOOG), Coca-Cola (KO) to Monster Beverage (MNST) could all have been identified as promising growth stories with a megatrend driving the growth. So, in that spirit, we’ve identified a relatively under-the-radar profitable growth stock benefiting from the rise of AI, available to you FREE via this link.
Operating Margin
Installed Building Products has been an efficient company over the last five years. It was one of the more profitable businesses in the industrials sector, boasting an average operating margin of 12.1%.
Analyzing the trend in its profitability, Installed Building Products’s operating margin rose by 2.7 percentage points over the last five years, as its sales growth gave it operating leverage.
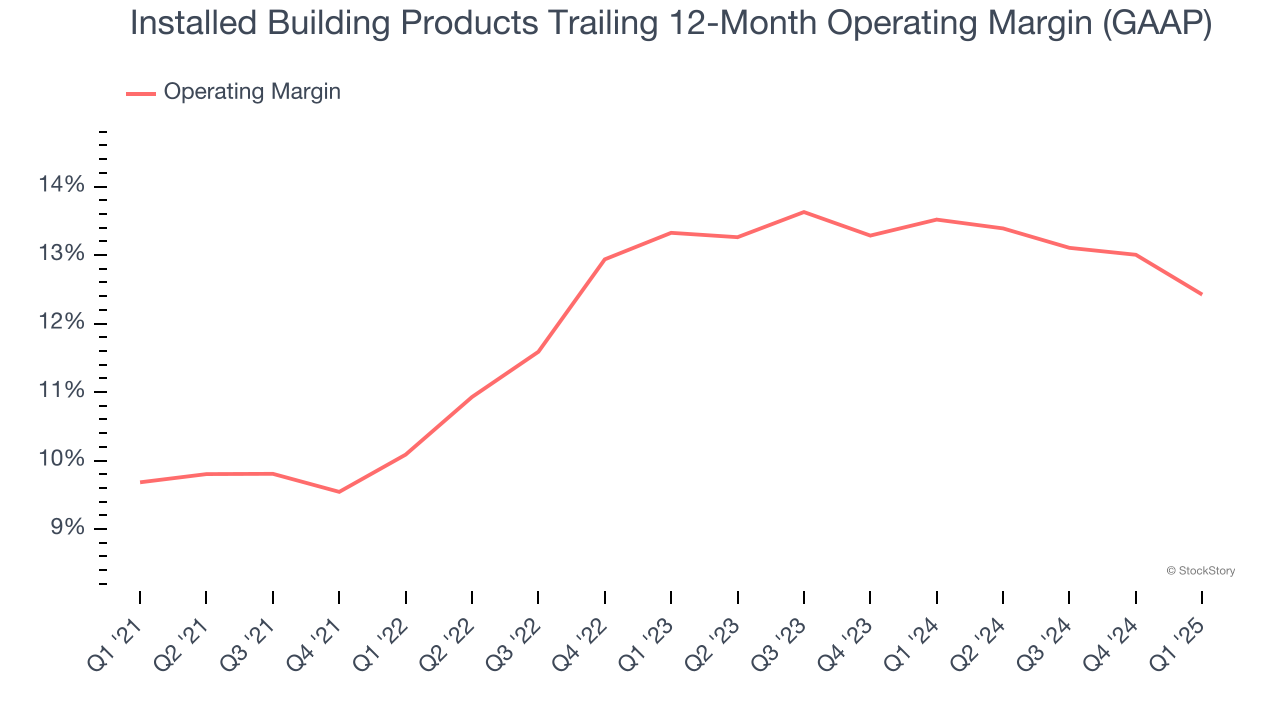
This quarter, Installed Building Products generated an operating profit margin of 10.2%, down 2.5 percentage points year on year. Since Installed Building Products’s operating margin decreased more than its gross margin, we can assume it was less efficient because expenses such as marketing, R&D, and administrative overhead increased.
Earnings Per Share
We track the long-term change in earnings per share (EPS) for the same reason as long-term revenue growth. Compared to revenue, however, EPS highlights whether a company’s growth is profitable.
Installed Building Products’s EPS grew at an astounding 24.5% compounded annual growth rate over the last five years, higher than its 13.4% annualized revenue growth. This tells us the company became more profitable on a per-share basis as it expanded.
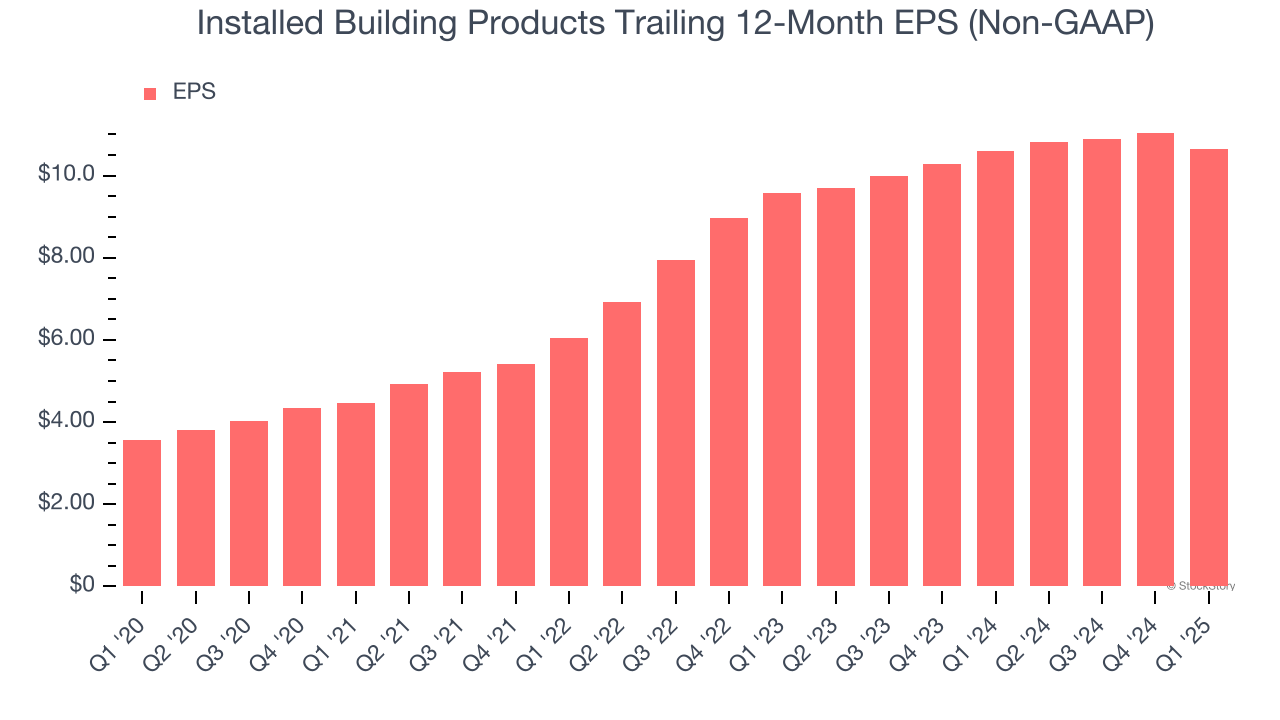
Diving into the nuances of Installed Building Products’s earnings can give us a better understanding of its performance. As we mentioned earlier, Installed Building Products’s operating margin declined this quarter but expanded by 2.7 percentage points over the last five years. Its share count also shrank by 7.5%, and these factors together are positive signs for shareholders because improving profitability and share buybacks turbocharge EPS growth relative to revenue growth. 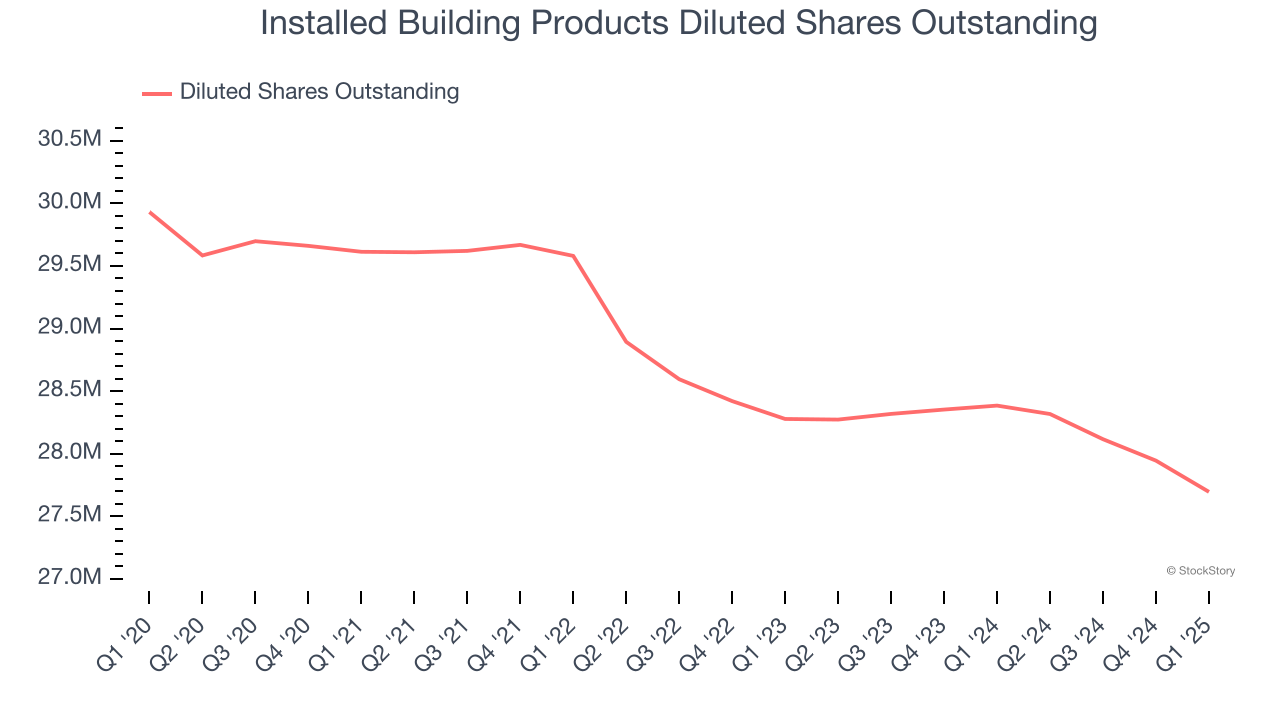
Like with revenue, we analyze EPS over a shorter period to see if we are missing a change in the business.
For Installed Building Products, its two-year annual EPS growth of 5.5% was lower than its five-year trend. This wasn’t great, but at least the company was successful in other measures of financial health.
In Q1, Installed Building Products reported EPS at $2.08, down from $2.47 in the same quarter last year. This print missed analysts’ estimates, but we care more about long-term EPS growth than short-term movements. Over the next 12 months, Wall Street expects Installed Building Products’s full-year EPS of $10.65 to stay about the same.
Key Takeaways from Installed Building Products’s Q1 Results
It was encouraging to see Installed Building Products beat analysts’ revenue expectations this quarter. On the other hand, its EPS missed significantly and its EBITDA fell short of Wall Street’s estimates. Overall, this quarter could have been better. The stock remained flat at $164.49 immediately following the results.
Is Installed Building Products an attractive investment opportunity at the current price? The latest quarter does matter, but not nearly as much as longer-term fundamentals and valuation, when deciding if the stock is a buy. We cover that in our actionable full research report which you can read here, it’s free.