

School bus company Blue Bird (NASDAQ: BLBD) reported revenue ahead of Wall Street’s expectations in Q1 CY2025, with sales up 3.7% year on year to $358.9 million. The company’s full-year revenue guidance of $1.45 billion at the midpoint came in 0.9% above analysts’ estimates. Its non-GAAP profit of $0.96 per share was in line with analysts’ consensus estimates.
Is now the time to buy Blue Bird? Find out by accessing our full research report, it’s free.
Blue Bird (BLBD) Q1 CY2025 Highlights:
- Revenue: $358.9 million vs analyst estimates of $356.8 million (3.7% year-on-year growth, 0.6% beat)
- Adjusted EPS: $0.96 vs analyst estimates of $0.95 (in line)
- Adjusted EBITDA: $49.21 million vs analyst estimates of $47.31 million (13.7% margin, 4% beat)
- The company reconfirmed its revenue guidance for the full year of $1.45 billion at the midpoint
- EBITDA guidance for the full year is $200 million at the midpoint, above analyst estimates of $197.9 million
- Operating Margin: 9.4%, down from 10.4% in the same quarter last year
- Free Cash Flow Margin: 5.2%, down from 15% in the same quarter last year
- Sales Volumes rose 1.8% year on year (-2.2% in the same quarter last year)
- Market Capitalization: $1.23 billion
“I am incredibly proud of our team in delivering another outstanding result, achieving a new all-time quarterly record revenue and profit,” said John Wyskiel, President & CEO of Blue Bird Corporation.
Company Overview
With around a century of experience, Blue Bird (NASDAQ: BLBD) is a manufacturer of school buses and complementary parts.
Sales Growth
Reviewing a company’s long-term sales performance reveals insights into its quality. Any business can have short-term success, but a top-tier one grows for years. Regrettably, Blue Bird’s sales grew at a tepid 5% compounded annual growth rate over the last five years. This wasn’t a great result compared to the rest of the industrials sector, but there are still things to like about Blue Bird.
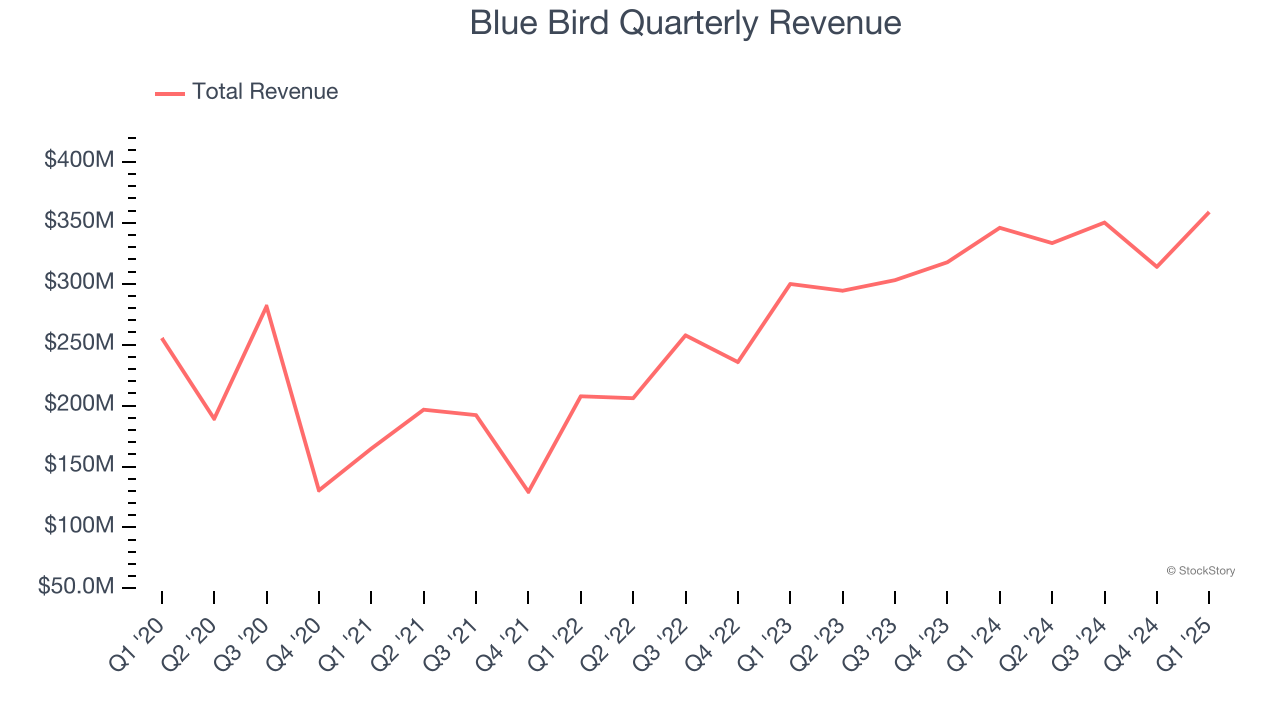
We at StockStory place the most emphasis on long-term growth, but within industrials, a half-decade historical view may miss cycles, industry trends, or a company capitalizing on catalysts such as a new contract win or a successful product line. Blue Bird’s annualized revenue growth of 16.5% over the last two years is above its five-year trend, suggesting its demand recently accelerated. 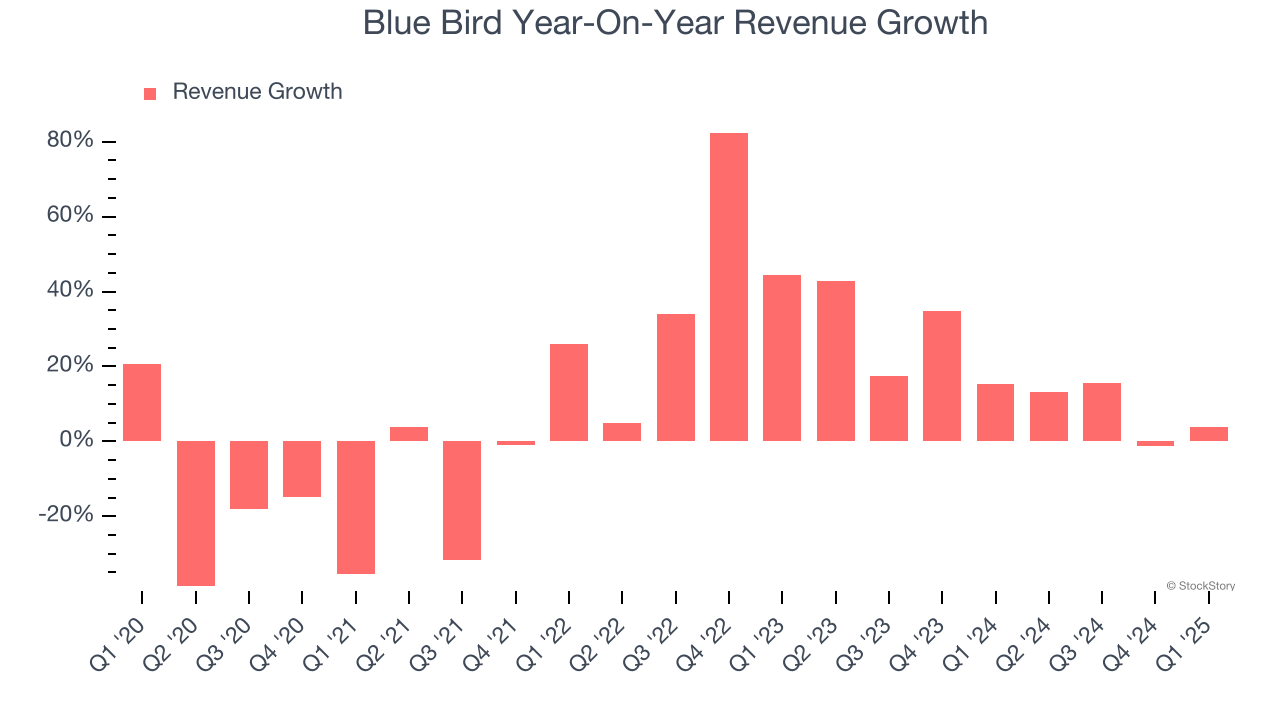
We can dig further into the company’s revenue dynamics by analyzing its number of units sold, which reached 2,295 in the latest quarter. Over the last two years, Blue Bird’s units sold averaged 6.8% year-on-year growth. Because this number is lower than its revenue growth, we can see the company benefited from price increases. 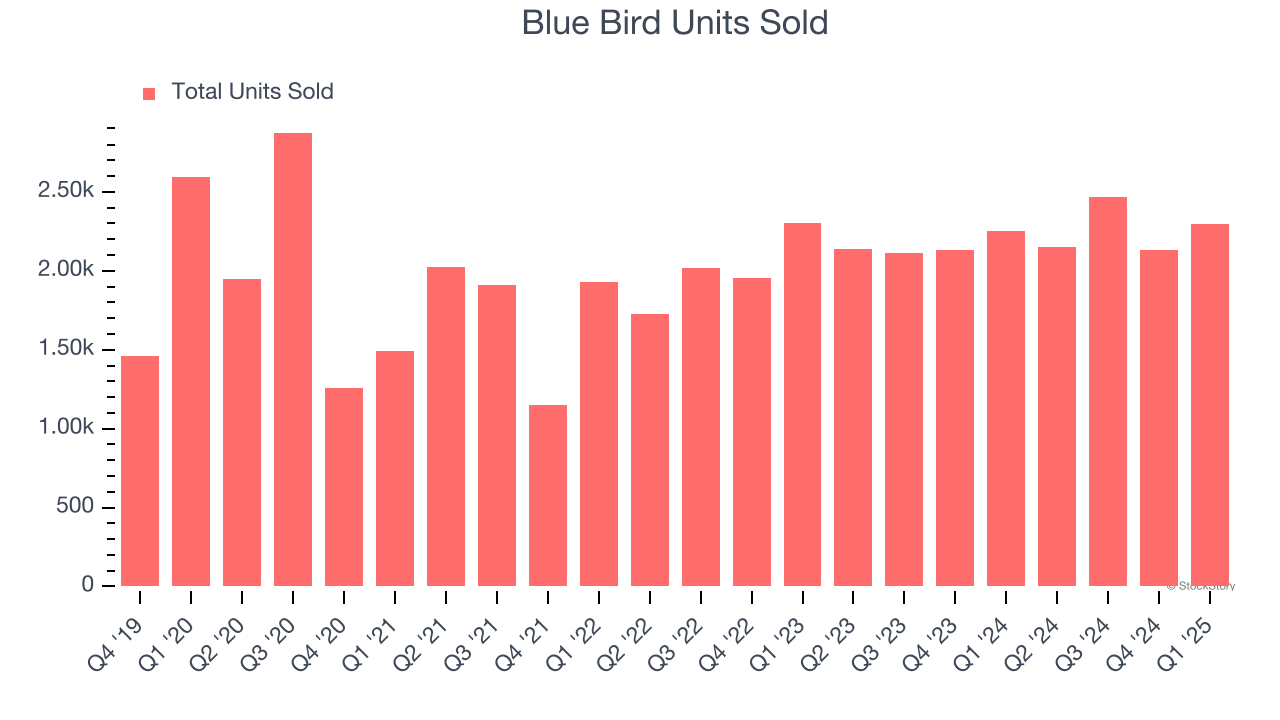
This quarter, Blue Bird reported modest year-on-year revenue growth of 3.7% but beat Wall Street’s estimates by 0.6%.
Looking ahead, sell-side analysts expect revenue to grow 9.4% over the next 12 months, a deceleration versus the last two years. Despite the slowdown, this projection is healthy and suggests the market sees success for its products and services.
Today’s young investors won’t have read the timeless lessons in Gorilla Game: Picking Winners In High Technology because it was written more than 20 years ago when Microsoft and Apple were first establishing their supremacy. But if we apply the same principles, then enterprise software stocks leveraging their own generative AI capabilities may well be the Gorillas of the future. So, in that spirit, we are excited to present our Special Free Report on a profitable, fast-growing enterprise software stock that is already riding the automation wave and looking to catch the generative AI next.
Operating Margin
Operating margin is an important measure of profitability as it shows the portion of revenue left after accounting for all core expenses – everything from the cost of goods sold to advertising and wages. It’s also useful for comparing profitability across companies with different levels of debt and tax rates because it excludes interest and taxes.
Blue Bird was profitable over the last five years but held back by its large cost base. Its average operating margin of 4.7% was weak for an industrials business. This result isn’t too surprising given its low gross margin as a starting point.
On the plus side, Blue Bird’s operating margin rose by 7.4 percentage points over the last five years, as its sales growth gave it operating leverage.
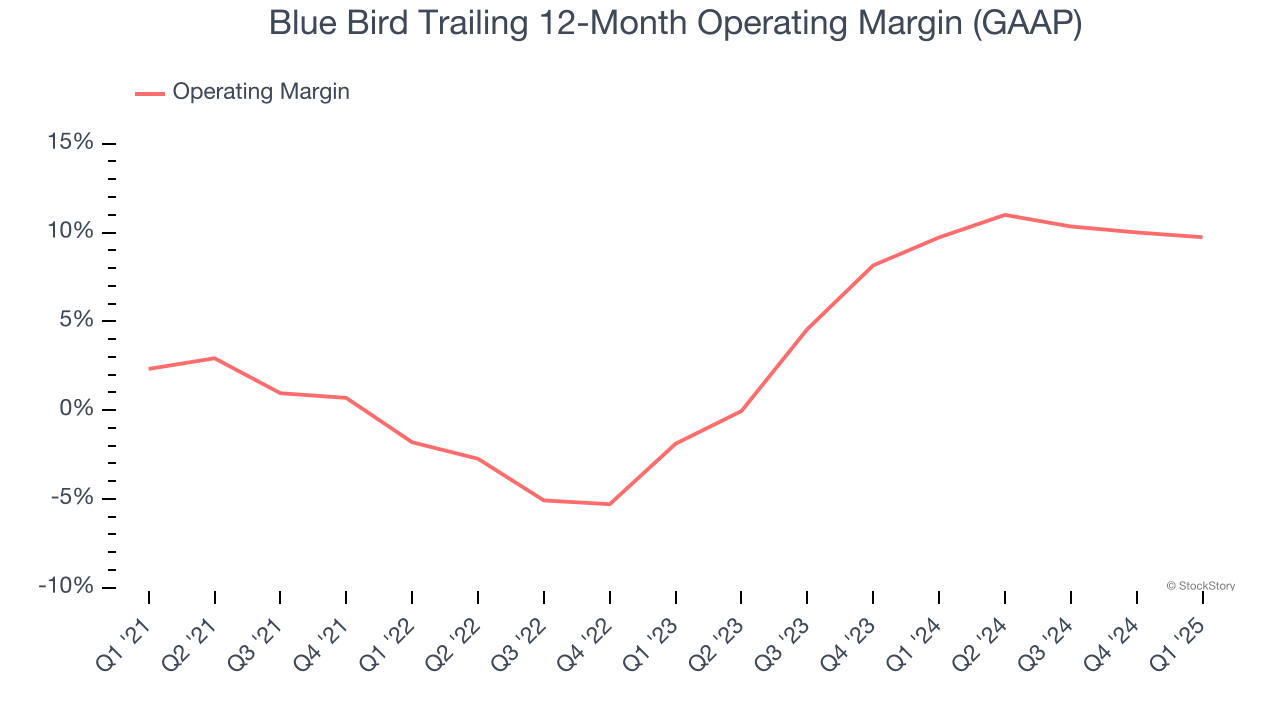
This quarter, Blue Bird generated an operating profit margin of 9.4%, down 1 percentage points year on year. Conversely, its revenue and gross margin actually rose, so we can assume it was less efficient because its operating expenses like marketing, R&D, and administrative overhead grew faster than its revenue.
Earnings Per Share
Revenue trends explain a company’s historical growth, but the long-term change in earnings per share (EPS) points to the profitability of that growth – for example, a company could inflate its sales through excessive spending on advertising and promotions.
Blue Bird’s EPS grew at a spectacular 17.3% compounded annual growth rate over the last five years, higher than its 5% annualized revenue growth. This tells us the company became more profitable on a per-share basis as it expanded.
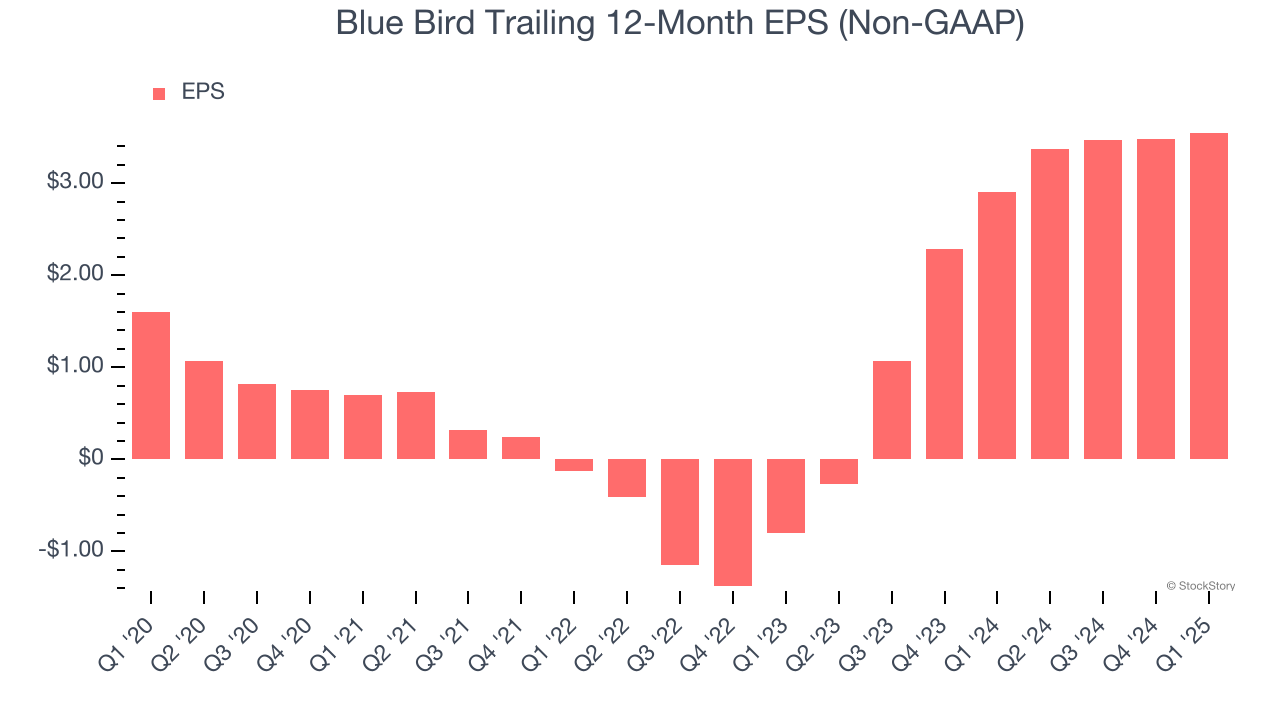
Diving into the nuances of Blue Bird’s earnings can give us a better understanding of its performance. As we mentioned earlier, Blue Bird’s operating margin declined this quarter but expanded by 7.4 percentage points over the last five years. This was the most relevant factor (aside from the revenue impact) behind its higher earnings; taxes and interest expenses can also affect EPS but don’t tell us as much about a company’s fundamentals.
Like with revenue, we analyze EPS over a more recent period because it can provide insight into an emerging theme or development for the business.
For Blue Bird, its two-year annual EPS growth of 154% was higher than its five-year trend. We love it when earnings growth accelerates, especially when it accelerates off an already high base.
In Q1, Blue Bird reported EPS at $0.96, up from $0.89 in the same quarter last year. This print was close to analysts’ estimates. Over the next 12 months, Wall Street expects Blue Bird’s full-year EPS of $3.55 to grow 19.9%.
Key Takeaways from Blue Bird’s Q1 Results
We enjoyed seeing Blue Bird beat analysts’ revenue, EPS, and EBITDA expectations this quarter. We were also glad its full-year EBITDA guidance slightly exceeded Wall Street’s estimates. Overall, this print had some key positives. The stock remained flat at $37.50 immediately following the results.
Big picture, is Blue Bird a buy here and now? When making that decision, it’s important to consider its valuation, business qualities, as well as what has happened in the latest quarter. We cover that in our actionable full research report which you can read here, it’s free.


