
Biopharma company Corcept Therapeutics (NASDAQ: CORT) missed Wall Street’s revenue expectations in Q1 CY2025, but sales rose 7.1% year on year to $157.2 million. On the other hand, the company’s full-year revenue guidance of $925 million at the midpoint came in 2.2% above analysts’ estimates. Its GAAP profit of $0.17 per share was 20.8% above analysts’ consensus estimates.
Is now the time to buy Corcept? Find out by accessing our full research report, it’s free.
Corcept (CORT) Q1 CY2025 Highlights:
- Revenue: $157.2 million vs analyst estimates of $177.9 million (7.1% year-on-year growth, 11.6% miss)
- EPS (GAAP): $0.17 vs analyst estimates of $0.14 (20.8% beat)
- The company reconfirmed its revenue guidance for the full year of $925 million at the midpoint
- Operating Margin: 2.2%, down from 20.1% in the same quarter last year
- Market Capitalization: $7.72 billion
Company Overview
Focusing on the powerful stress hormone that affects everything from metabolism to immune function, Corcept Therapeutics (NASDAQ: CORT) develops and markets medications that modulate cortisol to treat endocrine disorders, cancer, and neurological diseases.
Sales Growth
A company’s long-term performance is an indicator of its overall quality. Any business can put up a good quarter or two, but many enduring ones grow for years. Luckily, Corcept’s sales grew at a solid 15.4% compounded annual growth rate over the last five years. Its growth beat the average healthcare company and shows its offerings resonate with customers.
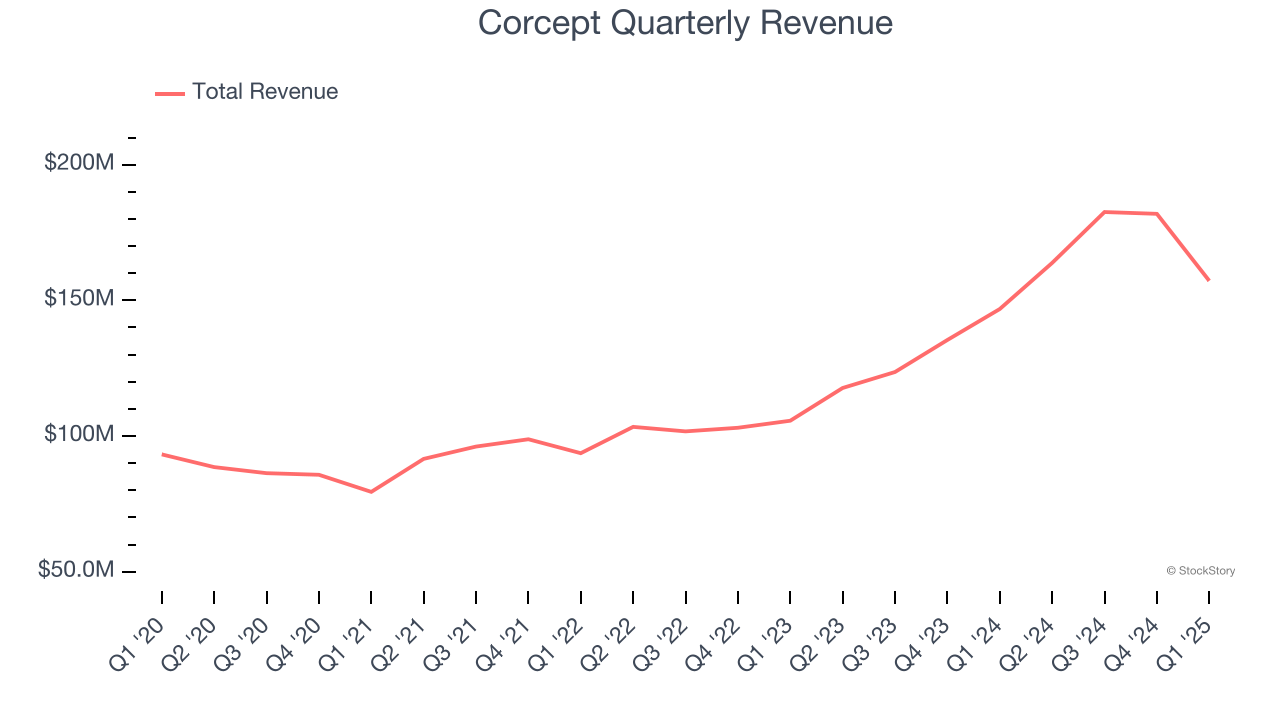
Long-term growth is the most important, but within healthcare, a half-decade historical view may miss new innovations or demand cycles. Corcept’s annualized revenue growth of 28.7% over the last two years is above its five-year trend, suggesting its demand was strong and recently accelerated. 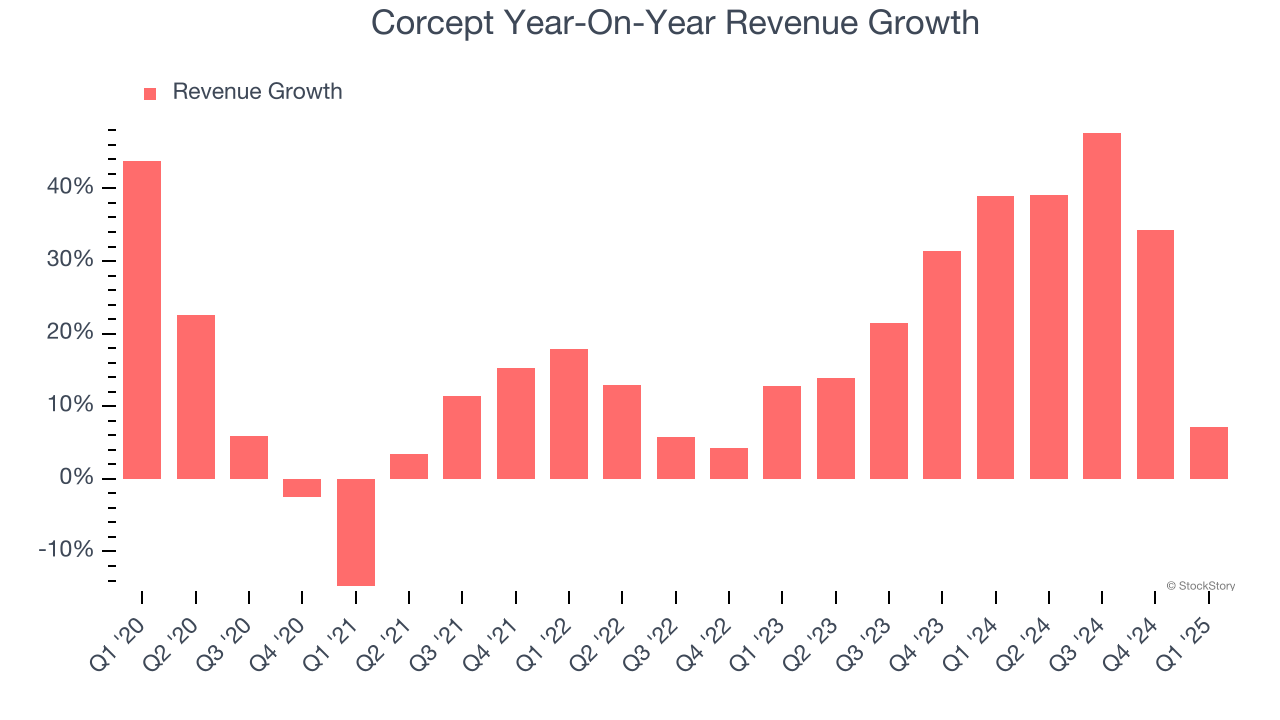
This quarter, Corcept’s revenue grew by 7.1% year on year to $157.2 million, missing Wall Street’s estimates.
Looking ahead, sell-side analysts expect revenue to grow 40.6% over the next 12 months, an improvement versus the last two years. This projection is eye-popping and implies its newer products and services will catalyze better top-line performance.
Unless you’ve been living under a rock, it should be obvious by now that generative AI is going to have a huge impact on how large corporations do business. While Nvidia and AMD are trading close to all-time highs, we prefer a lesser-known (but still profitable) stock benefiting from the rise of AI. Click here to access our free report one of our favorites growth stories.
Operating Margin
Operating margin is an important measure of profitability as it shows the portion of revenue left after accounting for all core expenses – everything from the cost of goods sold to advertising and wages. It’s also useful for comparing profitability across companies with different levels of debt and tax rates because it excludes interest and taxes.
Corcept has been an efficient company over the last five years. It was one of the more profitable businesses in the healthcare sector, boasting an average operating margin of 24.6%.
Looking at the trend in its profitability, Corcept’s operating margin decreased by 16.2 percentage points over the last five years. The company’s two-year trajectory also shows it failed to get its profitability back to the peak as its margin fell by 8.2 percentage points. This performance was poor no matter how you look at it - it shows its expenses were rising and it couldn’t pass those costs onto its customers.
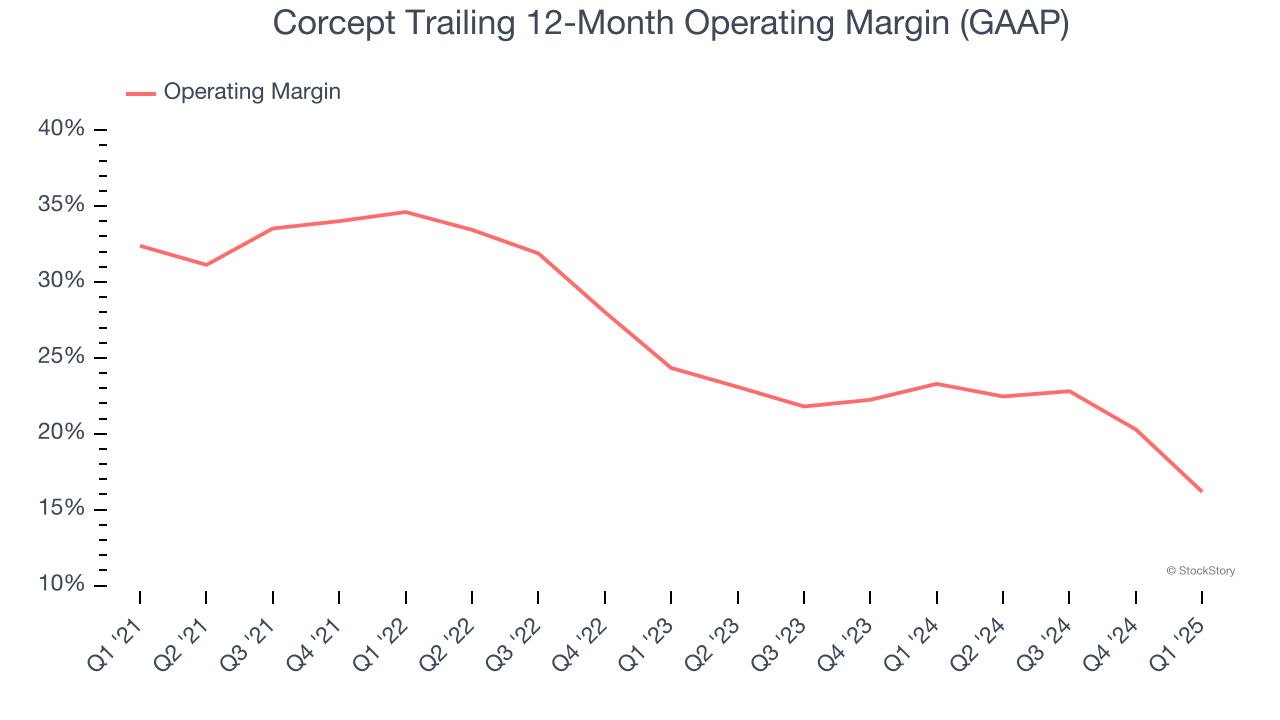
In Q1, Corcept generated an operating profit margin of 2.2%, down 17.9 percentage points year on year. This contraction shows it was less efficient because its expenses grew faster than its revenue.
Earnings Per Share
We track the long-term change in earnings per share (EPS) for the same reason as long-term revenue growth. Compared to revenue, however, EPS highlights whether a company’s growth is profitable.
Corcept’s EPS grew at a decent 6% compounded annual growth rate over the last five years. However, this performance was lower than its 15.4% annualized revenue growth, telling us the company became less profitable on a per-share basis as it expanded due to non-fundamental factors such as interest expenses and taxes.
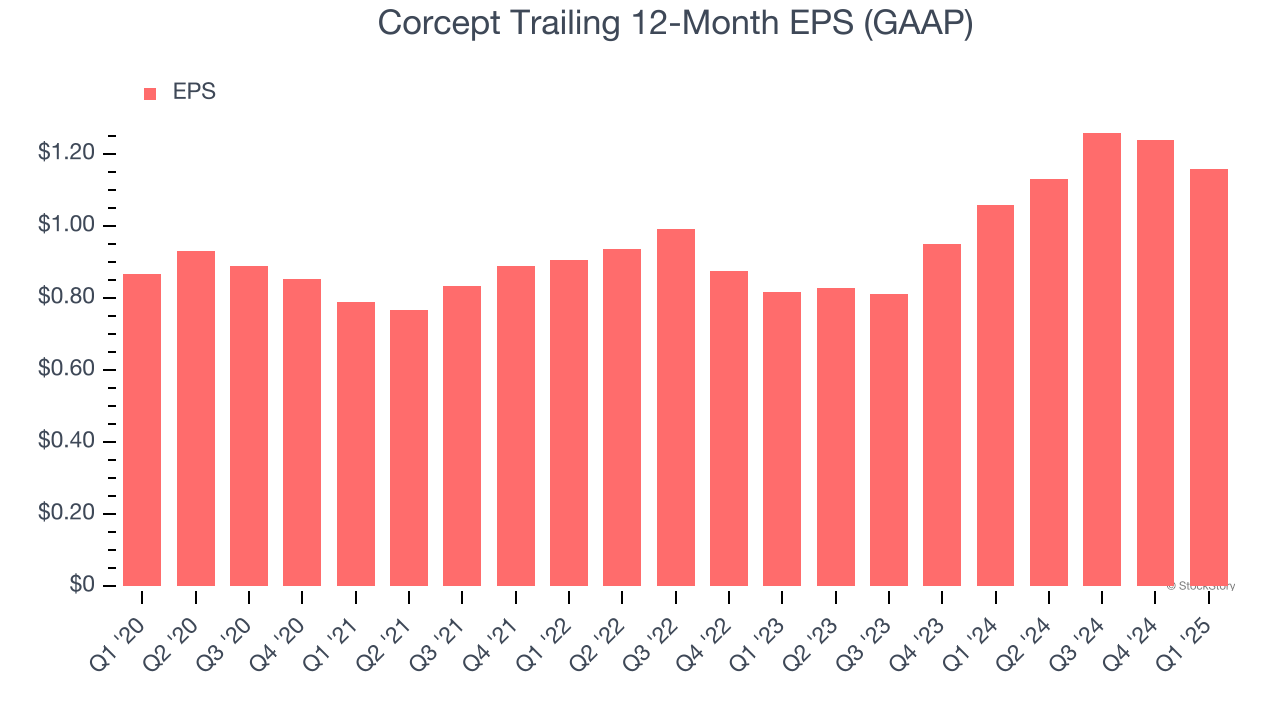
We can take a deeper look into Corcept’s earnings to better understand the drivers of its performance. As we mentioned earlier, Corcept’s operating margin declined by 16.2 percentage points over the last five years. This was the most relevant factor (aside from the revenue impact) behind its lower earnings; taxes and interest expenses can also affect EPS but don’t tell us as much about a company’s fundamentals.
In Q1, Corcept reported EPS at $0.17, down from $0.25 in the same quarter last year. Despite falling year on year, this print easily cleared analysts’ estimates. Over the next 12 months, Wall Street expects Corcept’s full-year EPS of $1.16 to grow 80.9%.
Key Takeaways from Corcept’s Q1 Results
The defining feature this quarter was that revenue missed significantly. While EPS managed to beat and the company reiterated full-year revenue guidance, it was not enough for the market. The stock traded down 8.3% to $67.96 immediately after reporting.
Is Corcept an attractive investment opportunity at the current price? What happened in the latest quarter matters, but not as much as longer-term business quality and valuation, when deciding whether to invest in this stock. We cover that in our actionable full research report which you can read here, it’s free.