
Over the last six months, Universal Display shares have sunk to $143.91, producing a disappointing 16.6% loss - worse than the S&P 500’s 5.5% drop. This may have investors wondering how to approach the situation.
Is now the time to buy Universal Display, or should you be careful about including it in your portfolio? Get the full stock story straight from our expert analysts, it’s free.
Why Is Universal Display Not Exciting?
Even though the stock has become cheaper, we're swiping left on Universal Display for now. Here are three reasons why there are better opportunities than OLED and a stock we'd rather own.
1. Lackluster Revenue Growth
Long-term growth is the most important, but short-term results matter for semiconductors because the rapid pace of technological innovation (Moore's Law) could make yesterday's hit product obsolete today. Universal Display’s recent performance shows its demand has slowed as its annualized revenue growth of 4.3% over the last two years was below its five-year trend. 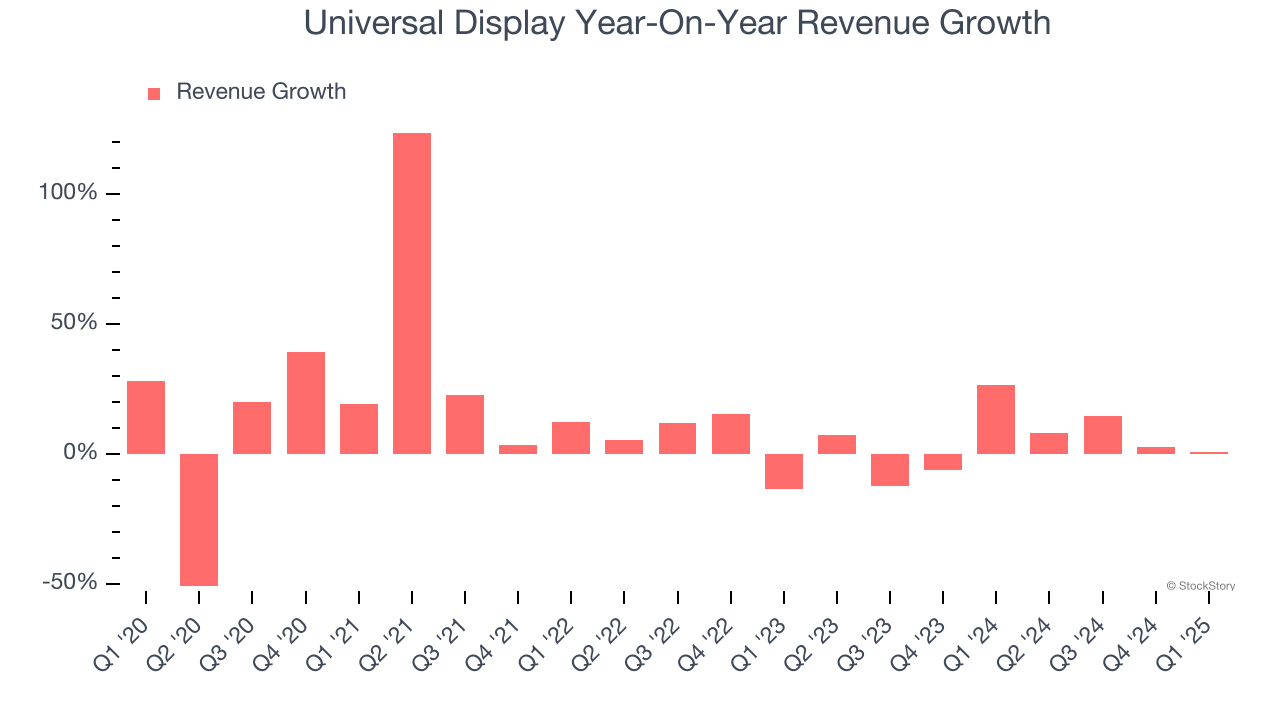
2. Projected Revenue Growth Is Slim
Forecasted revenues by Wall Street analysts signal a company’s potential. Predictions may not always be accurate, but accelerating growth typically boosts valuation multiples and stock prices while slowing growth does the opposite.
Over the next 12 months, sell-side analysts expect Universal Display’s revenue to rise by 4.2%, close to its 4.3% annualized growth for the past two years. This projection doesn't excite us and suggests its newer products and services will not catalyze better top-line performance yet.
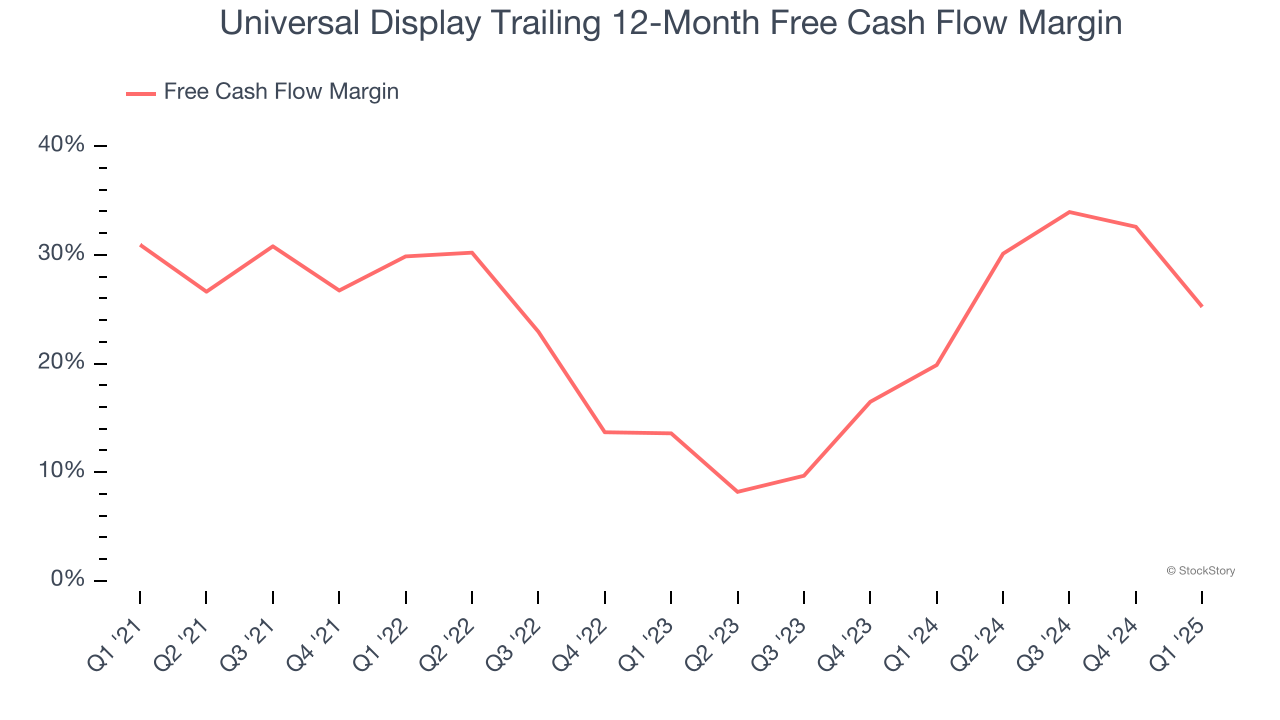
3. Free Cash Flow Margin Dropping
Free cash flow isn't a prominently featured metric in company financials and earnings releases, but we think it's telling because it accounts for all operating and capital expenses, making it tough to manipulate. Cash is king.
As you can see below, Universal Display’s margin dropped by 5.7 percentage points over the last five years. It may have ticked higher more recently, but shareholders are likely hoping for its margin to at least revert to its historical level. If the longer-term trend returns, it could signal increasing investment needs and capital intensity. Universal Display’s free cash flow margin for the trailing 12 months was 25.2%.
Final Judgment
Universal Display isn’t a terrible business, but it doesn’t pass our quality test. Following the recent decline, the stock trades at 31.1× forward EV-to-EBITDA (or $143.91 per share). This valuation is reasonable, but the company’s shakier fundamentals present too much downside risk. We're fairly confident there are better stocks to buy right now. We’d recommend looking at one of our top software and edge computing picks.
Stocks That Overcame Trump’s 2018 Tariffs
Donald Trump’s victory in the 2024 U.S. Presidential Election sent major indices to all-time highs, but stocks have retraced as investors debate the health of the economy and the potential impact of tariffs.
While this leaves much uncertainty around 2025, a few companies are poised for long-term gains regardless of the political or macroeconomic climate, like our Top 9 Market-Beating Stocks. This is a curated list of our High Quality stocks that have generated a market-beating return of 176% over the last five years.
Stocks that made our list in 2020 include now familiar names such as Nvidia (+1,545% between March 2020 and March 2025) as well as under-the-radar businesses like the once-small-cap company Comfort Systems (+782% five-year return). Find your next big winner with StockStory today.


