
Civil infrastructure construction company Sterling Infrastructure (NASDAQ: STRL) reported revenue ahead of Wall Streets expectations in Q3 CY2025, with sales up 16% year on year to $689 million. The company’s full-year revenue guidance of $2.38 billion at the midpoint came in 5.9% above analysts’ estimates. Its non-GAAP profit of $3.48 per share was 22.6% above analysts’ consensus estimates.
Is now the time to buy Sterling? Find out by accessing our full research report, it’s free for active Edge members.
Sterling (STRL) Q3 CY2025 Highlights:
- Revenue: $689 million vs analyst estimates of $618.8 million (16% year-on-year growth, 11.3% beat)
- Adjusted EPS: $3.48 vs analyst estimates of $2.84 (22.6% beat)
- Adjusted EBITDA: $155.8 million vs analyst estimates of $137.6 million (22.6% margin, 13.2% beat)
- The company lifted its revenue guidance for the full year to $2.38 billion at the midpoint from $2.13 billion, a 12.1% increase
- Management raised its full-year Adjusted EPS guidance to $10.43 at the midpoint, a 11.7% increase
- EBITDA guidance for the full year is $488.5 million at the midpoint, above analyst estimates of $462.5 million
- Operating Margin: 18.2%, up from 14.7% in the same quarter last year
- Free Cash Flow Margin: 9.3%, down from 23.3% in the same quarter last year
- Market Capitalization: $11.5 billion
(1) See "Non-GAAP Measures", "Adjusted Net Income Reconciliation", and "EBITDA Reconciliation" sections below for more information.
Company Overview
Involved in the construction of a major highway, the Grand Parkway in Houston, TX, Sterling Infrastructure (NASDAQ: STRL) provides civil infrastructure construction.
Revenue Growth
A company’s long-term sales performance can indicate its overall quality. Even a bad business can shine for one or two quarters, but a top-tier one grows for years. Luckily, Sterling’s sales grew at a solid 9.4% compounded annual growth rate over the last five years. Its growth surpassed the average industrials company and shows its offerings resonate with customers, a great starting point for our analysis.
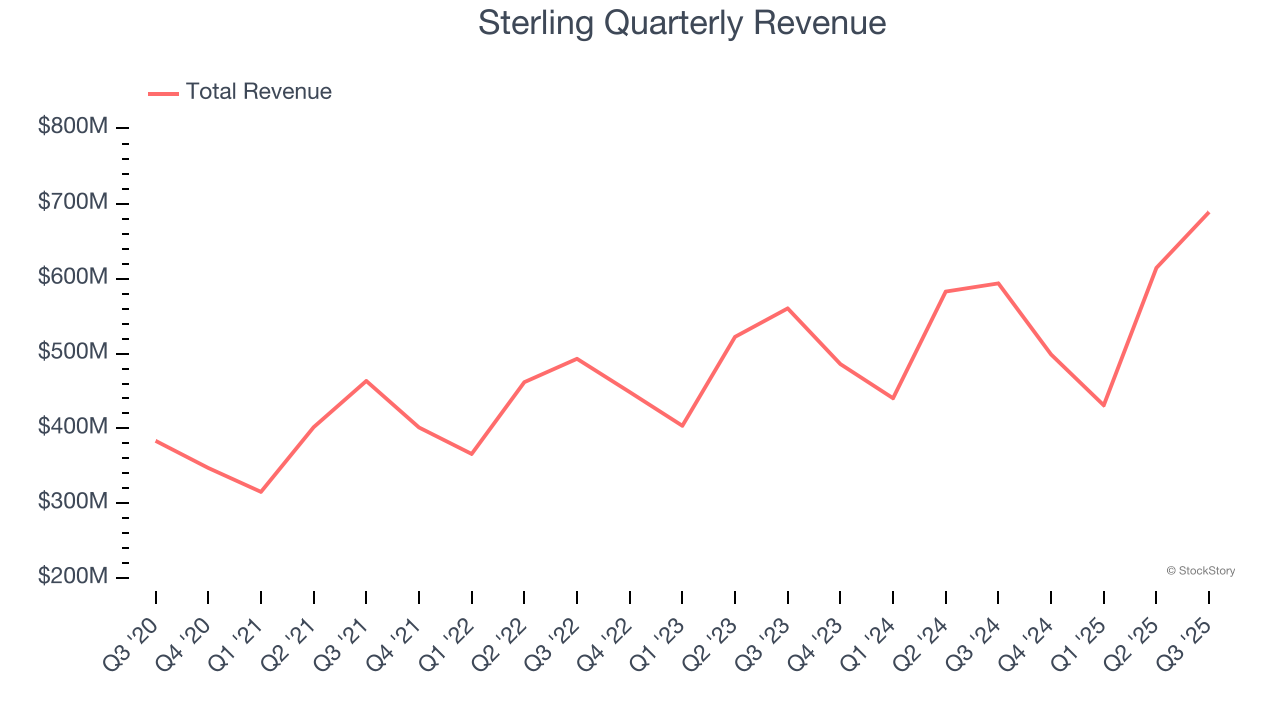
We at StockStory place the most emphasis on long-term growth, but within industrials, a half-decade historical view may miss cycles, industry trends, or a company capitalizing on catalysts such as a new contract win or a successful product line. Sterling’s recent performance shows its demand has slowed as its annualized revenue growth of 7.4% over the last two years was below its five-year trend. 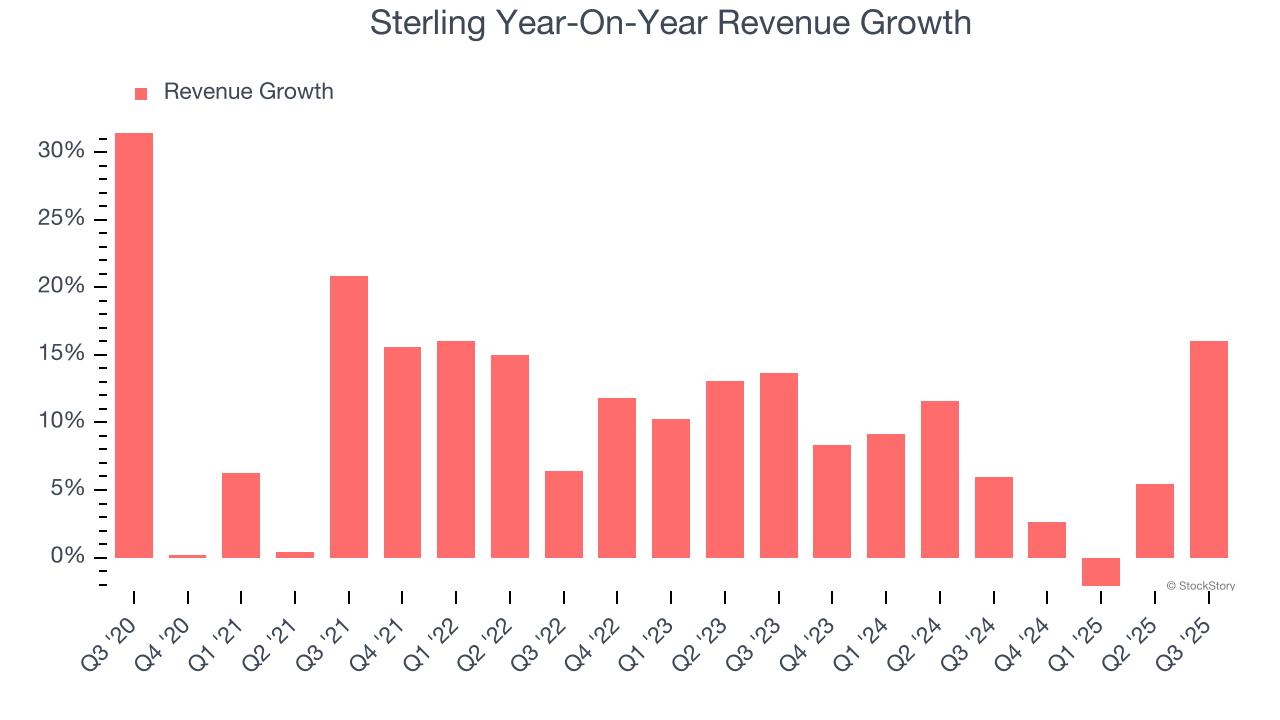
This quarter, Sterling reported year-on-year revenue growth of 16%, and its $689 million of revenue exceeded Wall Street’s estimates by 11.3%.
Looking ahead, sell-side analysts expect revenue to grow 18.3% over the next 12 months, an improvement versus the last two years. This projection is eye-popping and suggests its newer products and services will spur better top-line performance.
Microsoft, Alphabet, Coca-Cola, Monster Beverage—all began as under-the-radar growth stories riding a massive trend. We’ve identified the next one: a profitable AI semiconductor play Wall Street is still overlooking. Go here for access to our full report.
Operating Margin
Operating margin is a key measure of profitability. Think of it as net income - the bottom line - excluding the impact of taxes and interest on debt, which are less connected to business fundamentals.
Sterling has managed its cost base well over the last five years. It demonstrated solid profitability for an industrials business, producing an average operating margin of 11.1%. This result was particularly impressive because of its low gross margin, which is mostly a factor of what it sells and takes huge shifts to move meaningfully. Companies have more control over their operating margins, and it’s a show of well-managed operations if they’re high when gross margins are low.
Analyzing the trend in its profitability, Sterling’s operating margin rose by 8.6 percentage points over the last five years, as its sales growth gave it immense operating leverage.
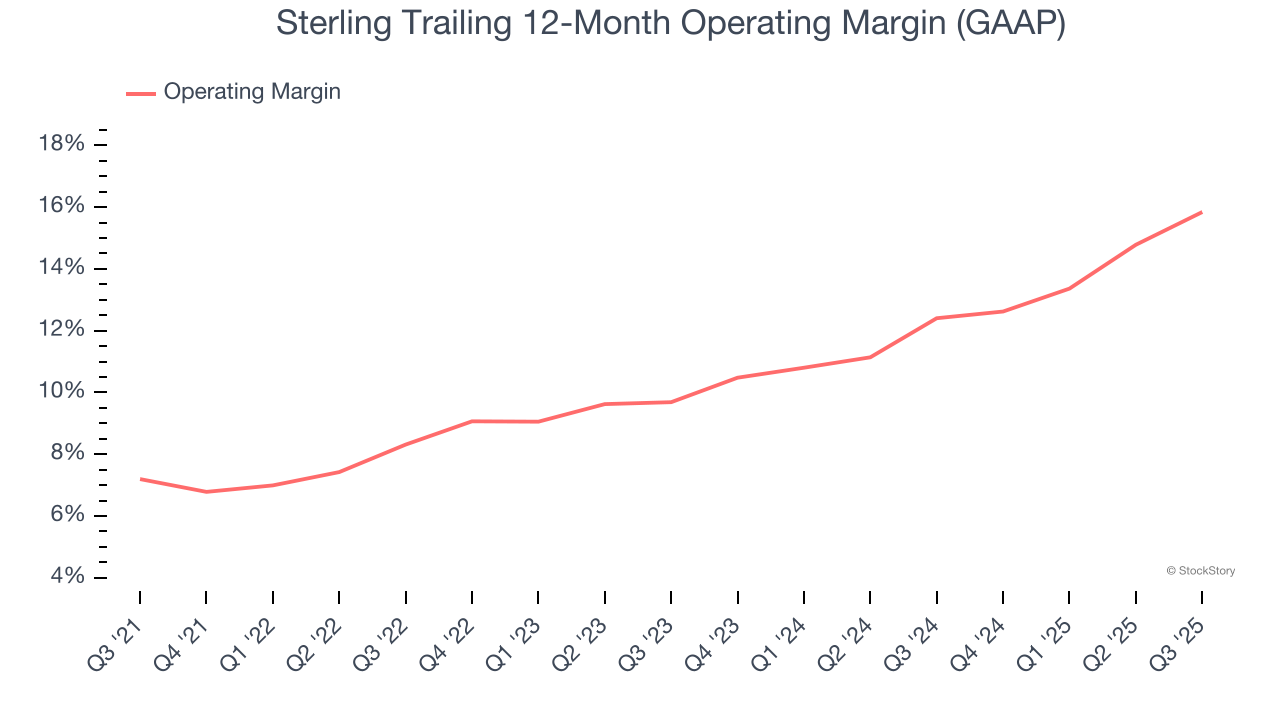
This quarter, Sterling generated an operating margin profit margin of 18.2%, up 3.4 percentage points year on year. Since its gross margin expanded more than its operating margin, we can infer that leverage on its cost of sales was the primary driver behind the recently higher efficiency.
Earnings Per Share
We track the long-term change in earnings per share (EPS) for the same reason as long-term revenue growth. Compared to revenue, however, EPS highlights whether a company’s growth is profitable.
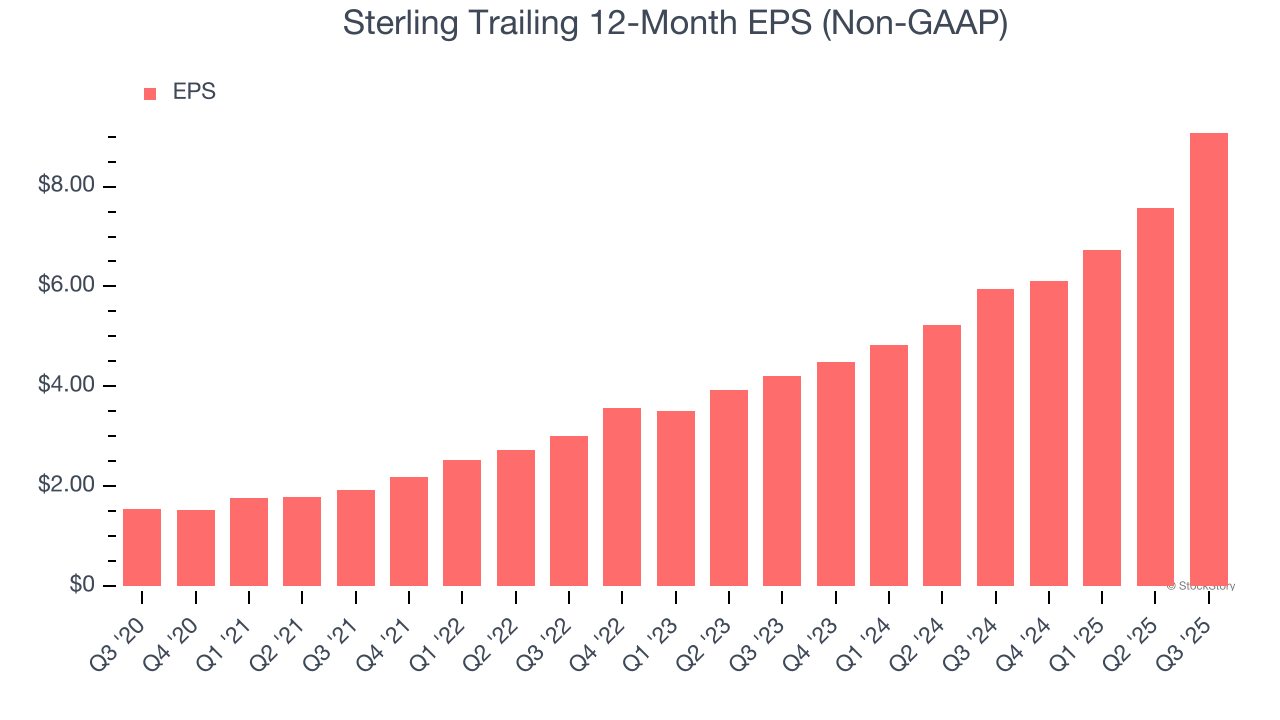
Sterling’s EPS grew at an astounding 42.6% compounded annual growth rate over the last five years, higher than its 9.4% annualized revenue growth. This tells us the company became more profitable on a per-share basis as it expanded.
Diving into Sterling’s quality of earnings can give us a better understanding of its performance. As we mentioned earlier, Sterling’s operating margin expanded by 8.6 percentage points over the last five years. This was the most relevant factor (aside from the revenue impact) behind its higher earnings; interest expenses and taxes can also affect EPS but don’t tell us as much about a company’s fundamentals.
Like with revenue, we analyze EPS over a more recent period because it can provide insight into an emerging theme or development for the business.
For Sterling, its two-year annual EPS growth of 46.7% was higher than its five-year trend. We love it when earnings growth accelerates, especially when it accelerates off an already high base.
In Q3, Sterling reported adjusted EPS of $3.48, up from $1.98 in the same quarter last year. This print easily cleared analysts’ estimates, and shareholders should be content with the results. Over the next 12 months, Wall Street expects Sterling’s full-year EPS of $9.08 to grow 13.6%.
Key Takeaways from Sterling’s Q3 Results
We were impressed by how significantly Sterling blew past analysts’ EBITDA expectations this quarter. We were also excited its revenue outperformed Wall Street’s estimates by a wide margin. Looking ahead, full-year revenue and full-year EPS guidance were both raised. Zooming out, we think this was a very good print with some key areas of upside. The stock traded up 5.2% to $413.50 immediately following the results.
Sterling may have had a good quarter, but does that mean you should invest right now? When making that decision, it’s important to consider its valuation, business qualities, as well as what has happened in the latest quarter. We cover that in our actionable full research report which you can read here, it’s free for active Edge members.