
All amounts are in United States dollars, unless otherwise stated.
TORONTO, July 29, 2026 (GLOBE NEWSWIRE) -- Alamos Gold Inc. (TSX:AGI; NYSE: AGI) (“Alamos” or the “Company”) today reported its financial results for the quarter ended June 30, 2026.
“We produced 130,600 ounces in the second quarter, meeting our revised quarterly guidance, and up 5% from the first quarter. The Island Gold District had a solid quarter from multiple perspectives, including delivering record underground mining rates, milling rates and production. This offset lower than expected production from Mulatos and Young-Davidson. As previously disclosed, we are expecting lower mining rates at Young-Davidson in the second half of 2026 resulting in a temporary reduction in production and increase in costs. We have revised our full year consolidated production and cost guidance with lower production from Young-Davidson the primary driver,” said John A. McCluskey, President and Chief Executive Officer.
“We expect stronger production and significantly lower costs in 2027 driven by improved results from Young-Davidson, as well as low-cost growth from the Island Gold District. In addition to performing well operationally, work on the shaft and mill expansion at the Island Gold District is progressing well with both expected to be key drivers of growing production and declining costs over the next several years,” Mr. McCluskey added.
Second Quarter 2026 Operational and Financial Highlights
- Produced 130,600 ounces of gold in the second quarter of 2026, in-line with the revised quarterly guidance of 130,000 to 135,000 ounces, and a 5% increase from the first quarter. The increase was driven by a strong performance from the Island Gold District, offsetting lower than expected production from the Mulatos District, as well as Young-Davidson which was impacted by a seismic event in June, as previously disclosed
- Island Gold District continues to perform well, with underground mining rates increasing to average a record 1,550 tonnes per day ("tpd"). Magino milling rates also increased to average a new record of nearly 8,900 tpd for the quarter, including 9,800 tpd in June. The higher underground mining rates and milling rates drove record quarterly production of 67,500 ounces. The operation remains on track to achieve its original full year production guidance with a further increase in underground mining rates and grades expected to drive growing production through the rest of 2026
- Consolidated production is expected to increase in the second half of 2026; however, given lower expected mining rates and grades at Young-Davidson, due to the impact of the seismic event, as well as timing of recovery of ounces at La Yaqui Grande, full year production guidance has been lowered to a range of 510,000 to 560,000 ounces
- Given the lower production, higher costs at Young-Davidson to complete rehabilitation work and enhanced ground support in the second half of 2026, as well as increased labour inflation and contractor costs in Canada, full year total cash cost1 guidance has been increased to a range of $1,175 to $1,275 per ounce, and all-in sustaining costs ("AISC"1) to between $1,775 and $1,875 per ounce
- Second quarter gold sales totaled 130,834 ounces at an average realized price of $4,504 per ounce, generating quarterly revenues of $594.1 million, including silver sales. This represented a 36% increase from the second quarter of 2025
- Cash flow from operating activities in the second quarter was $231.8 million (including $286.9 million before changes in working capital and taxes paid1, or $0.68 per share)
- Generated strong free cash flow1 of $143.5 million in the second quarter, while continuing to invest in high-return growth
- Cost of sales were $231.9 million, or $1,772 per ounce in the second quarter. Total cash costs of $1,303 per ounce were 6% higher than the first quarter, and AISC of $1,728 per ounce were 7% lower than the first quarter, largely driven by timing of sustaining capital spend
- Reported net earnings were $270.4 million for the second quarter, or $0.64 per share. Adjusted net earnings1 were $247.6 million, or $0.59 per share1. Adjusted net earnings include an after-tax adjustment for net gain on commodity hedge derivatives of $27.4 million, an inventory net realizable value adjustment of $7.0 million, net of tax, adjustments for net unrealized foreign exchange gains recorded within deferred taxes and foreign exchange totaling $3.6 million, and other adjustments of $1.2 million
- Cash and cash equivalents totaled $636.9 million at June 30, 2026, down slightly from the first quarter reflecting increased share repurchases and the elimination of the remaining 2026 legacy gold hedges inherited from Argonaut Gold ("Argonaut"). The Company remains well-positioned to internally fund all of its growth initiatives and increased shareholder returns with strong ongoing free cash flow
- Returned $67 million to shareholders during the second quarter. This included the repurchase of 1,401,100 shares at a cost of $50 million ($35.70 per share), and a dividend payment of $17 million (quarterly $0.04 per share)
- Repurchased and eliminated all remaining 2026 legacy gold hedges from Argonaut that were scheduled to mature in the second half of 2026, providing further upside to higher gold prices. These contracts totaled 35,000 ounces at an average price of $1,821 per ounce. The Company utilized existing cash to eliminate the hedges at a cost of $92.3 million for an effective price of approximately $4,458 per ounce. The Company has now retired 279,000 ounces, or 85%, of the 329,000 ounces of forward contracts inherited from Argonaut, prior to maturity
- Advanced construction of the Company's key growth projects including Lynn Lake, PDA and the expansion at the Island Gold District. The Phase 3+ Shaft and IGD Expansions are both progressing well with the shaft expected to be commissioned in the first quarter of 2027, and the Magino mill expansion on track for completion in the first quarter of 2028
- Provided an exploration update at the Island Gold District with high-grade mineralization extended across multiple areas which are being targeted as sources of additional higher-grade mill feed within the expanded Magino mill. This includes defining a new zone of high-grade mineralization 250 metres (“m”) west of underground Mineral Reserves and Mineral Resources (Island Gold West Extension), as well as continuing to extend high-grade mineralization within the Island West up-plunge area and the past producing Cline-Pick and Edwards mines. These targets represent opportunities for further production growth by increasing the proportion of higher-grade ore to be fed within the expanded Magino mill
(1) Refer to the “Non-GAAP Measures and Additional GAAP Measures” section of this press release and associated MD&A for a description and calculation of these measures.
Highlight Summary
| Three Months Ended June 30, | Six Months Ended June 30, | |||
| 2026 | 2025 | 2026 | 2025 | |
| Financial Results (in millions) | ||||
| Operating revenues | $594.1 | $438.2 | $1,190.8 | $771.2 |
| Cost of sales(1) | $231.9 | $200.7 | $437.4 | $395.9 |
| Earnings from operations | $357.3 | $216.2 | $702.1 | $310.9 |
| Earnings before income taxes | $410.0 | $181.6 | $725.2 | $207.3 |
| Net earnings | $270.4 | $159.4 | $461.8 | $174.6 |
| Adjusted net earnings(2) | $247.6 | $144.1 | $479.6 | $203.9 |
| Adjusted earnings before interest, taxes, depreciation and amortization(2) | $423.8 | $260.2 | $807.0 | $405.6 |
| Cash provided by operating activities | $231.8 | $199.5 | $474.3 | $279.1 |
| Cash provided by operating activities before changes in working capital and taxes paid(2) | $286.9 | $232.9 | $624.9 | $364.3 |
| Capital expenditures (sustaining)(2) | $35.6 | $33.5 | $80.8 | $60.3 |
| Sustaining finance leases(2)(3) | $3.4 | $4.0 | $7.2 | $8.3 |
| Capital expenditures (growth)(2) | $130.0 | $71.6 | $257.2 | $137.9 |
| Capital expenditures (capitalized exploration) | $15.0 | $9.8 | $26.1 | $16.4 |
| Free cash flow(2)(3) | $143.5 | $84.6 | $245.2 | $64.5 |
| Operating Results | ||||
| Gold production (ounces) | 130,600 | 137,200 | 254,500 | 262,200 |
| Gold sales (ounces) | 130,834 | 135,027 | 252,757 | 252,610 |
| Per Ounce Data | ||||
| Average realized gold price(5) | $4,504 | $3,223 | $4,660 | $3,027 |
| Average spot gold price (London PM Fix) | $4,506 | $3,280 | $4,693 | $3,067 |
| Cost of sales per ounce of gold sold (includes amortization)(1) | $1,772 | $1,486 | $1,731 | $1,567 |
| Total cash costs per ounce of gold sold(2) | $1,303 | $1,075 | $1,268 | $1,114 |
| All-in sustaining costs per ounce of gold sold(2) | $1,728 | $1,481 | $1,793 | $1,565 |
| Share Data | ||||
| Earnings per share, basic | $0.64 | $0.38 | $1.10 | $0.42 |
| Earnings per share, diluted | $0.64 | $0.38 | $1.10 | $0.41 |
| Adjusted earnings per share, basic(2) | $0.59 | $0.34 | $1.14 | $0.48 |
| Weighted average common shares outstanding (basic) (000’s) | 419,694 | 420,474 | 419,796 | 420,445 |
| Financial Position (in millions) | ||||
| Cash and cash equivalents(4) | $636.9 | $623.1 | ||
| (1) | Cost of sales includes mining and processing costs, inventory net realizable value adjustment, royalties, and amortization expense. |
| (2) | Refer to the “Non-GAAP Measures and Additional GAAP Measures” section of this press release and associated MD&A for a description and calculation of these measures. |
| (3) | Sustaining finance leases at the Island Gold District are not included as additions to mineral property, plant and equipment in cash flows used in investing activities. |
| (4) | Cash and cash equivalents in the comparatives reflect the balance as at December 31, 2025. |
| (5) | Average realized gold price for the three and six months ended June 30, 2026 included the delivery of ounces into the gold prepayment facility based on the prepay price of $4,166 per ounce ($2,524 per ounce for the three and six months ended June 30, 2025). |
| Three Months Ended June 30, | Six Months Ended June 30, | |||
| 2026 | 2025 | 2026 | 2025 | |
| Gold production (ounces) | ||||
| Island Gold District(7) | 67,500 | 64,400 | 128,700 | 123,600 |
| Young-Davidson | 33,000 | 38,700 | 63,000 | 74,100 |
| Mulatos District(8) | 30,100 | 34,100 | 62,800 | 64,500 |
| Gold sales (ounces) | ||||
| Island Gold District(7) | 65,726 | 63,958 | 122,835 | 117,346 |
| Young-Davidson | 32,860 | 38,214 | 63,901 | 73,689 |
| Mulatos District(8) | 32,248 | 32,855 | 66,021 | 61,575 |
| Cost of sales (in millions)(1) | ||||
| Island Gold District(7) | $106.7 | $88.3 | $194.5 | $167.8 |
| Young-Davidson | $65.6 | $65.2 | $133.0 | $130.3 |
| Mulatos District(8) | $59.5 | $47.2 | $109.6 | $97.8 |
| Cost of sales per ounce of gold sold (includes amortization)(1) | ||||
| Island Gold District(7) | $1,623 | $1,381 | $1,583 | $1,430 |
| Young-Davidson | $1,996 | $1,706 | $2,081 | $1,768 |
| Mulatos District(8) | $1,845 | $1,437 | $1,660 | $1,588 |
| Total cash costs per ounce of gold sold(2) | ||||
| Island Gold District(7) | $1,304 | $1,008 | $1,250 | $1,023 |
| Young-Davidson | $1,540 | $1,233 | $1,590 | $1,270 |
| Mulatos District(8) | $1,061 | $1,017 | $989 | $1,098 |
| Mine-site all-in sustaining costs per ounce of gold sold(2)(3) | ||||
| Island Gold District(7) | $1,715 | $1,410 | $1,736 | $1,414 |
| Young-Davidson | $1,917 | $1,575 | $2,045 | $1,595 |
| Mulatos District(8) | $1,132 | $1,084 | $1,062 | $1,174 |
| Capital expenditures (sustaining, growth, and capitalized exploration) (in millions)(2) | ||||
| Island Gold District(4)(7) | $98.7 | $74.4 | $221.7 | $146.7 |
| Young-Davidson(5) | $20.2 | $21.4 | $46.1 | $40.2 |
| Mulatos District(6)(8) | $24.7 | $3.7 | $42.0 | $7.7 |
| Other | $40.4 | $19.4 | $61.5 | $28.3 |
| (1) | Cost of sales includes mining and processing costs, inventory net realizable value adjustment, royalties, and amortization expense. |
| (2) | Refer to the “Non-GAAP Measures and Additional GAAP Measures” section of this MD&A for a description and calculation of these measures. |
| (3) | For the purposes of calculating mine-site all-in sustaining costs at individual mine sites the Company allocates a portion of share based compensation to the mine sites, but does not include an allocation of corporate and administrative expenses to the mine sites. |
| (4) | Includes capitalized exploration at Island Gold District of $6.8 million and $10.2 million for the three and six months ended June 30, 2026, respectively ($5.1 million and $9.0 million for the three and six months ended June 30, 2025, respectively). |
| (5) | Includes capitalized exploration at Young-Davidson $2.7 million and $6.1 million for the three and six months ended June 30, 2026, respectively ($2.9 million and $4.9 million for the three and six months ended June 30, 2025, respectively). |
| (6) | Includes capitalized exploration at Mulatos District $3.1 million and $5.3 million for the three and six months ended June 30, 2026, respectively ($1.8 million and $2.5 million for the three and six months ended June 30, 2025, respectively). |
| (7) | The Island Gold District includes Island Gold and Magino mines. |
| (8) | The Mulatos District includes Mulatos and La Yaqui Grande mines. |
Environment, Social and Governance Summary Performance
Health and Safety
- Total Recordable Injury Frequency Rate1 (“TRIFR”) of 1.33 in the second quarter, a 13% improvement from the first quarter
- Lost Time Injury Frequency Rate1 (“LTIFR”) of 0.07 in the second quarter, compared with nil in the first quarter
- Alamos had 20 recordable injuries across its sites, including one lost time injury in the second quarter
- Year-to-date TRIFR of 1.42 and LTIFR of 0.03
The Company’s Home Safe Every Day safety leadership training program, and newly introduced Home Safe Eight safety initiative, continue to be delivered across the workforce. Alamos’ Home Safe Eight is a new initiative consisting of eight non-negotiable safety rules targeting high-risk activities. These enhanced initiatives focus on areas such as energy isolation, working at heights, and safe vehicle operation, and are designed to significantly reduce the potential for injury through consistent and disciplined application.
Alamos strives to maintain a safe, healthy working environment for all, with a strong safety culture where everyone is continually reminded of the importance of keeping themselves and their colleagues healthy and injury-free. The Company’s overarching commitment is to have all employees and contractors return Home Safe Every Day.
Environment
- Reclamation activities at the Cerro Pelon, El Victor and San Carlos pits in the Mulatos District were substantially complete by the end of the second quarter of 2026
- Zero significant environmental incidents
There was one minor reportable incident in the second quarter. At the Young-Davidson mine, a power outage caused a minor sulphur dioxide gas release at the mill, which was promptly detected and remediated with no impact.
The Company remains committed to preserving the long-term health and viability of the natural environment surrounding its operations and projects. This includes investing in new initiatives to reduce the Company's environmental footprint, with the goal of minimizing the impact of its activities.
Community
Alamos continued to provide charitable donations, sponsorships, medical support and infrastructure investments within its local communities, including:
- Providing flights for locum healthcare professionals travelling to Wawa to support healthcare access in the Algoma region
- Sponsorship of various events and teams, including the Manitoba Mine Rescue Competition, Marcel Colomb First Nation Fishing Derby, and the Lynn Lake Wildfire Strong Run/Walk
- Cash donations to various health, education, and food programs in the communities in which Alamos operates
The Company believes that excellence in sustainability provides a net benefit to all stakeholders and continues to engage with local communities to better understand local challenges and priorities. Ongoing investments in local infrastructure, health care, education, cultural and community programs remain a focus of the Company.
Governance and Disclosure
- Published Alamos’ 2025 Report on Conformance to the Responsible Gold Mining Principles ("RGMP") in accordance with the World Gold Council’s RGMP framework, including its supporting independent assurance report
- Published Alamos’ 2025 Report on Modern Slavery in accordance with Canada’s Fighting Against Forced Labour and Child Labour In Supply Chains Act
- Published Alamos’ Extractive Sector Transparency Measures Act 2025 Annual Report on payments to governments in Canada and abroad
The Company maintains the highest standards of corporate governance to ensure that corporate decision-making reflects its values, including the Company’s commitment to sustainable development.
(1) Frequency rate is calculated as incidents per 200,000 hours worked.
Outlook and Strategy
| 2026 Guidance(5) | |||||
| Island Gold District | Young-Davidson | Mulatos District | Lynn Lake | Total | |
| Gold production(000's ounces) | 290 - 310 | 100 - 115 | 120 - 135 | — | 510 - 560 |
| Previous gold production (000's ounces) | 290 - 330 | 155 - 175 | 125 - 145 | — | 570 - 650 |
| Cost of sales, including amortization(in millions)(2) | $890 | ||||
| Previous cost of sales, including amortization (in millions)(2) | $920 | ||||
| Total cash costs($ per ounce)(1) | $1,025 - $1,125 | $1,750 - $1,850 | $1,050 - $1,150 | — | $1,175 - $1,275 |
| Previous total cash costs ($ per ounce)(1) | $875 - $975 | $1,350 - $1,450 | $930 - $1,030 | — | $1,020 - $1,120 |
| All-in sustaining costs($ per ounce)(1)(3) | $1,550-$1,650 | $2,500-$2,600 | $1,125 - $1,225 | — | $1,775 - $1,875 |
| Previous all-in sustaining costs ($ per ounce)(1)(3) | $1,340-$1,440 | $1,730-$1,830 | $1,000 - $1,100 | — | $1,500 - $1,600 |
| Capital expenditures($ millions) | |||||
| Sustaining capital(1)(4) | $135 - $150 | $90 - $100 | $3 - $5 | — | $228 - $255 |
| Previous sustaining capital(1)(4) | $135 - $150 | $55 - $65 | $3 - $5 | — | $193 - $220 |
| Growth capital(1)(4) | $355 - $385 | $25 - $30 | $137 - $145 | $140 - $160 | $657 - $720 |
| Total sustaining and growth capital(1)(4) | $490 - $535 | $115 - $130 | $140 - $150 | $140 - $160 | $885 - $975 |
| Previous total sustaining and growth capital(1)(4) | $490 - $535 | $80 - $95 | $140 - $150 | $140 - $160 | $850 - $940 |
| Capitalized exploration(1) | $33 | $12 | $9 | $6 | $60 |
| Total capital expenditures and capitalized exploration(1) | $523 - $568 | $127 - $142 | $149 - $159 | $146 - $166 | $945 - $1,035 |
| Previous total capital expenditures and capitalized exploration(1) | $523 - $568 | $92 - $107 | $149 - $159 | $146 - $166 | $910 - $1,000 |
| (1) | Refer to the "Non-GAAP Measures and Additional GAAP" section of this press release and associated MD&A for a description of these measures. |
| (2) | Cost of sales includes mining and processing costs, royalties, and amortization expense but excludes silver credit and inventory net realizable value adjustment, and is calculated based on the mid-point of total cash cost guidance. |
| (3) | Total consolidated all-in sustaining costs include corporate and administrative, and share based compensation expenses. For the purposes of calculating mine-site all-in sustaining costs at individual mine sites the Company allocates a portion of share based compensation to the mine sites, but does not include an allocation of corporate and administrative expenses to the mine sites. |
| (4) | Sustaining and growth capital guidance excludes capitalized exploration. |
| (5) | Previous annual guidance was issued on February 4, 2026 and was revised on July 29, 2026. |
The Company’s objective is to operate a sustainable business model that supports growing returns to all stakeholders over the long-term, through growing production, expanding margins, and increasing profitability. This includes a balanced approach to capital allocation focused on generating strong ongoing free cash flow while re-investing in high-return internal growth opportunities, and supporting higher returns to shareholders.
Second quarter production of 130,600 ounces increased 5% from the first quarter, and was in line with revised quarterly guidance with a strong performance from the Island Gold District offsetting lower production from Young-Davidson and the Mulatos District. Production guidance for the second quarter was revised in June reflecting the impact of a seismic event at Young-Davidson, and delayed recovery of ounces stacked on the leach pad at La Yaqui Grande. The seismic event at Young-Davidson impacted access to the 9410 level and higher-grade stopes that were supplying approximately 2,500 tpd of ore. As previously disclosed, this is expected to limit mining rates to an average of approximately 5,000 tpd in the second half of 2026. Reflecting the lower expected mining rates and grades at Young-Davidson in the second half of 2026, and longer leach cycle at La Yaqui Grande, full year production guidance has been lowered to between 510,000 and 560,000 ounces.
Given the lower production, higher costs at Young-Davidson to complete rehabilitation work and enhanced ground support in the second half of 2026, as well as increased labour inflation and contractor costs in Canada, full year total cash cost guidance has been increased to a range of $1,175 to $1,275 per ounce, and AISC to between $1,775 and $1,875 per ounce.
The Company expects stronger production into the second half of the year driven by the ongoing ramp up of production from the Island Gold District. Production in the third quarter is expected to be between 115,000 and 140,000 ounces. AISC are expected to increase in the third quarter reflecting lower production and timing of sustaining capital. Production is expected to increase in the fourth quarter contributing to lower AISC.
The Island Gold District continues to perform well with a record operational performance from a number of perspectives in the second quarter. This included underground mining rates of 1,550 tpd and Magino milling rates increasing to a new high of nearly 8,900 tpd, including averaging approximately 9,800 tpd in June. This drove record quarterly production of 67,500 ounces. A further increase in underground mining and milling rates, as well as higher underground grades is expected to drive additional production growth through the second half of the year.
The Company continues to generate strong ongoing free cash flow while advancing its portfolio of high-return growth projects which are expected to support further production growth and lower costs over the next several years. Free cash flow totaled $143.5 million in the second quarter, net of a significant reinvestment in growth and exploration, and supporting the Company's other capital allocation priorities. This included repurchasing $50 million of shares during the second quarter, and eliminating all remaining legacy Argonaut hedges that were maturing in the second half of 2026 at a cost of $92.3 million.
Each of the Company's key growth projects are progressing well including the Island Gold District shaft and mill expansion, PDA and Lynn Lake. These projects are expected to double gold production to approximately one million ounces annually by 2030, underpinning one of the strongest outlooks in the sector.
The Island Gold District will be a key driver of this growth over the next several years. Following the completion of the shaft sinking to its planned depth of 1,381 m in the first quarter, shaft equipping and work on the shaft bottom infrastructure is well underway and expected to continue through 2026. The commissioning of the shaft in the first quarter of 2027 is expected to support a further increase in underground mining rates. This is expected to drive consolidated gold production higher and costs lower in 2027.
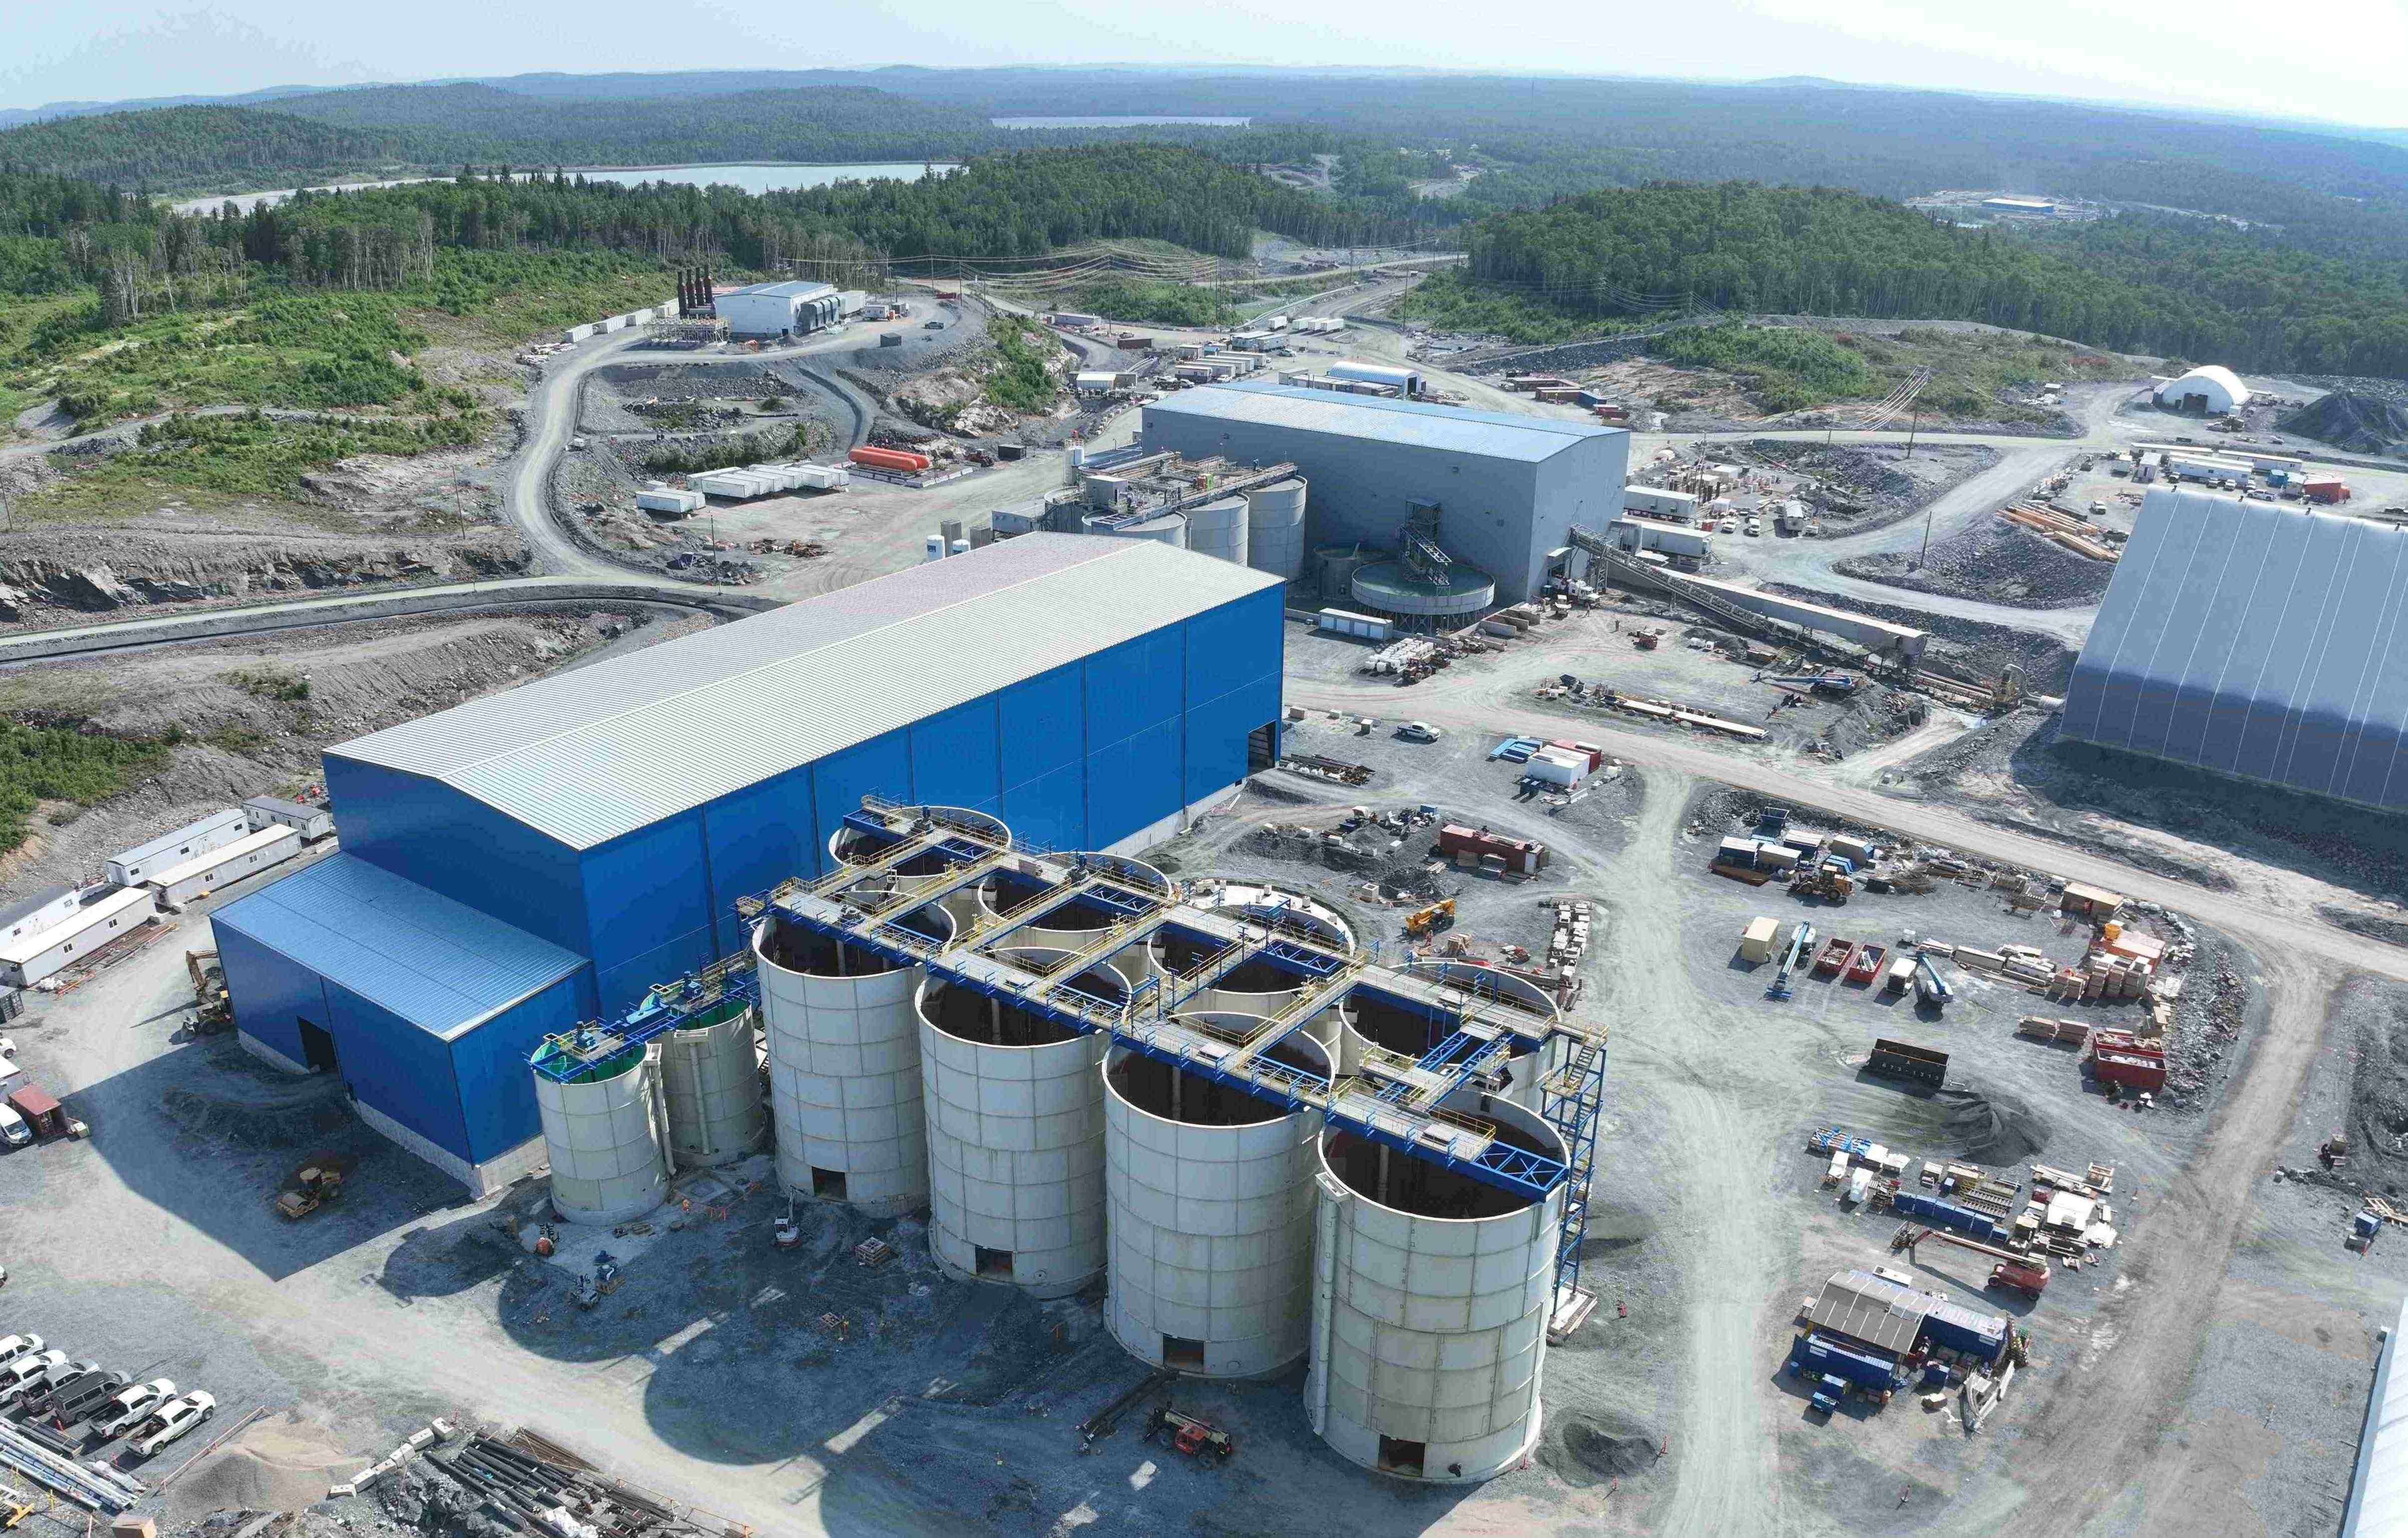
In parallel, work on the Magino mill expansion to 20,000 tpd continues to progress with all exterior cladding and roofing on the new mill building complete, and all eight leach tanks erected. The completion of the IGD Expansion in 2028 is expected to drive a further increase in production and decrease in costs.
Further growth is expected into 2029 with initial production from Lynn Lake, and the ramp up of underground mining rates at Island Gold to 3,000 tpd, as outlined in the IGD Expansion Study. By 2030, production is expected to increase to a rate of approximately one million ounces annually.
Capital spending in 2026 is expected to range between $885 and $975 million, excluding capitalized exploration of $60 million. The largest portion of this budget will be focused on the completion of the shaft expansion and Magino mill expansion within the Island Gold District. Capital spending is expected to decline slightly in 2027 with increased spending at Lynn Lake offset by lower spending on PDA and the Island Gold District. A further decrease is expected in 2028 with the completion of the IGD Expansion. A more significant decrease is expected into 2029 and 2030 with the completion of construction at Lynn Lake.
The Company remains well positioned to fund its high-return growth projects internally with strong ongoing free cash flow, $636.9 million of cash and cash equivalents at the end of the second quarter of 2026, and approximately $1.2 billion of total liquidity. At current gold prices, the Company expects significant free cash flow growth starting in 2027 with the completion of the Phase 3+ Shaft Expansion. The Company remains focused on delivering increasing shareholder returns with $83.6 million distributed thus far in 2026 through dividends and share buybacks. This included a 60% increase in the quarterly dividend rate in the first quarter, and the repurchase of $50 million of shares during the second quarter.
Given the Company's strong outlook with significant free cash flow growth expected over the next several years, the Company will continue to evaluate opportunities to be active on its share buyback while balancing its other capital allocation priorities, including the repurchase of the remaining 50,000 ounces of legacy Argonaut hedges set to mature in 2027.
Second Quarter 2026 Results
Island Gold District Financial and Operational Review
| Three Months Ended June 30, | Six Months Ended June 30, | |||
| 2026 | 2025 | 2026 | 2025 | |
| Gold production (ounces) | 67,500 | 64,400 | 128,700 | 123,600 |
| Gold sales (ounces) | 65,726 | 63,958 | 122,835 | 117,346 |
| Financial Review (in millions) | ||||
| Operating Revenues | $296.8 | $210.8 | $576.1 | $362.8 |
| Cost of sales(1) | $106.7 | $88.3 | $194.5 | $167.8 |
| Earnings from operations | $188.5 | $120.8 | $378.2 | $192.2 |
| Cash provided by operating activities | $195.2 | $122.7 | $372.4 | $209.6 |
| Capital expenditures (sustaining)(2) | $22.8 | $20.1 | $50.7 | $35.6 |
| Lease payments (sustaining)(2),(5) | $3.4 | $4.0 | $7.2 | $8.3 |
| Capital expenditures (growth)(2) | $65.7 | $45.2 | $153.6 | $93.8 |
| Capital expenditures (capitalized exploration)(2) | $6.8 | $5.1 | $10.2 | $9.0 |
| Mine-site free cash flow(2),(5) | $99.9 | $52.3 | $157.9 | $71.2 |
| Cost of sales, including amortization per ounce of gold sold(1) | $1,623 | $1,381 | $1,583 | $1,430 |
| Total cash costs per ounce of gold sold(2) | $1,304 | $1,008 | $1,250 | $1,023 |
| Mine-site all-in sustaining costs per ounce of gold sold(2),(3) | $1,715 | $1,410 | $1,736 | $1,414 |
| Island Gold Mine | ||||
| Underground Operations | ||||
| Tonnes of ore mined(9) | 141,080 | 113,182 | 269,192 | 223,408 |
| Tonnes of ore mined per day(9) | 1,550 | 1,244 | 1,487 | 1,234 |
| Average grade of gold(4),(9) | 9.15 | 11.48 | 9.26 | 11.49 |
| Metres developed | 2,188 | 2,122 | 3,944 | 4,280 |
| Island Gold Mill Operations(8) | ||||
| Tonnes of ore processed | 112,086 | 118,738 | 225,250 | 227,804 |
| Tonnes of ore processed per day | 1,232 | 1,305 | 1,244 | 1,259 |
| Average grade of gold(4) | 10.14 | 11.44 | 10.05 | 11.40 |
| Contained ounces milled | 36,559 | 43,666 | 72,747 | 83,504 |
| Average recovery rate | 98% | 98% | 97% | 98% |
| Magino Mine | ||||
| Open Pit Operations | ||||
| Tonnes of ore mined - open pit(6) | 1,182,631 | 1,251,029 | 2,255,710 | 2,315,899 |
| Tonnes of ore mined per day | 12,996 | 13,748 | 12,462 | 12,795 |
| Total waste mined - open pit(7) | 3,810,580 | 3,893,410 | 7,228,796 | 7,339,538 |
| Total tonnes mined - open pit | 4,993,211 | 5,144,439 | 9,484,506 | 9,655,437 |
| Waste-to-ore ratio(7) | 3.22 | 3.11 | 3.20 | 3.17 |
| Average grade of gold(4) | 0.78 | 0.82 | 0.79 | 0.79 |
| Magino Mill Operations(8) | ||||
| Tonnes of ore processed | 806,477 | 765,423 | 1,482,460 | 1,416,576 |
| Tonnes of ore processed per day | 8,862 | 8,411 | 8,190 | 7,826 |
| Average grade of gold processed(4) | 1.27 | 0.94 | 1.23 | 0.90 |
| Contained ounces milled | 32,900 | 23,082 | 58,439 | 41,002 |
| Average recovery rate | 95% | 95% | 95% | 94% |
| Island Gold District Mill Operations | ||||
| Tonnes of ore processed per day | 10,094 | 9,716 | 9,435 | 9,085 |
| Average grade of gold processed(4) | 2.35 | 2.35 | 2.39 | 2.36 |
| Average recovery rate | 97% | 97% | 96% | 97% |
| (1) | Cost of sales includes mining and processing costs, royalties, and amortization. |
| (2) | Refer to the “Non-GAAP Measures and Additional GAAP Measures” section of this press release and associated MD&A for a description and calculation of these measures. |
| (3) | For the purposes of calculating mine-site all-in sustaining costs at individual mine sites the Company allocates a portion of share based compensation to the mine sites, but does not include an allocation of corporate and administrative expenses to the mine sites. |
| (4) | Grams per tonne of gold. |
| (5) | Mine-site free cash flow does not include lease payments which are classified as cash flows used in financing activities on the consolidated financial statements. |
| (6) | Includes ore stockpiled during the periods. |
| (7) | Total waste mined includes operating waste and capitalized stripping. |
| (8) | Magino mill results include the processing of open pit ore from Magino and excess underground ore not processed within the Island Gold mill for the three and six months ended June 30, 2026. Grades of gold processed from the Magino mine averaged 1.07 g/t Au in both periods. |
| (9) | Excludes 13,541 tonnes of ore grading 2.98 g/t Au that was recovered from the ore pad and processed during the three months period ended June 30, 2026. Including these tonnes, total tonnes mined in the second quarter of 2026 were 154,621 grading 8.61 g/t Au, or 1,699 tpd. |
The Island Gold District produced a record 67,500 ounces in the second quarter of 2026, 5% higher than the prior year period and a 10% increase compared to the first quarter. With higher underground mining rates and grades expected to drive increasing production through the second half of 2026, the Island Gold District remains on track to achieve its original full year production guidance.
Island Gold Operational Review
Underground mining rates increased to average a record 1,550 tpd in the second quarter, 25% higher than the prior year period and a 9% increase from the previous quarter. Mining rates are expected to steadily increase in the second half of the year to a rate of 2,000 tpd by the end of 2026, with a further increase to 2,400 tpd in the first quarter of 2027 with the commissioning of the shaft infrastructure.
Underground grades mined averaged 9.15 g/t Au during the second quarter, consistent with guidance. Grades are expected to increase slightly in the third quarter, with a further increase in the fourth quarter.
Processing rates within the Island Gold mill averaged 1,232 tpd for the second quarter, with excess underground ore mined during the quarter processed in the Magino mill. Mill recoveries averaged 98% for the second quarter, in line with expectations.
As outlined in the IGD Expansion Study, the Island Gold mill will continue operating until the first quarter of 2028 and process approximately 1,265 tpd of higher grade underground ore. The remaining underground ore mined beyond the Island Gold mill capacity will be blended at increasing rates with open pit ore and processed within the Magino mill. Following the expected completion of the Magino mill expansion to 20,000 tpd in the first quarter of 2028, the Island Gold mill will be shut down and all underground and open pit ore will be processed within the larger and more cost-effective Magino mill.
Magino Operational Review
Total mining rates averaged 54,870 tpd during the second quarter, including 12,996 tpd of ore, a 5% decrease from the prior year period. Grades mined of 0.78 g/t Au for the second quarter were 5% lower than the prior year period and consistent with the guidance range for 2026.
Milling rates averaged a new high of 8,862 tpd in the second quarter, an 18% increase from the first quarter, reflecting the improving performance and reliability of the overall circuit, as well as the addition of supplemental ore feed from the temporary crusher. Following the completion of scheduled ball and SAG mill liner changes and conveyor belt replacements in May, milling rates continued to improve, averaging a new monthly high of 9,783 tpd in June. Subsequent to quarter end, milling rates have continued increasing to average approximately 10,000 tpd month to date in July, and are expected to remain at similar levels through the second half of 2026.
As outlined in the IGD Expansion Study released in February 2026, further improvements are planned for the existing crushing and conveying circuit as part of the mill expansion to 20,000 tpd. These include the addition of a gyratory crusher, ore bins, and a new truck dump configuration allowing for the direct tipping of ore. In addition to the connection to grid power, these changes will significantly improve the performance of the existing crushing circuit by reducing ore rehandling and ensuring more consistent and higher ore flow to the mill.
Grades processed averaged 1.27 g/t Au during the second quarter, and included approximately 44,000 tonnes of higher grade underground ore. Recoveries for the second quarter were 95%, consistent with guidance.
Island Gold District Financial Review
Revenues of $296.8 million in the second quarter were 41% higher than the prior year period, driven by higher realized gold prices and an increase in ounces sold. Similarly, revenues of $576.1 million for the first half of the year were 59% higher than the prior year period, driven by the same factors.
Cost of sales of $106.7 million in the second quarter and $194.5 million for the first half of the year were 21% and 16% higher than the comparative periods, respectively, driven by higher ounces sold and ongoing inflation.
Total cash costs of $1,304 per ounce and mine-site AISC of $1,715 per ounce in the second quarter were higher than the prior year period, driven by higher contractor costs, ongoing labour inflation, higher diesel and energy costs, partially offset by the weaker Canadian dollar. For the first half of the year, total cash costs of $1,250 per ounce and mine-site AISC of $1,736 per ounce were higher than the prior year periods, driven by the same factors as well as higher sustaining capital in support of the IGD Expansion to 20,000 tpd.
Total cash costs and mine-site AISC are expected to decrease through the second half of 2026 driven by increased production through the ramp up of underground mining rates, higher underground grades, and increased milling rates. However, given increased labour and contractor costs reflecting the more competitive labour environment in Northern Ontario, as well as increased energy costs, full year cost guidance has been increased. Total cash costs are now expected to be between $1,025 and $1,125 per ounce, and mine-site AISC between $1,550 and $1,650 per ounce.
Capital expenditures totaled $98.7 million in the second quarter, including $22.8 million of sustaining capital, $3.4 million of sustaining lease payments, and $6.8 million of capitalized exploration. Growth capital spending of $65.7 million was primarily focused on the Phase 3+ Shaft Expansion, including shaft site infrastructure, paste plant, and underground development, as well as the Magino mill expansion to 20,000 tpd. Both sustaining and growth capital spending are expected to increase in the second half of the year to be consistent with full year guidance.
The Island Gold District generated strong mine-site free cash flow of $99.9 million in the second quarter, 91% higher than the prior year period, driven by higher realized gold prices and ounces sold. Mine-site free cash flow was $157.9 million for the first half of the year, 122% higher than the prior year period. The strong free cash flow generation was net of the significant capital investment related to the Phase 3+ Shaft and IGD Expansions. At current gold prices, the Island Gold District is expected to continue generating strong free cash flow while funding the expansion of the operation and a robust exploration program, with significant growth starting in the latter part of 2026.
Young-Davidson Financial and Operational Review
| Three Months Ended June 30, | Six Months Ended June 30, | |||
| 2026 | 2025 | 2026 | 2025 | |
| Gold production (ounces) | 33,000 | 38,700 | 63,000 | 74,100 |
| Gold sales (ounces) | 32,860 | 38,214 | 63,901 | 73,689 |
| Financial Review (in millions) | ||||
| Operating Revenues | $150.1 | $126.1 | $303.7 | $227.3 |
| Cost of sales(1) | $65.6 | $65.2 | $133.0 | $130.3 |
| Earnings from operations | $83.3 | $60.0 | $168.0 | $95.1 |
| Cash provided by operating activities | $87.6 | $80.1 | $185.0 | $138.1 |
| Capital expenditures (sustaining)(2) | $12.2 | $12.9 | $28.8 | $23.6 |
| Capital expenditures (growth)(2) | $5.3 | $5.6 | $11.2 | $11.7 |
| Capital expenditures (capitalized exploration)(2) | $2.7 | $2.9 | $6.1 | $4.9 |
| Mine-site free cash flow(2) | $67.4 | $58.7 | $138.9 | $97.9 |
| Cost of sales, including amortization per ounce of gold sold(1) | $1,996 | $1,706 | $2,081 | $1,768 |
| Total cash costs per ounce of gold sold(2) | $1,540 | $1,233 | $1,590 | $1,270 |
| Mine site all-in sustaining costs per ounce of gold sold(2),(3) | $1,917 | $1,575 | $2,045 | $1,595 |
| Underground Operations | ||||
| Tonnes of ore mined | 648,968 | 654,317 | 1,297,457 | 1,262,918 |
| Tonnes of ore mined per day | 7,132 | 7,190 | 7,168 | 6,977 |
| Average grade of gold(4) | 1.75 | 2.01 | 1.74 | 2.01 |
| Metres developed | 1,697 | 2,203 | 4,084 | 4,335 |
| Mill Operations | ||||
| Tonnes of ore processed | 674,662 | 639,368 | 1,285,362 | 1,238,583 |
| Tonnes of ore processed per day | 7,414 | 7,026 | 7,101 | 6,843 |
| Average grade of gold(4) | 1.72 | 2.05 | 1.73 | 2.03 |
| Contained ounces milled | 37,210 | 42,203 | 71,477 | 80,967 |
| Average recovery rate | 90% | 91% | 89% | 91% |
| (1) | Cost of sales includes mining and processing costs, royalties and amortization. |
| (2) | Refer to the “Non-GAAP Measures and Additional GAAP Measures” section of this press release and associated MD&A for a description and calculation of these measures. |
| (3) | For the purposes of calculating mine-site all-in sustaining costs at individual mine sites the Company allocates a portion of share based compensation to the mine sites, but does not include an allocation of corporate and administrative expenses to the mine sites. |
| (4) | Grams per tonne of gold. |
Operational review
Young-Davidson produced 33,000 ounces of gold in the second quarter, 15% below the prior year period and lower than planned. Reflecting lower production through the first half of the year, and lower mining rates and grades expected through the second half of the year, full year production guidance has been reduced to between 100,000 and 115,000 ounces. Cost guidance has also been increased reflecting the decreased production.
In June, the operation experienced a seismic event at an active mining front. No injuries were sustained; however, infrastructure was damaged which has limited access to the 9410 level and two higher grade stopes, impacting both mining rates and grades mined. Additionally, the operation experienced power outages due to storm-related damage to the regional power line in late May, which impacted mining and processing rates for three days.
Mining rates averaged 7,132 tpd in the second quarter, below annual guidance reflecting the above noted impacts. The mining sequence is consistently being reviewed and monitored to manage seismicity. As a result of the seismic event, and delayed access to higher-grade stopes on the 9410 level that were supplying approximately 2,500 tpd, mining rates are expected to average approximately 5,000 tpd for the remainder of the year. The Company will be optimizing the mining sequence and implementing additional ground support measures through the second half of the year, which is expected to support higher mining rates beyond 2026. The Company expects to provide additional information on future mining rates and costs with the release of its three-year guidance early in 2027.
Grades mined of 1.75 g/t Au for the second quarter were below the low end of the annual guidance range, reflecting the change in mining sequence and deferred access to higher grade stopes on the 9410 level. Grades mined are expected to remain at similar levels through the rest of 2026.
Milling rates averaged 7,414 tpd in the second quarter, below guidance but higher than mining rates as lower-grade surface stockpiles were processed. Milling rates are expected to exceed mining rates in the second half of the year with additional stockpiles expected to be processed given the underutilized mill. Milled grades averaged 1.72 g/t Au for the second quarter, consistent with mined grades. Processed grades are expected to be lower than mined grades in the second half of the year reflecting the processing of lower-grade stockpiled ore. Mill recoveries averaged 90% for the second quarter and were consistent with guidance.
Financial Review
Revenues were $150.1 million in the second quarter, 19% higher than the prior year period, driven by higher realized gold prices, partially offset by lower ounces sold. For the first half of the year, revenues of $303.7 million were 34% higher than the prior year period, driven by the same factors.
Cost of sales of $65.6 million in the second quarter were in-line with the prior year period as inflation was offset by lower ounces sold. Cost of sales of $133.0 million for the first half of the year was in line with the prior year.
Second quarter total cash costs of $1,540 per ounce and mine-site AISC of $1,917 per ounce were higher than the prior year period, primarily due to lower grades processed, increased diesel costs, higher royalty expense, and ongoing labour inflation. Total cash costs of $1,590 per ounce and mine-site AISC of $2,045 per ounce for the first half of the year were higher than the prior year period, driven by the same factors, as well as higher sustaining capital expenditures across a lower number of ounces sold.
In the second half of 2026, total cash costs are expected to increase to average approximately $2,100 per ounce, and mine-site AISC average $3,300 per ounce. This reflects similar gross costs across lower gold production due to the lower mining rates and grades, as well as rehabilitation work and enhanced ground support measures to be completed in the second half of the year. As a result, full year total cash cost guidance has been increased to between $1,750 and $1,850 per ounce, and mine-site AISC to between $2,500 and $2,600 per ounce.
Capital expenditures in the second quarter totaled $20.2 million, including $12.2 million of sustaining capital and $5.3 million of growth capital. In addition, $2.7 million was invested in capitalized exploration during the quarter. Capital expenditures, inclusive of capitalized exploration, totaled $46.1 million for the first half of the year. Full year capital guidance has been increased to between $115 and $130 million with higher sustaining capital spending expected in the second half of the year. This includes increased labour and contractor costs, a higher proportion of underground development being allocated to capital, and approximately $10 million for rehabilitation work and the implementation of enhanced ground support following the seismic event in June.
Young-Davidson continues to generate strong ongoing mine-site free cash flow, including $67.4 million in the second quarter and $138.9 million for the first half of the year. With a 14-year Mineral Reserve life, the operation is well-positioned to generate strong ongoing free cash flow over the long-term.
Mulatos District Financial and Operational Review
| Three Months Ended June 30, | Six Months Ended June 30, | |||
| 2026 | 2025 | 2026 | 2025 | |
| Gold production (ounces) | 30,100 | 34,100 | 62,800 | 64,500 |
| Gold sales (ounces) | 32,248 | 32,855 | 66,021 | 61,575 |
| Financial Review(in millions) | ||||
| Operating Revenues | $149.4 | $110.6 | $317.5 | $194.6 |
| Cost of sales(1) | $59.5 | $47.2 | $109.6 | $97.8 |
| Earnings from operations | $86.5 | $59.2 | $201.6 | $90.3 |
| Cash provided by operating activities | $85.9 | $58.9 | $164.0 | $63.5 |
| Capital expenditures (sustaining)(2) | $0.6 | $0.5 | $1.3 | $1.1 |
| Capital expenditures (growth)(2) | $21.0 | $1.4 | $35.4 | $4.1 |
| Capital expenditures (capitalized exploration)(2) | $3.1 | $1.8 | $5.3 | $2.5 |
| Mine-site free cash flow(2) | $61.2 | $55.2 | $122.0 | $55.8 |
| Cost of sales, including amortization per ounce of gold sold(1) | $1,845 | $1,437 | $1,660 | $1,588 |
| Total cash costs per ounce of gold sold(2) | $1,061 | $1,017 | $989 | $1,098 |
| Mine site all-in sustaining costs per ounce of gold sold(2),(3) | $1,132 | $1,084 | $1,062 | $1,174 |
| La Yaqui Grande Mine | ||||
| Open Pit Operations | ||||
| Tonnes of ore mined - open pit | 746,676 | 1,015,236 | 1,700,625 | 2,010,049 |
| Total waste mined - open pit | 4,679,650 | 4,133,651 | 8,463,878 | 8,219,525 |
| Total tonnes mined - open pit | 5,426,326 | 5,148,887 | 10,164,503 | 10,229,574 |
| Waste-to-ore ratio | 6.27 | 4.07 | 4.98 | 4.09 |
| Crushing and Heap Leach Operations | ||||
| Tonnes of ore stacked | 825,631 | 1,016,437 | 1,807,554 | 2,039,020 |
| Average grade of gold processed(4) | 1.08 | 1.54 | 1.24 | 1.14 |
| Contained ounces stacked | 28,759 | 50,280 | 72,004 | 74,890 |
| Average recovery rate | 87% | 52% | 72% | 62% |
| Ore crushed per day (tonnes) | 9,100 | 11,200 | 10,000 | 11,300 |
| (1) | Cost of sales includes mining and processing costs, inventory net realizable value adjustment, royalties, and amortization expense. |
| (2) | Refer to the “Non-GAAP Measures and Additional GAAP Measures” section of this press release and associated MD&A for a description and calculation of these measures. |
| (3) | For the purposes of calculating mine-site all-in sustaining costs at individual mine sites the Company allocates a portion of share based compensation to the mine sites, but does not include an allocation of corporate and administrative expenses to the mine sites. |
| (4) | Grams per tonne of gold. |
Mulatos District Operational Review
The Mulatos District produced 30,100 ounces in the second quarter, a 12% decrease from the prior year period, reflecting lower production at La Yaqui Grande, as well as a lower contribution from residual leaching of the Mulatos leach pad. Production in the second quarter and through the first half of 2026 was lower than planned primarily reflecting slower than expected recoveries at La Yaqui Grande. Recovery expectations from La Yaqui Grande remain unchanged; however, a longer leach cycle and increasing pad height are resulting in a longer time period to recover ounces stacked on the pad. This is similar to the Mulatos operation where ounces continue to be recovered from the leach pad more than 2.5 years after the end of mining and stacking. As a result, 2026 production guidance has been reduced to between 120,000 and 135,000 ounces, with a corresponding increase in costs.
La Yaqui Grande produced 25,100 ounces in the second quarter, 4% lower than the prior year period, due to lower stacking rates and processed grades. Stacking rates averaged 9,100 tpd in the second quarter, below the low end of the guidance range as the operation focused on waste stripping. Mining and stacking rates of ore are expected to remain at similar levels in the third quarter followed by an increase in the fourth quarter to within the range of annual guidance. During the second quarter, grades stacked averaged 1.08 g/t Au and recovery rates averaged 87%, both consistent with guidance. Grades stacked are expected to decrease in the third quarter followed by an increase to the mid-point of guidance in the fourth quarter.
Mulatos has been in the residual leaching phase since December 2023 and produced 5,000 ounces in the second quarter.
Mulatos District Financial Review
Revenues of $149.4 million in the second quarter were 35% higher than the prior year period, reflecting higher realized gold prices. For the first half of the year, revenues of $317.5 million were 63% higher than the prior year period, reflecting higher realized gold prices and ounces sold.
Cost of sales of $59.5 million in the second quarter was 26% higher than the prior year period, primarily due to a Mulatos leach pad inventory adjustment recorded in the quarter. For the first half of the year, cost of sales of $109.6 million was 12% higher than the prior year period driven by higher ounces sold and the Mulatos leach pad inventory adjustment. Given the decrease in the gold price in the second quarter and higher processing costs, the Company recorded an adjustment to reduce the carrying value of Mulatos leach pad inventory, resulting in a net realizable value adjustment of $10.8 million. As at June 30, 2026, the remaining inventory balance on the Mulatos leach pad was $16.0 million, which the Company expects to recover through the residual leaching over the remainder of the year and into the first quarter of 2027.
Total cash costs of $1,061 per ounce and mine-site AISC of $1,132 per ounce in the second quarter were higher than the prior year period, reflecting increased unit costs from residual leaching at Mulatos, as well as lower stacking rates and grades processed at La Yaqui Grande. For the first half of the year, total cash costs of $989 per ounce and mine-site AISC of $1,062 per ounce, were lower than the prior year period and consistent with guidance. With costs expected to increase in the second half of the year reflecting lower planned production rates, full year total cash costs guidance has been increased to between $1,050 and $1,150 per ounce, and mine-site AISC to between $1,125 and $1,225 per ounce.
Capital expenditures totaled $24.7 million in the second quarter, including $0.6 million of sustaining capital and $3.1 million of capitalized exploration. Growth capital spending related to PDA of $21.0 million included portal construction and underground mine development, procurement activities, detailed engineering, and structural steel and concrete foundation work for the mill. Spending on PDA is expected to increase in the second half of the year as construction activities ramp up. The project remains on budget and on track for completion in mid-2027.
The Mulatos District generated strong mine-site free cash flow of $61.2 million in the second quarter and $122.0 million for the first half of the year, higher than the comparative periods primarily due to higher realized gold prices. The strong free cash flow generation was net of $26.9 million of cash tax payments in the second quarter, and $77.8 million in the first half of the year. Cash tax installments in Mexico related to the 2026 fiscal year are expected to average between $15 and $20 million per quarter for the second half of the year, based on a budgeted gold price of $4,000 per ounce. At current gold prices, the Mulatos District is expected to generate strong mine-site free cash flow through the remainder of the year while funding PDA and a significant exploration program.
Second Quarter 2026 Development Activities
Island Gold District (Ontario, Canada)
Phase 3+ Shaft and IGD Expansion
In 2022, the Company announced the Phase 3+ Shaft Expansion at Island Gold from 1,200 tpd to 2,400 tpd. The expansion includes the construction of a shaft and paste plant, as well as accelerated development to support the higher mining rates. With the commissioning of the shaft expected to be completed in the first quarter of 2027, the operation will transition from trucking ore and waste up the ramp to skipping ore and waste to surface, driving production higher and costs significantly lower. As of June 30, 2026, substantially all of the Phase 3+ Shaft Expansion growth capital has been spent and committed.
On February 3, 2026, the Company announced the IGD Expansion Study outlining a larger, long-life, low-cost mine with an average annual gold production of 534,000 ounces over the initial 10 years (starting in 2028) at average mine-site AISC of $1,025 per ounce. The IGD Expansion growth capital of $542 million will be spent on the expansion of the Magino mill to 20,000 tpd, accelerated underground development, and mobile equipment to support higher underground and open pit mining rates of 3,000 tpd and 17,000 tpd, respectively.
As outlined in the IGD Expansion Study, the Island Gold mill will continue operating and will be dedicated to processing approximately 1,265 tpd of higher grade underground ore until the expected completion of the Magino mill expansion in the first quarter of 2028. The remaining underground ore mined, beyond the Island Gold mill capacity of 1,265 tpd, will be blended at increasing rates with open pit ore and processed within the Magino mill. As of June 30, 2026, 33% of growth capital related to the IGD Expansion has been spent and committed, with the majority of spending focused on the Magino mill expansion.
During the second quarter of 2026, the Company spent $65.7 million in growth capital at the Island Gold District. Progress during the second quarter is summarized as follows:
- Commissioning of the water handling facility
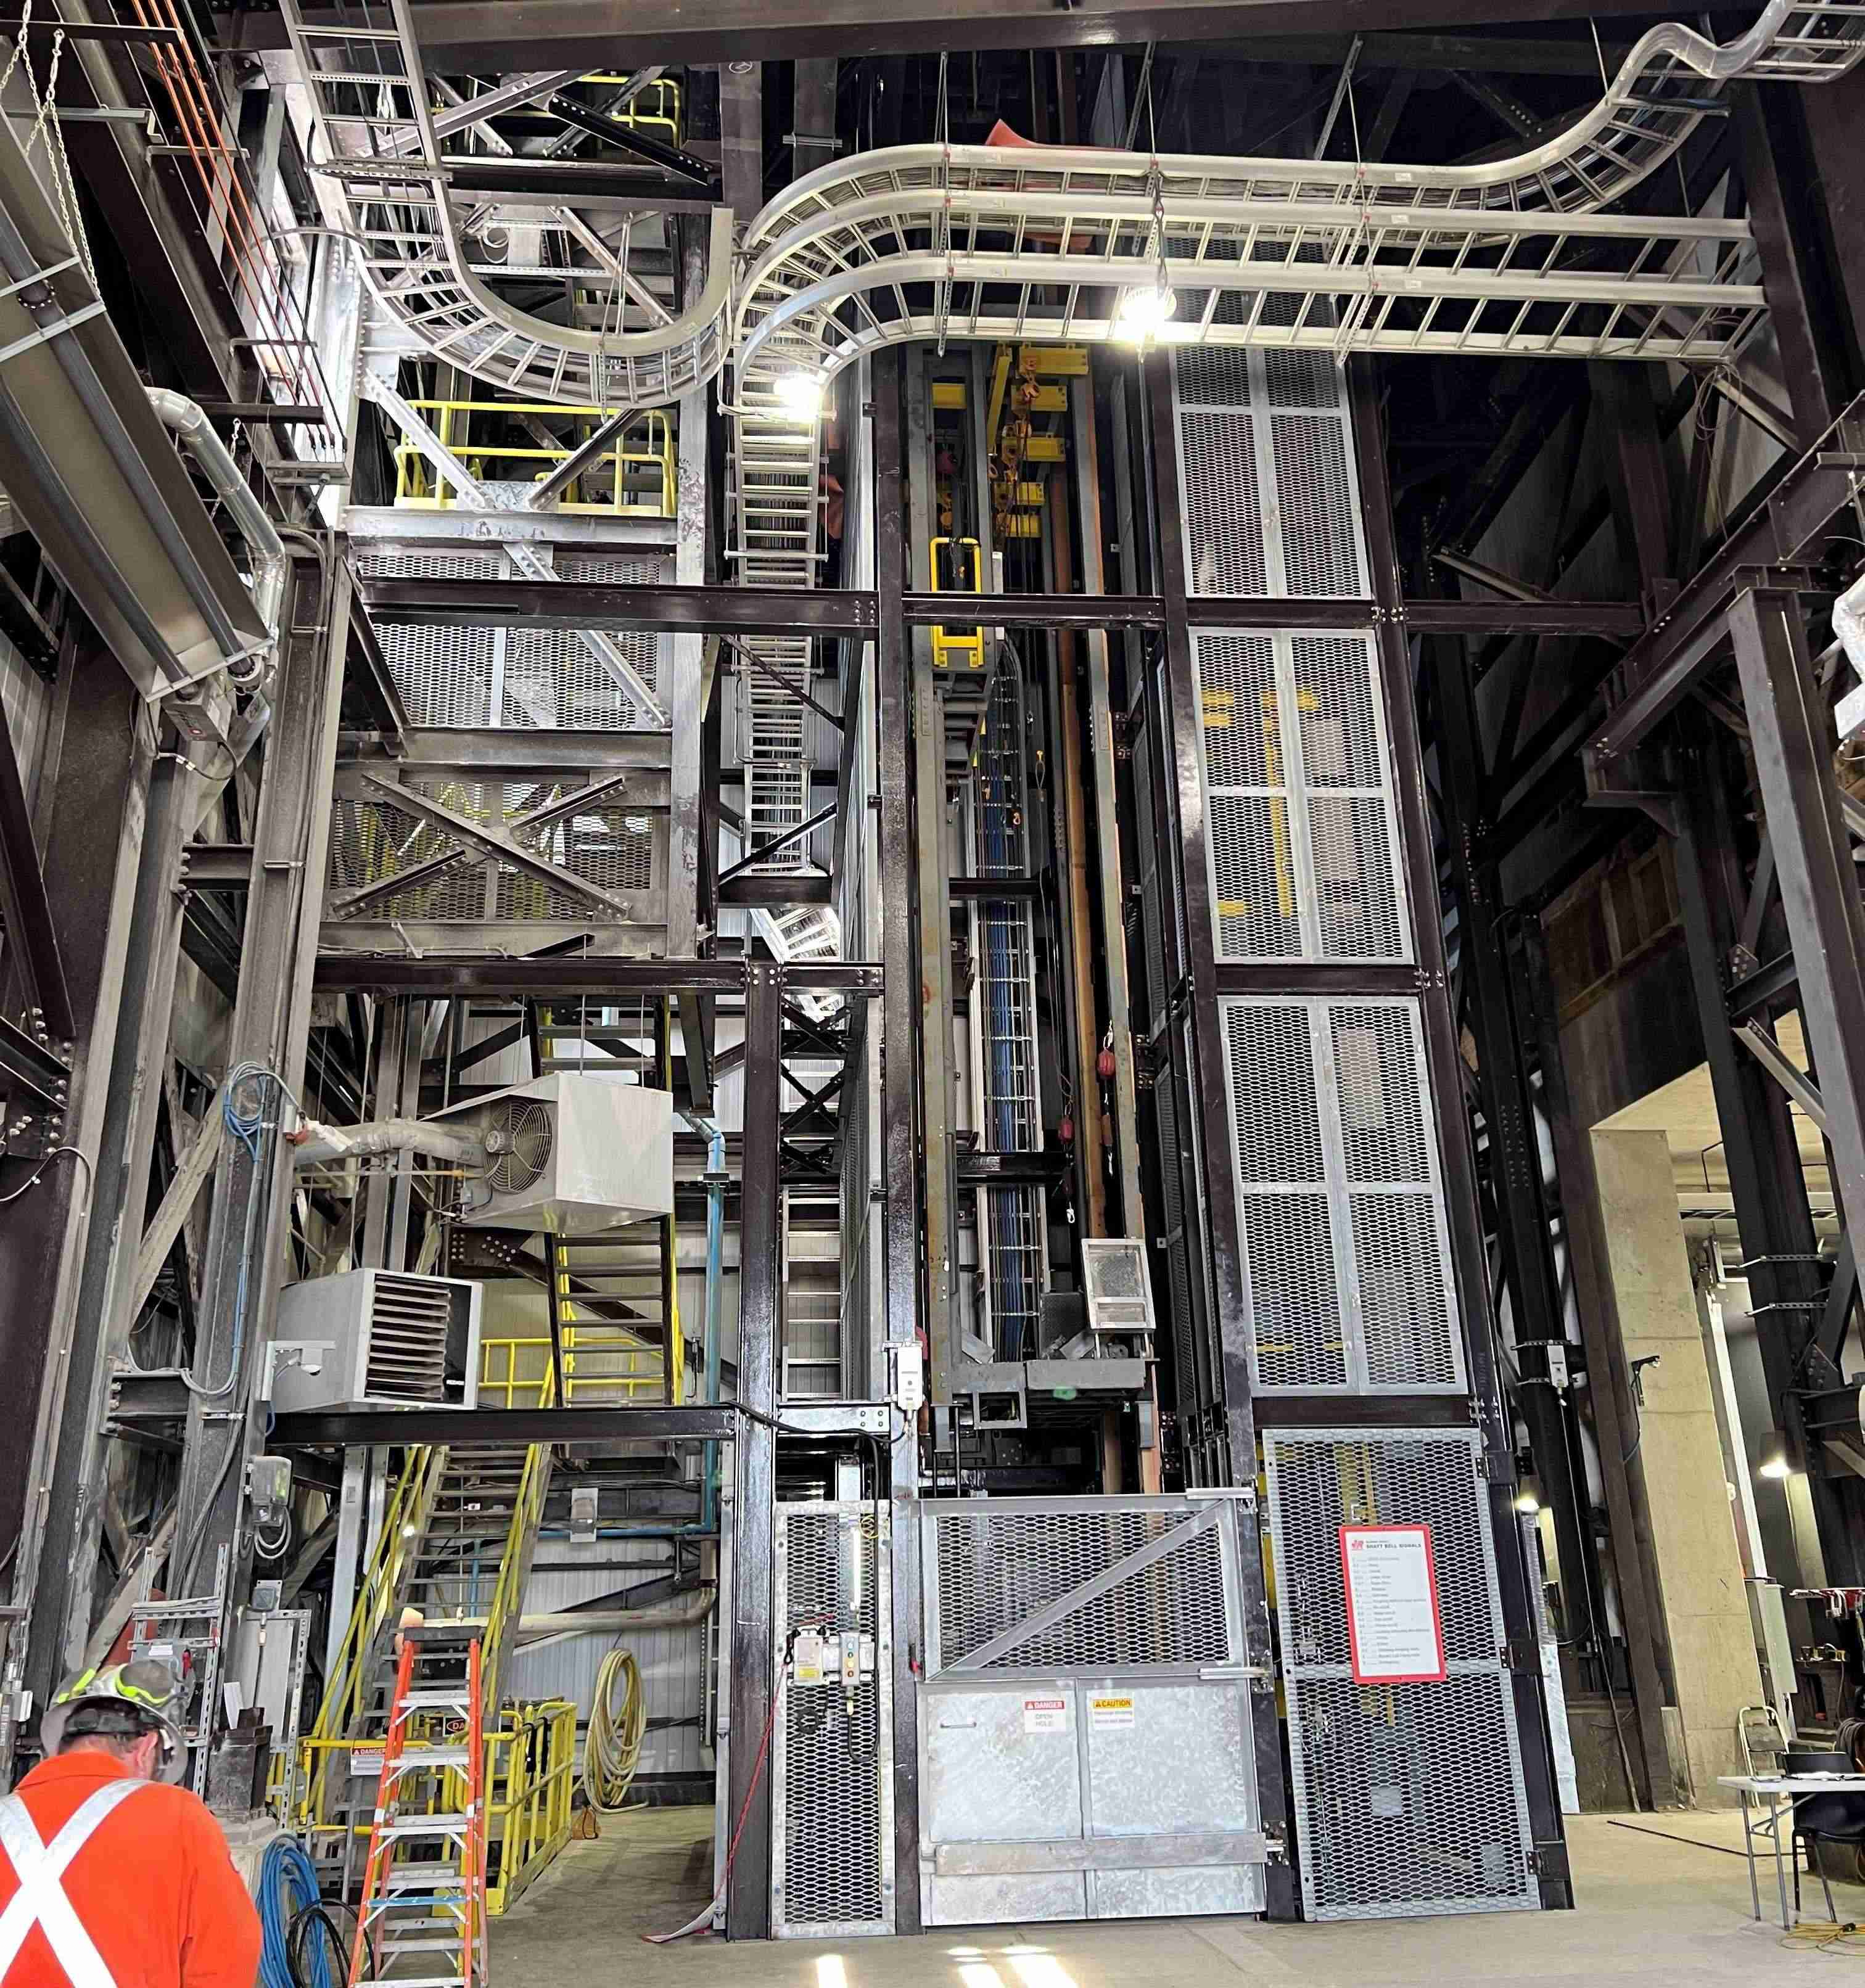
- Commenced shaft equipping with expected completion in the fourth quarter of 2026, in advance of shaft commissioning in the first quarter of 2027
- Magino mill expansion to 20,000 tpd is progressing well with cladding and roofing activities for the new mill building completed, and all eight leach tanks and two detox tanks erected and welded
- All long lead time items have been ordered and in fabrication, including the SAG and ball mill, and gyratory crusher
- Paste plant construction substantially complete with commissioning expected to commence in the fourth quarter of 2026
- Completed exterior cladding and roofing for new administrative complex with interior outfitting underway
- Advanced lateral development in support of the ramp up of underground mining rates through 2026
Construction of shaft and surface infrastructure is expected to be substantially complete by the end of 2026, and commissioning of the shaft completed in the first quarter of 2027. The IGD Expansion to 20,000 tpd remains on track to be completed in the first quarter of 2028.
| Phase 3+ Expansion Estimate Growth capital (in US$M) | February 20261 | Spent to date1,2 | Committed to date1 | % of Spent & Committed |
| Shaft & Shaft Surface Complex | $324 | $289 | $20 | 95% |
| Accelerated Underground Development, Infrastructure, and Equipment | 255 | 236 | 18 | 100% |
| Site Infrastructure, Mill and Other3,4 | 165 | 172 | 8 | 109% |
| General Indirect Costs | 91 | 91 | — | 100% |
| Total Phase 3+ Shaft Expansion Growth Capital | $835 | $788 | $46 | 100% |
| IGD Expansion Estimate Growth capital (in US$M) | February 20261 | Spent to date1,2 | Committed to date1 | % of Spent & Committed |
| Mill Expansion | $199 | $50 | $39 | 45% |
| Accelerated Underground Development | 166 | 14 | — | 8% |
| Mining Equipment | 81 | 3 | 17 | 25% |
| Site Infrastructure and Other | 96 | — | 57 | 59% |
| Total IGD Expansion Growth Capital | $542 | $67 | $113 | 33% |
| 1. | Reflects updated capital estimates released in February 2026 as part of the IGD Expansion, based on USD/CAD exchange $0.74:1. Spent to date based on average USD/CAD of $0.73:1 since the start of 2022. Committed to date based on the spot USD/CAD rate as at June 30, 2026 of $0.70:1. |
| 2. | Amount spent to date accounted for on an accrual basis, including working capital movements. |
| 3. | Spent to date includes components for Magino mill expansion to 20,000 tpd which were not included in P3+ Estimate. |
| 4. | Includes power upgrade spent to-date on a 100% basis and does not reflect partner’s contributions. |
Island Gold shaft site area - July 2026

Island Gold paste plant - July 2026
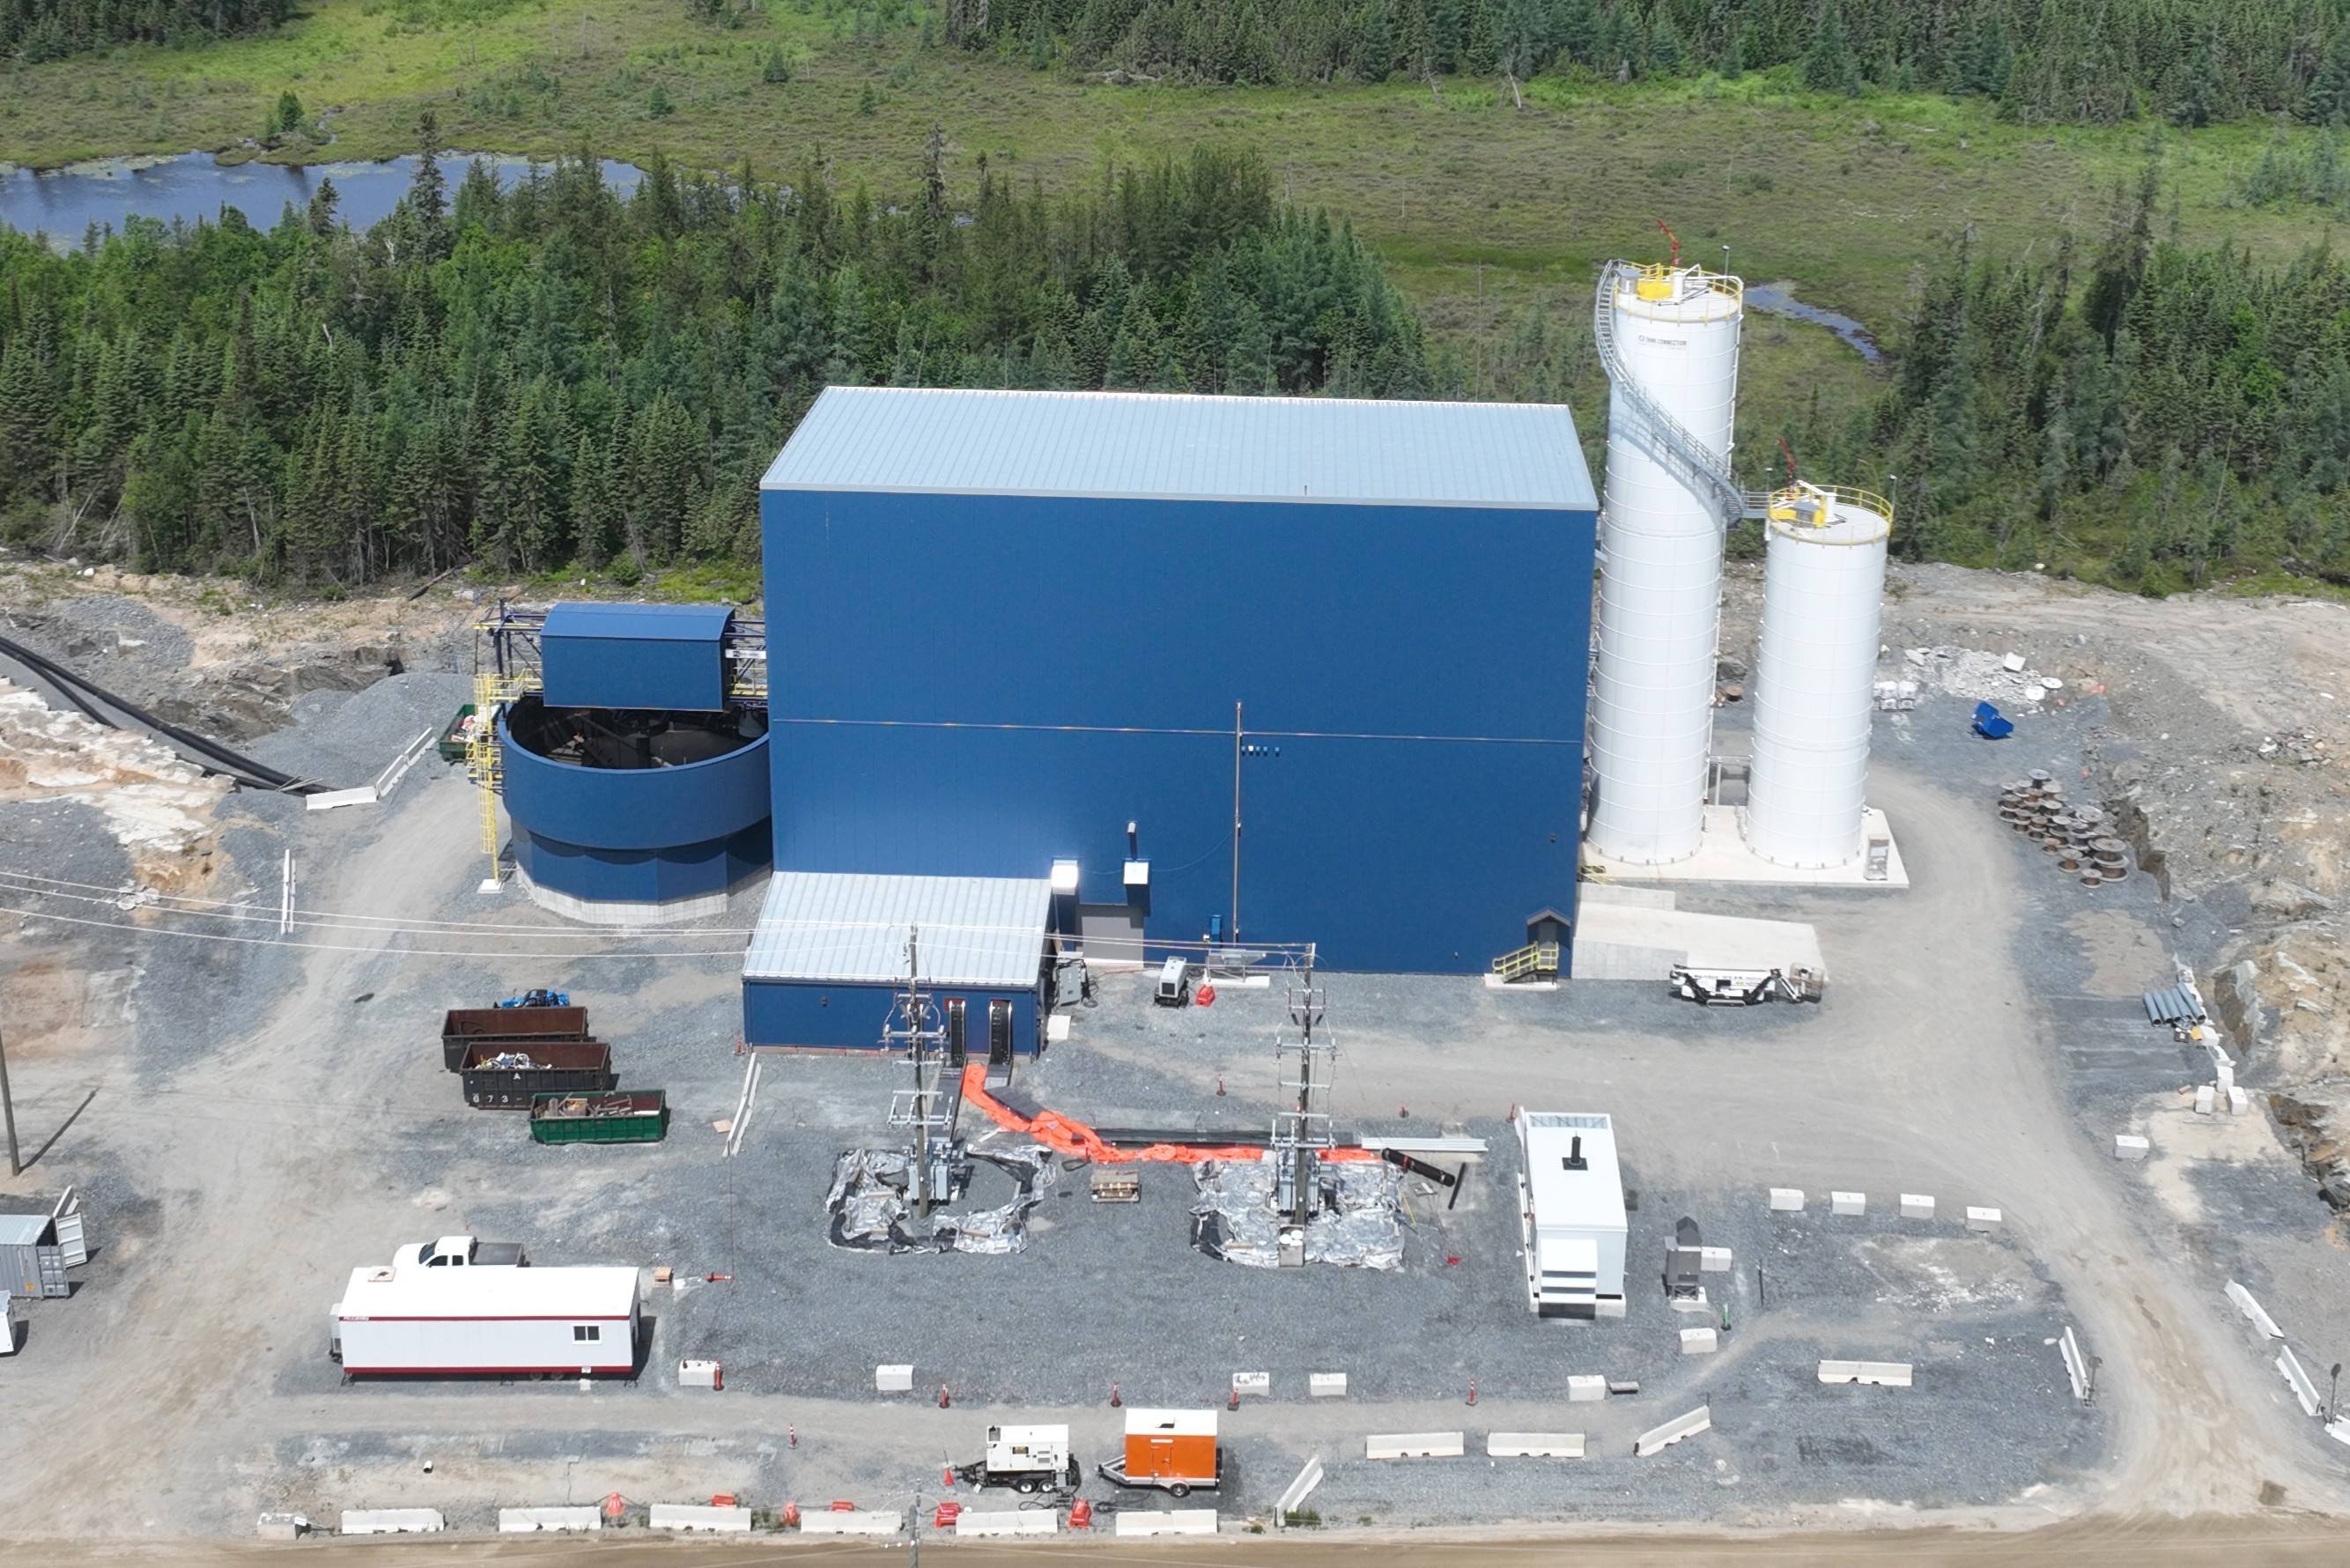
Headframe changeover from sinking to equipping - July 2026
Magino mill expansion - July 2026
Lynn Lake (Manitoba, Canada)
On January 13, 2025, the Company announced a positive construction decision on the Lynn Lake project. With the approval of the Closure Plan in January 2025, the required permitting and pre-construction conditions have been met allowing for the start of construction on the project.
In February 2025, an internal economic study and development plan was released on the BT and Linkwood satellite deposits located in proximity to the Lynn Lake project. In February 2026, an updated development plan for the Lynn Lake project was announced incorporating the BT and Linkwood deposits. Given the significantly longer mine life, the Company re-engineered and optimized a number of elements within the broader development plan. This included several scope changes, most notably increasing the mill capacity by 13% to 9,000 tpd, driving production higher and stronger economics.
Reflecting scope changes to support a larger operation, three years of inflation since the 2023 Feasibility Study, and the longer construction timeline due to the 2025 wildfires, initial capital for the project was increased to $937 million, with $871 million remaining to be spent as of the start of 2026.
The updated parameters for the Lynn Lake project, incorporating the revised initial capital, larger Mineral Reserve base including BT and Linkwood, and increased mill throughput, are as follows:
- Average annual production of 186,000 ounces over the initial 10 years
- Low mine-site AISC of $829 per ounce over the initial 10 years ($1,039 per ounce over the life of mine)
- Long mine life of 25 years with total production of three million ounces (based on Mineral Reserves at the end of 2024)
- Attractive economics with significant near-mine and regional exploration upside
Capital spending on the Lynn Lake project in 2026 is expected to be between $140 and $160 million, which will be second half-weighted. Construction activities in 2026 include permanent camp construction, bulk earthworks, power infrastructure upgrades, and orders for long lead-time items.
The majority of initial capital will be spent in 2027 and 2028, with first production expected in the first half of 2029. With attractive economics and significant exploration upside, the Lynn Lake project is a key component of the Company’s leading high-return organic growth profile.
Near the end of June 2026, an evacuation order was issued for the town of Lynn Lake due to wildfire activity in the region. As a result, Alamos personnel and contractors were evacuated, however, the project's emergency response team remained in Lynn Lake to support firefighting efforts. The evacuation order was lifted the first week in July with the project team and contractors returning shortly after. There were no injuries or damage to property and infrastructure as a result of the fires, and the project timelines remain unchanged.
During the second quarter of 2026, the Company spent $36.2 million in development capital at the Lynn Lake project, with key activities summarized as follows:
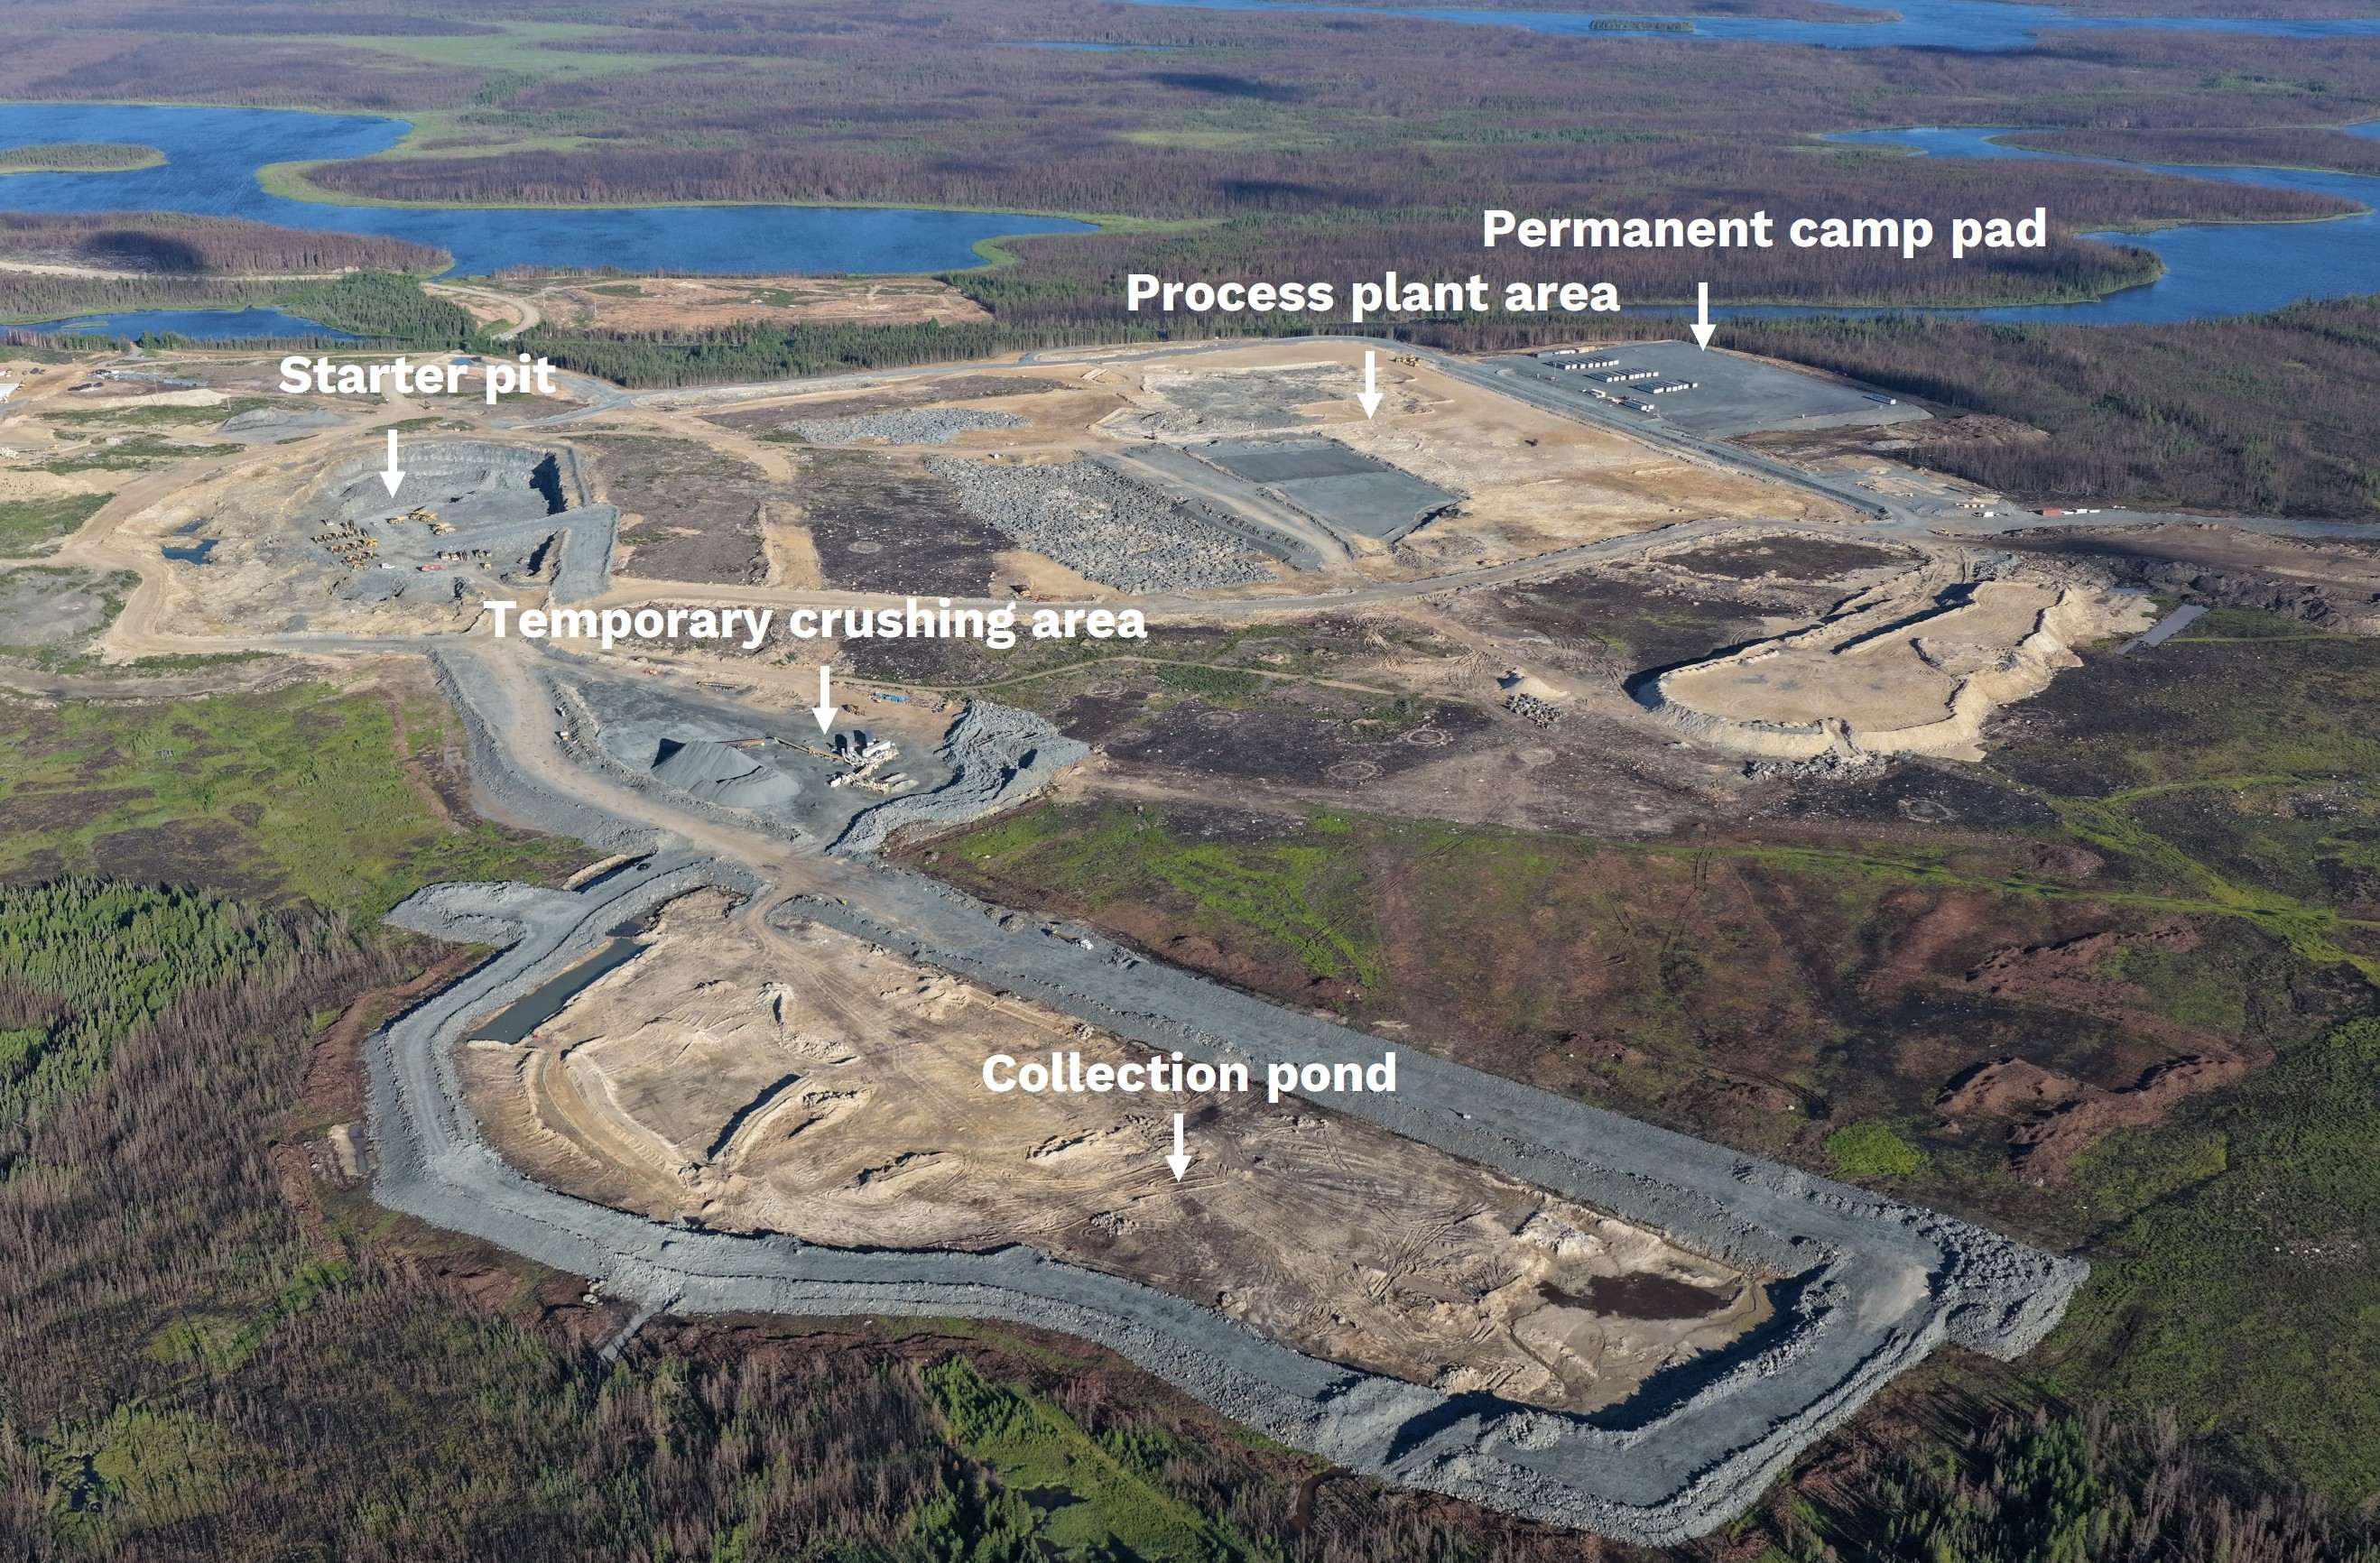
- Completed expansion of the temporary camp
- Completed permanent camp pad development and advanced module installation
- Progressed process plant site preparation and earthworks to support mill construction
- Advanced water containment, treatment, and intake infrastructure development
- Continued site-wide infrastructure construction, including roads, laydown areas, and explosive storage
- Advanced drill and blasting activities for the starter pit at MacLellan
- Expanded the site workforce to support planned construction activities
Lynn Lake project - July 2026
PDA (Sonora, Mexico)
On September 4, 2024, the Company reported the results of the development plan for the PDA project located within the Mulatos District. PDA is a higher-grade underground deposit adjacent to the Mulatos open pit and will benefit from the use of existing crushing infrastructure from Cerro Pelon, supporting lower initial capital and project execution risk.
In January 2025, the Company announced it was granted approval of an amendment to its existing environmental impact assessment (Manifestación de Impacto Ambiental) by Mexico’s Secretariat of Environment and Natural Resources, allowing for the start of construction on the PDA project. Total initial capital estimate of $165 million remains unchanged with the majority of spending expected in 2026, and first production on track for mid-2027.
As outlined in the 2024 development plan, PDA is expected to produce an average of 127,000 ounces per year over the first four years and 104,000 ounces over the current mine life. Total cash costs are expected to average $921 per ounce and mine-site AISC $1,003 per ounce.
Reflecting the low cost structure and low initial capital, PDA is expected to be a high-return project with significant exploration upside. Based on the development plan released in September 2024, PDA has an estimated after-tax IRR of 46% and after-tax NPV (5%) of $269 million using base case gold price assumption of $1,950 per ounce and a MXN/USD foreign exchange rate of 18:1. Using a $2,500 per ounce gold price, PDA's after-tax IRR increases to 73%, and after-tax NPV (5%) increases to $492 million.
During the second quarter of 2026, the Company spent $21.0 million in growth capital at the PDA project, with key activities summarized as follows:
- Completed detailed engineering for the process plant
- Finalized all major equipment purchase orders
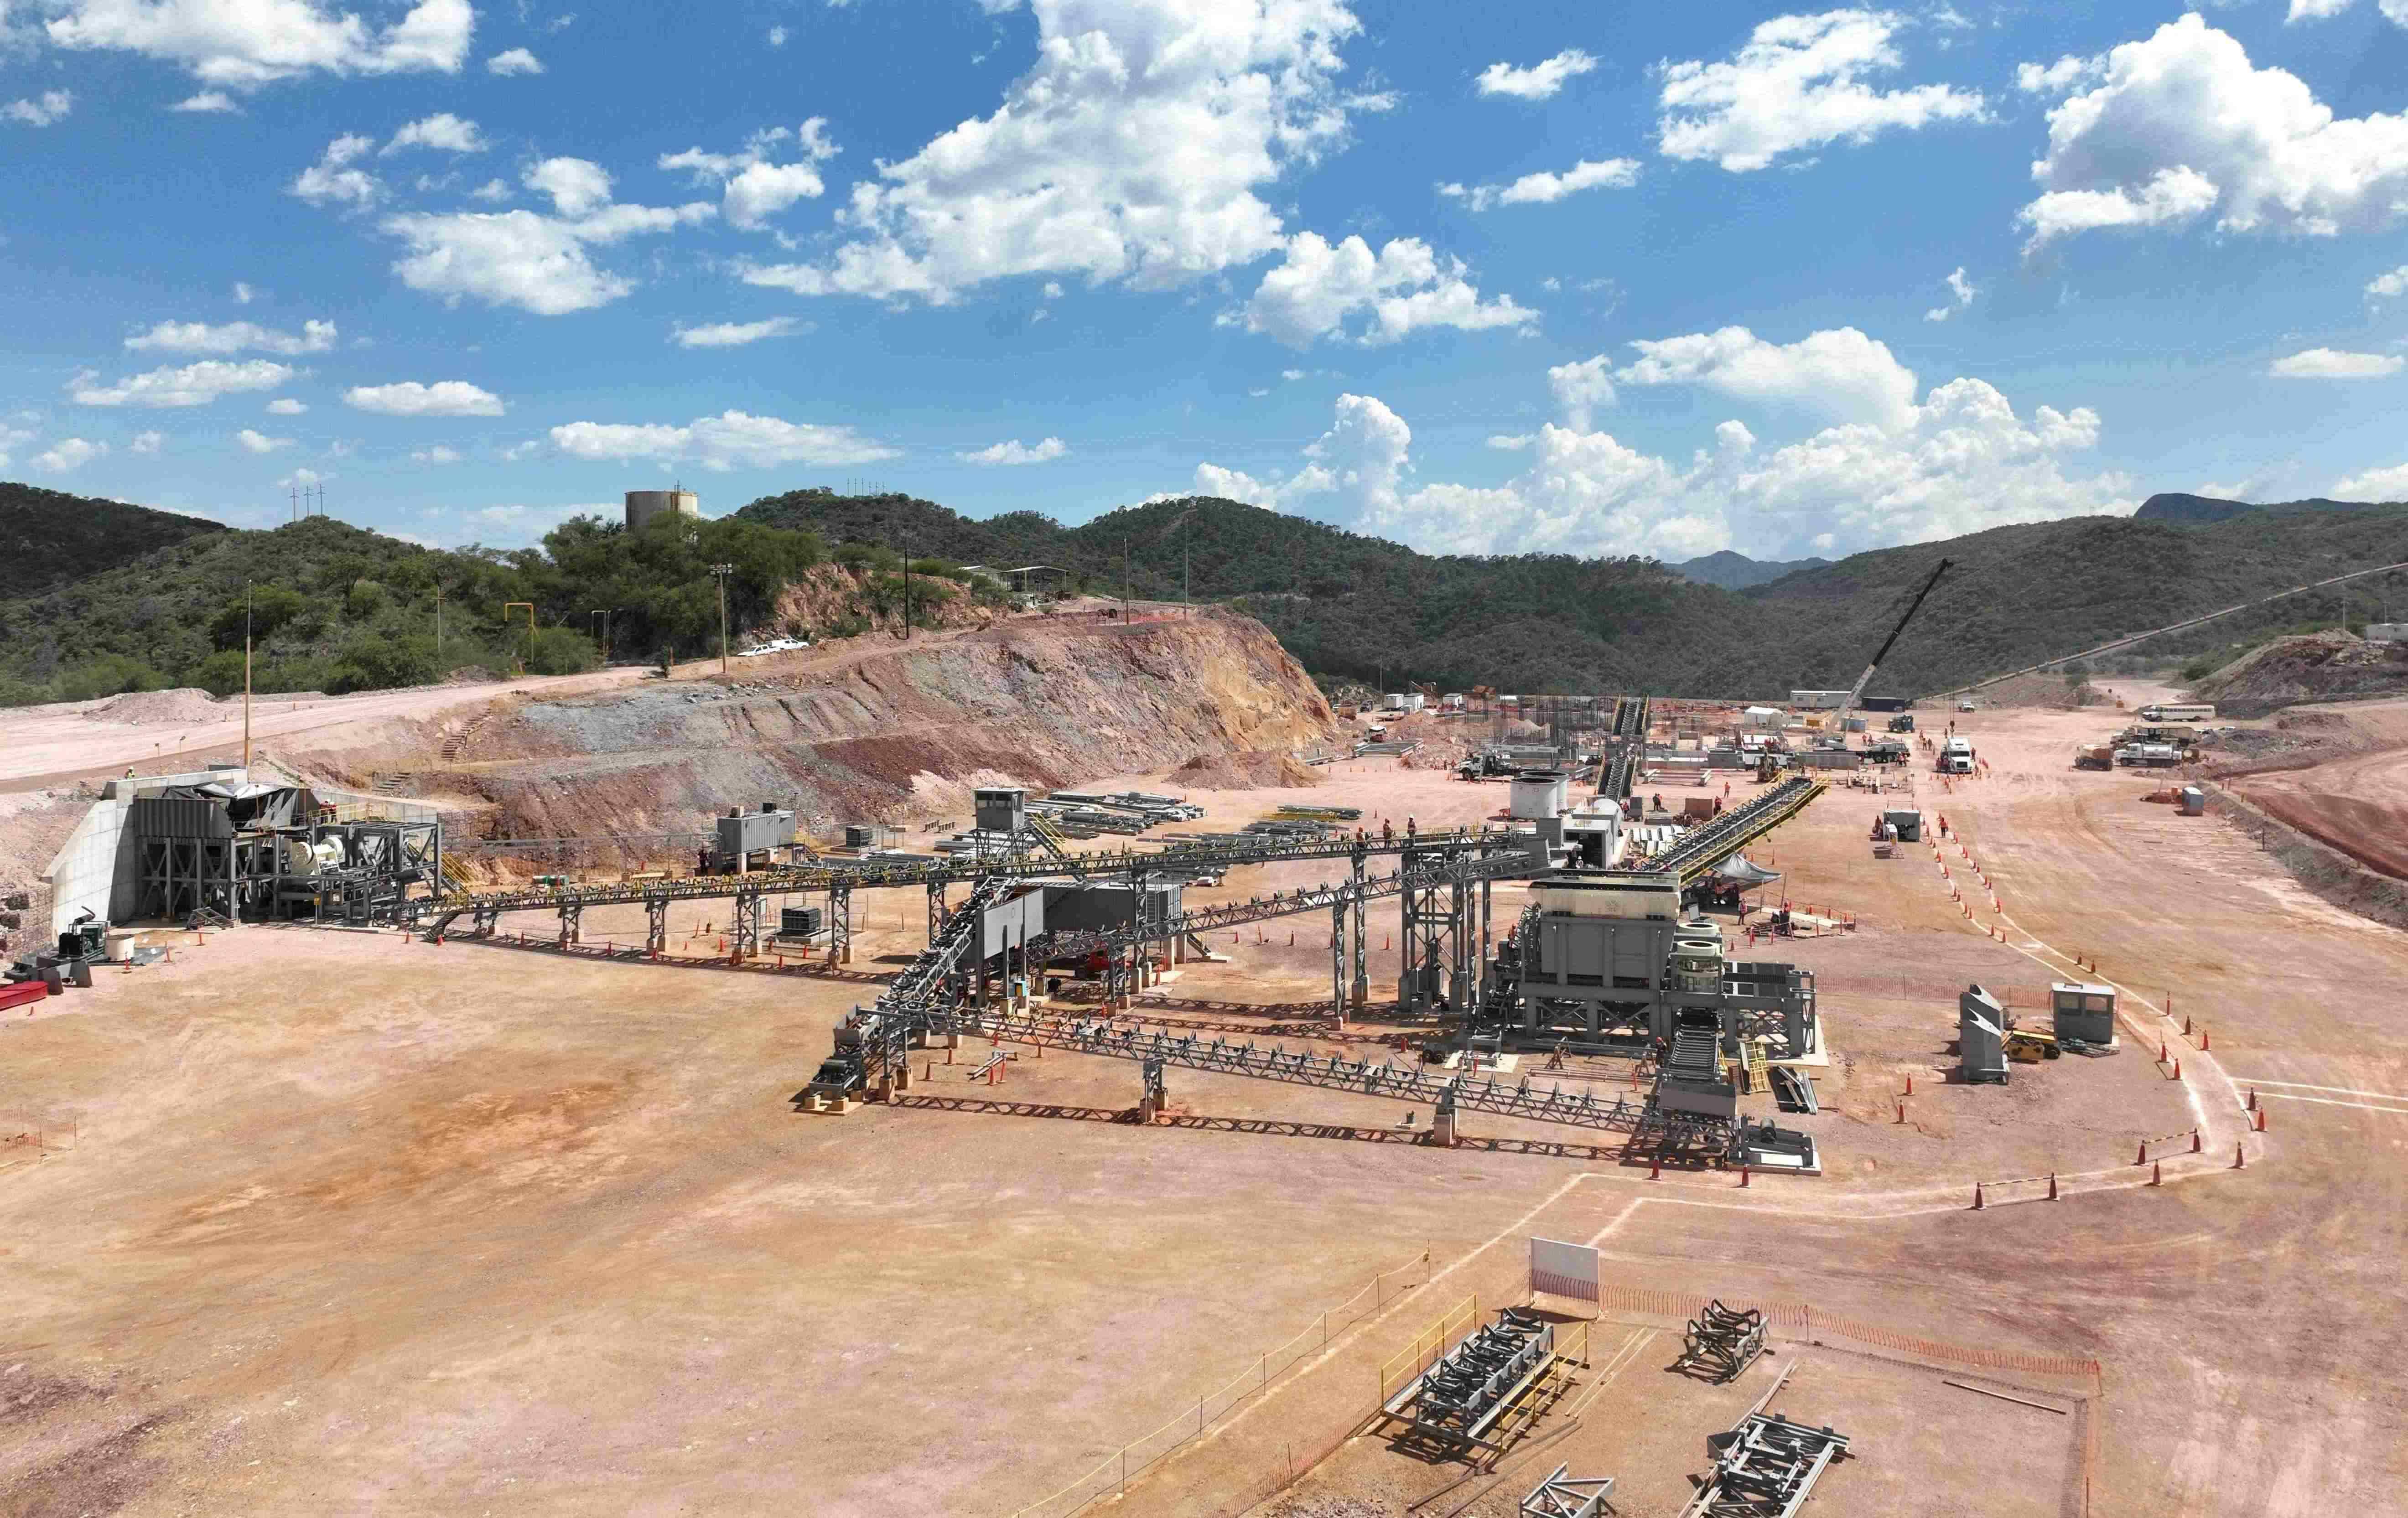
- Completed dry area earthworks and crushing circuit concrete foundation
- Commenced wet area concrete works and advanced construction of the ball mill foundation
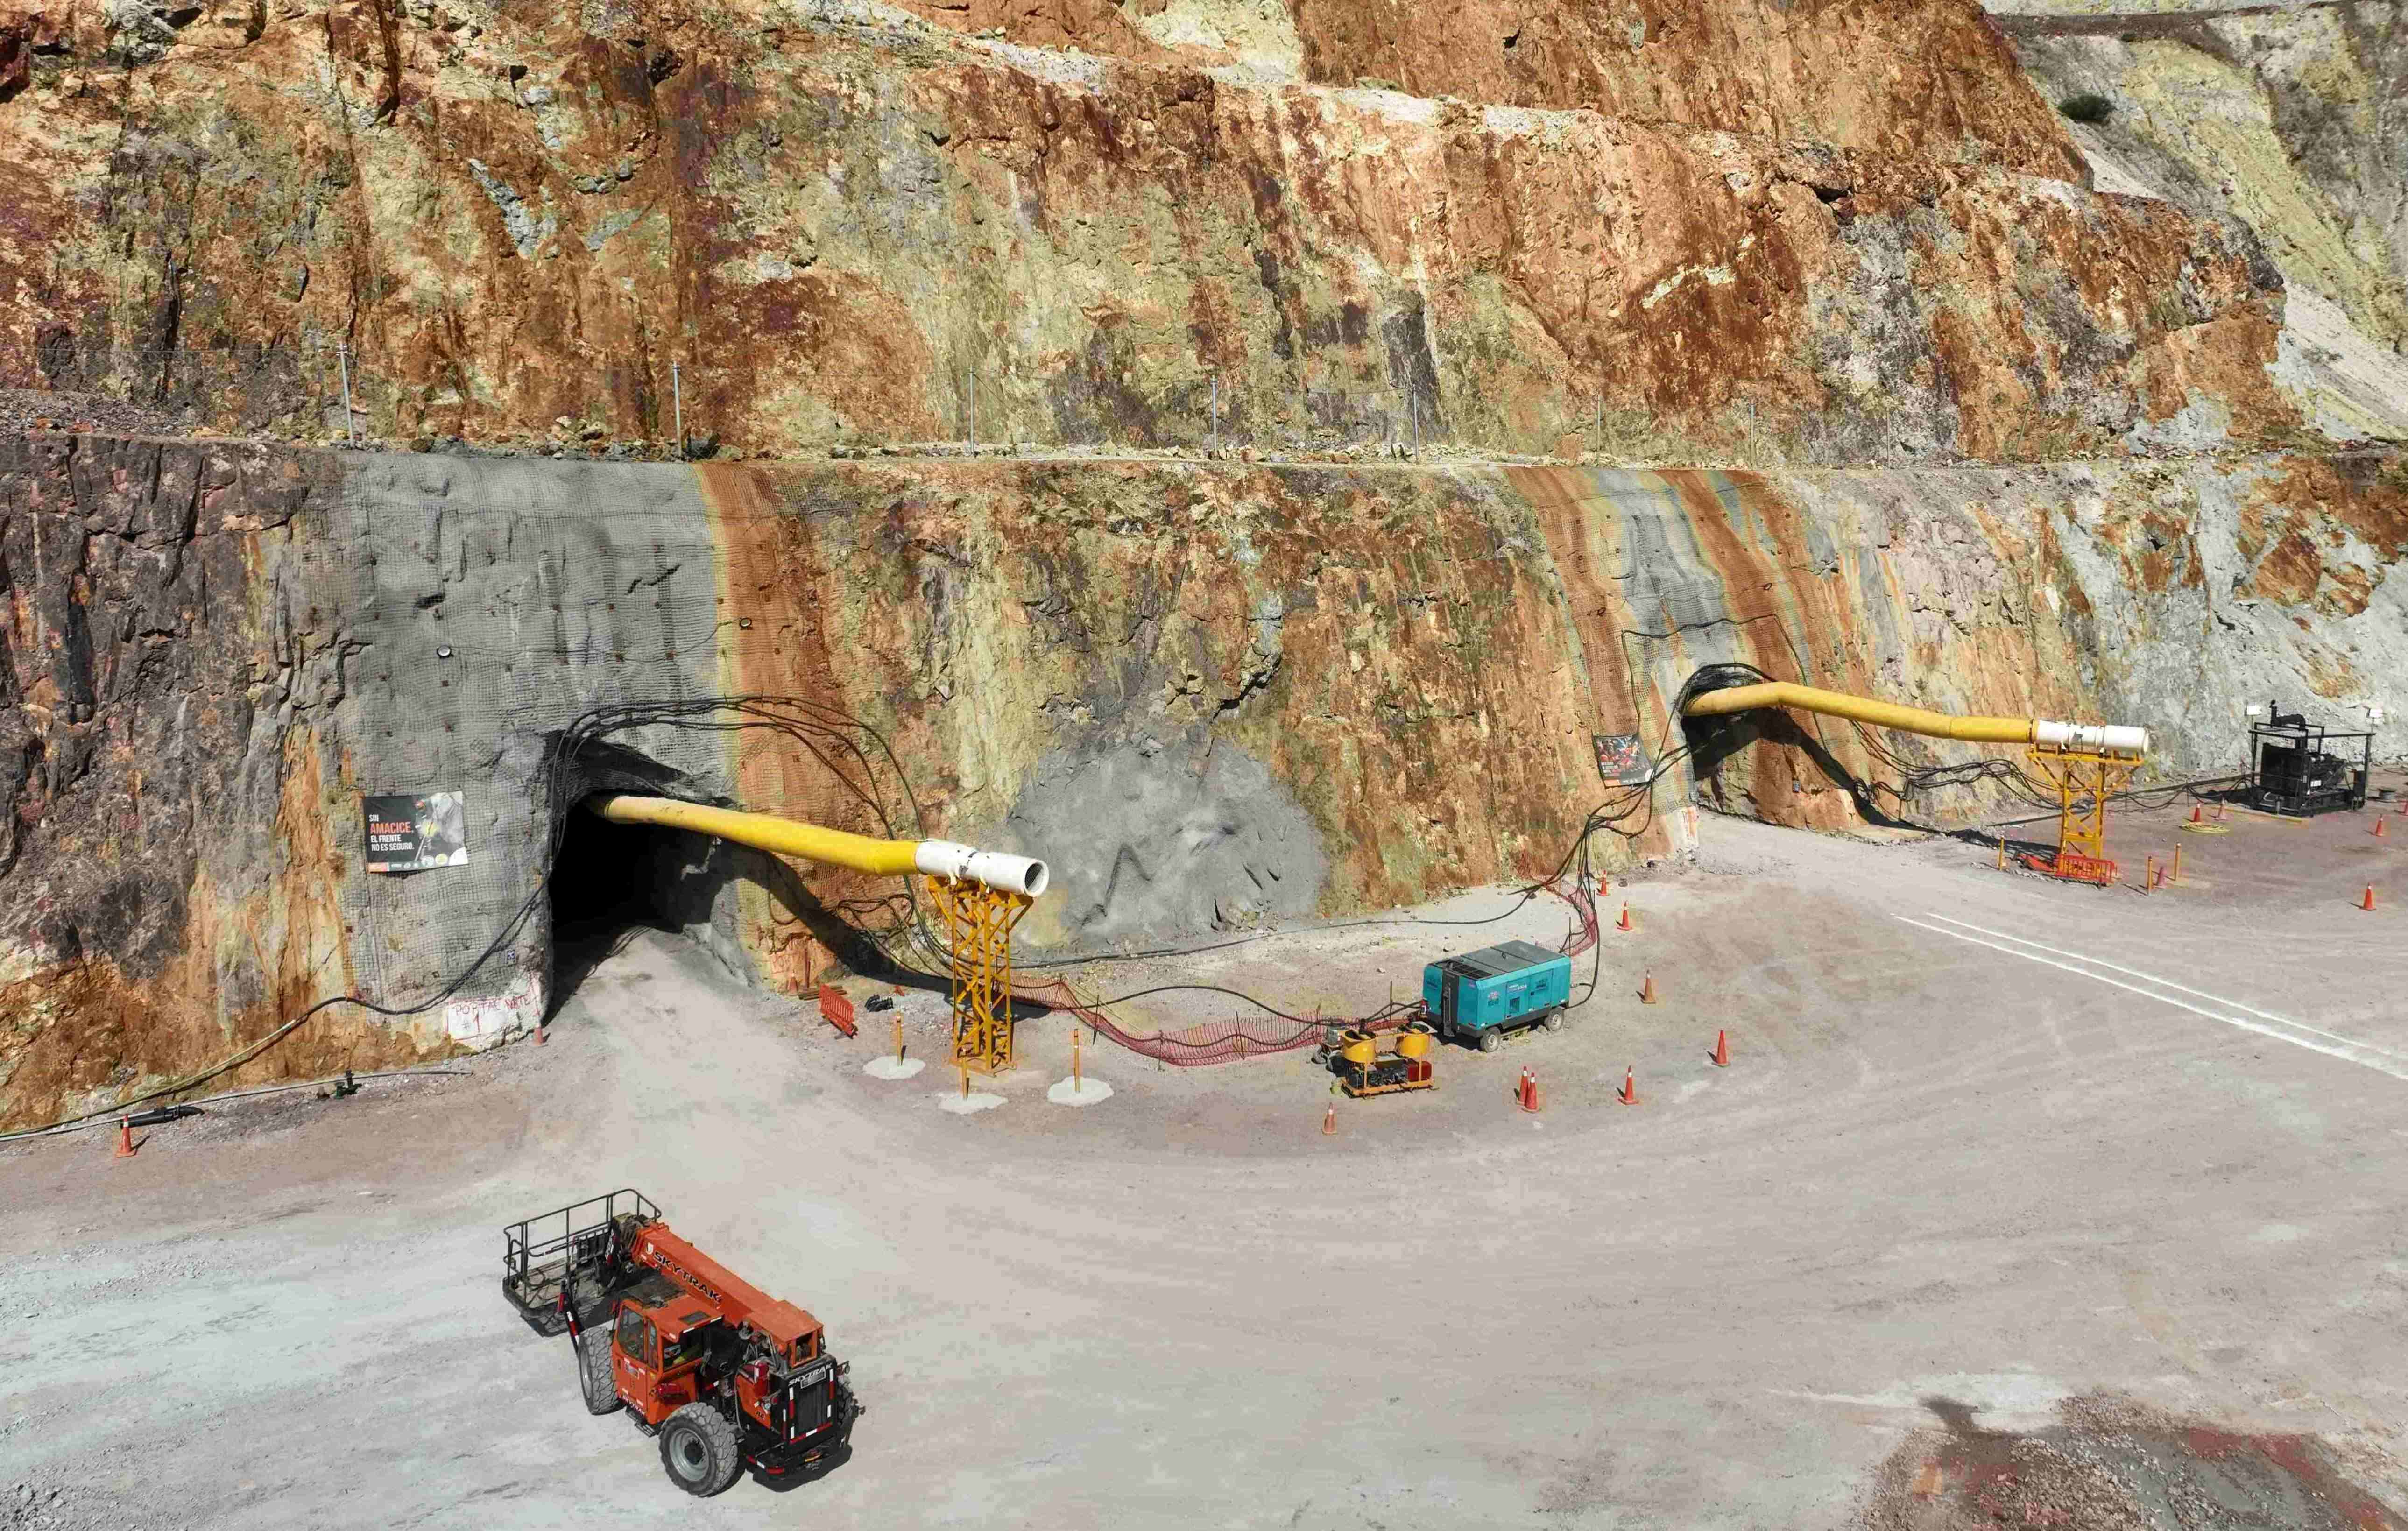
- Completed portal ground support, platform earthworks, and installation of dynamic barriers
- Advanced underground mine development with 284 m completed during the second quarter
PDA portals - July 2026
PDA crusher and mill area - July 2026
Second Quarter 2026 Exploration Activities
Island Gold District (Ontario, Canada)
A total of $43 million has been budgeted for exploration at the Island Gold District in 2026, up from $24 million spent in 2025. The exploration program will continue to build on the success from 2025 with high-grade gold mineralization extended across the Island Gold deposit, as well as within multiple structures within the hanging wall and footwall.
In 2025, drilling programs at Island Gold and Magino focused on delineation drilling to convert the large Inferred Mineral Resource base to Mineral Reserves. This program was executed successfully and resulted in a significant increase in Mineral Reserves at both Island Gold and Magino, which was incorporated into the IGD Expansion that was announced on February 3, 2026. With the deposit open laterally and at depth, there is significant potential for further growth in Mineral Reserves and Resources.
A total of 50,000 m of underground exploration drilling is planned in 2026 with a focus on defining new Mineral Reserves and Resources in proximity to existing production horizons and infrastructure. This includes drilling across the strike extent of main Island Gold deposit (E1E and C-Zones), as well as within a growing number of newly defined hanging-wall and footwall zones.
These potential high-grade Mineral Reserve and Resource additions would be low cost to develop, given their proximity to existing infrastructure, and provide increased operational flexibility as mining rates increase. To support the underground exploration program, 1,090 m of underground exploration drift development is planned to extend drill platforms on multiple levels.
Additionally, 48,000 m of surface exploration drilling has been budgeted targeting the area between the Island Gold and Magino deposits, as well as the down-plunge extension of the Island Gold deposit, below a depth of 1,500 m.
The regional exploration program at the Island Gold District includes 16,000 m of surface drilling. The focus of the regional program will be following up on high-grade mineralization intersected in the 2025 drill program at Cline and Pick located approximately seven km northeast of the Island Gold mine.
During the second quarter of 2026, 11,508 m of underground exploration drilling was completed in 42 holes, and 8,379 m of underground delineation drilling across 36 holes. Additionally, 14,497 m of surface exploration drilling was completed in 19 holes. Year to date, 20,955 m of underground exploration drilling was completed in 76 holes, and 12,510 m of underground delineation drilling across 54 holes. Additionally, 17,863 m of surface exploration drilling was completed in 25 holes.
As part of the regional exploration program, 4,288 m of drilling was completed in eight holes at Cline-Pick in the second quarter. Year to date, 8,647 m of drilling has been completed in 15 holes at Cline-Pick.
As detailed in the June exploration update (see press release dated June 22, 2026), high-grade mineralization was extended across multiple areas which are being targeted as sources of additional higher-grade mill feed within the expanded Magino mill. This includes defining a new zone of high-grade mineralization 250 m west of underground Mineral Reserves and Mineral Resources (Island Gold West Extension), and continuing to extend high-grade mineralization within the Island West up-plunge area, and the past producing Cline-Pick and Edwards mines. These targets represent opportunities for further production growth by increasing the proportion of higher-grade ore to be fed within the expanded Magino mill.
Total exploration expenditures during the second quarter were $8.4 million, of which $6.8 million was capitalized. In the first half of the year, the Company incurred exploration expenditures of $13.6 million, of which $10.2 million was capitalized.
Young-Davidson (Ontario, Canada)
A total of $17 million has been budgeted for exploration at Young-Davidson in 2026, up from $13 million spent in 2025. This includes 48,000 m of underground exploration drilling focused on extending mineralization within the Young-Davidson syenite, which hosts the majority of Mineral Reserves and Mineral Resources, and to test and expand on gold mineralization that has been intersected within two areas of focus in the hanging wall. This new style of mineralization is located in close proximity to the existing mid-mine infrastructure.
The regional program includes 10,000 m of drilling focused on evaluating several targets including the Otisse NE target and the Biralger target located approximately 3 km and 17 km northeast of Young-Davidson, respectively. A comprehensive data compilation project commenced in 2025, and will be completed in 2026 for the Wydee and Matachewan projects, both acquired in 2024, and located in proximity to Young-Davidson.
During the second quarter, 15,335 m of underground exploration drilling was completed in 48 holes across multiple levels. Drilling is targeting syenite-hosted mineralization, as well as continuing to test mineralization in the hanging wall sediments and mafic-ultramafic stratigraphy. Year to date, 28,969 m of drilling was completed in 80 holes. The seismic event that occurred at Young-Davidson in June is not expected to impact exploration activities in the second half of 2026.
A total of 4,865 m of regional surface exploration drilling was also completed in 16 holes in the first quarter focused on evaluating the Otisse NE and Biralger targets. No regional exploration drilling was undertaken in the second quarter.
Total exploration expenditures during the second quarter of 2026 were $3.9 million, of which $2.7 million was capitalized. For the first half of the year, exploration expenditures totaled $8.8 million, of which $6.1 million was capitalized.
Mulatos District (Sonora, Mexico)
A total of $21 million has been budgeted at Mulatos for exploration in 2026, consistent with $20 million spent in 2025. The regional drilling program is expected to total 44,500 m and includes 20,000 m of surface exploration drilling at the Cerro Pelon sulphide target, 9,000 m at the recently discovered Halcon target, and an additional 15,500 m planned across several early to advanced stage targets within the Mulatos District. The planned addition of a mill to process higher-grade sulfides has created new opportunities for growth within the Mulatos District, including Cerro Pelon and the Halcon target.
During the second quarter, 9,083 m of surface exploration drilling was completed in 28 holes at Cerro Pelon, and 4,021 m were completed in 12 holes at Halcon. Additionally, 3,848 m were drilled in 12 regional holes across the district. Year to date, 28,788 m have been drilled at Mulatos in 182 drill holes.
Total exploration expenditures during the second quarter were $6.5 million, of which $3.1 million was capitalized. For the first half of the year, exploration expenditures totaled $11.6 million, of which $5.3 million was capitalized.
Lynn Lake (Manitoba, Canada)
A total of $6 million has been budgeted for exploration at the Lynn Lake project in 2026. This is up from $3 million spent in 2025. The exploration budget includes 13,500 m to test the potential for underground mining opportunities below the Gordon and MacLellan open pits.
During the second quarter, 2,434 m of exploration drilling was completed in two holes at MacLellan, completing the planned drill program for 2026. In total, 13,740 m of drilling was completed in 25 holes at the Gordon and MacLellan deposits.
Exploration spending totaled $2.4 million in the second quarter and $4.5 million for the first half of the year, all of which was capitalized.
Qiqavik (Quebec, Canada)
A total of $7 million has been budgeted for exploration at the Qiqavik project in 2026, similar to 2025. Qiqavik is a camp-scale property covering 60,400 ha in the Cape Smith Greenstone Belt in Nunavik, Quebec. The Qiqavik project covers 50 km of strike covering prospective gold hosting environments and several major crustal-scale structures such as the Qiqavik break and the Bergeron fault. Early-stage exploration completed to date indicates that high-grade gold occurrences are controlled by structural splays off the Qiqavik Break.
The 2026 exploration program will follow up on discoveries made across several target areas during the 2025 drill program, and test the next series of highest priority targets as outlined in a press release dated January 28, 2026. The success of this early-stage greenfield drilling program across multiple target areas continues to support the significant gold endowment potential of the Qiqavik project.
A total of 8,000 m of helicopter-supported exploration drilling is planned in the third quarter of 2026. The 2026 program will also focus on advancing other targets across the belt with ongoing geological mapping, drone magnetics, prospecting, and additional till sampling.
Exploration spending was $1.1 million in the second quarter and $1.8 million for the first half of the year, all of which was expensed.
Review of Second Quarter Financial Results
During the second quarter of 2026, the Company sold 130,834 ounces of gold for operating revenues of $594.1 million, representing a 36% increase from the prior year period. The increase was due to higher realized gold prices partially offset by lower ounces sold at Young-Davidson and the Mulatos District.
The average realized gold price in the second quarter was $4,504 per ounce, 40% higher than the prior year period. This was consistent with the London PM Fix price for the quarter.
Cost of sales (which includes mining and processing costs, inventory net realizable value adjustment, royalties, and amortization expense) were $231.9 million in the second quarter, 16% higher than the prior year period. Key drivers of changes to cost of sales as compared to the prior year period were as follows:
Mining and processing costs were $164.8 million, 17% higher than the prior year period. The increase primarily reflects higher contractor costs, ongoing labour inflation, and higher diesel costs, partially offset by the weaker Canadian dollar.
Total cash costs of $1,303 per ounce and AISC of $1,728 per ounce were higher than the prior year period, driven by the same factors as above, as well as lower grades processed at Young-Davidson and La Yaqui Grande.
The Company assesses the net realizable value of inventory at each reporting period. Given the decrease in the gold price at the end of the second quarter, and higher processing costs at Mulatos, the Company recorded an adjustment of $10.8 million ($7.0 million after tax) in the quarter to reduce the carrying value of Mulatos leach pad inventory.
Royalty expense was $6.8 million in the second quarter, in line with the prior year period of $7.6 million.
Amortization of $49.5 million, or $378 per ounce sold in the second quarter, was 6% lower than the prior year period, primarily reflecting an increase in the depletion base resulting from the 2025 year-end Mineral Reserves and Resources update.
The Company recognized earnings from operations of $357.3 million in the second quarter, 65% higher than the prior year period, driven by higher revenues and margin expansion.
In the second quarter, the Company recognized a net gain on commodity derivatives of $40.3 million, compared with net losses of $25.8 million in the prior year period. This was primarily driven by the mark-to-market revaluation of the 2027 legacy Argonaut hedges as gold prices declined during the quarter, partially offset by a realized loss on the early settlement of the remaining 2026 legacy Argonaut hedges.
During the quarter, the Company eliminated 35,000 ounces of the legacy Argonaut hedges, scheduled to mature in the second half of 2026. The cost to eliminate the hedges was $92.3 million, representing an effective price of $4,458 per ounce.
The Company reported net earnings of $270.4 million in the second quarter, compared to $159.4 million in the prior year period. Adjusted net earnings include an after-tax adjustment for net gain on commodity hedge derivatives of $27.4 million, an inventory net realizable value adjustment of $7.0 million, net of tax, adjustments for net unrealized foreign exchange gains recorded within deferred taxes and foreign exchange totaling $3.6 million, and other adjustments of $1.2 million.
Associated Documents
This press release should be read in conjunction with the Company’s consolidated financial statements for the three-month period ended June 30, 2026 and associated Management’s Discussion and Analysis (“MD&A”), which are available from the Company's website, www.alamosgold.com, in the "Investors" section under "Reports and Financials", and on SEDAR+ (www.sedarplus.ca) and EDGAR (www.sec.gov).
Reminder of Second Quarter 2026 Results Conference Call
Senior management will host a conference call on Thursday, July 30, 2026 at 10:00 am ET to discuss the results. Participants may join the conference call via webcast or through the following dial-in numbers:
Via Webcast:
To view the live webcast, please register at www.alamosgold.com, or through the following link view webcast.
Via Phone:
| Toronto and International: | (647) 495-7514 |
| Toll free (Canada and the United States): | (888) 596-4144 |
| Participant passcode: | 1813237# |
Alternatively, you may register your phone number here within 30 minutes of the scheduled start of the call to receive an instant automated call back.
A playback will be available until August 29, 2026 by dialling (647) 362-9199 or (800) 770-2030 within Canada and the United States. The passcode is 1813237#. The webcast will be archived at www.alamosgold.com.
Qualified Persons
Chris Bostwick, FAusIMM, Alamos’ Senior Vice President, Technical Services, who is a qualified person within the meaning of National Instrument 43-101 ("Qualified Person"), has reviewed and approved the scientific and technical information contained in this press release.
About Alamos
Alamos is a Canadian-based intermediate gold producer with diversified production from three operations in North America. This includes the Island Gold District and Young-Davidson mine in northern Ontario, Canada, and the Mulatos District in Sonora State, Mexico. Additionally, the Company has a strong portfolio of growth projects including the IGD Expansion, and the Lynn Lake project in Manitoba, Canada. Alamos employs more than 2,400 people and is committed to the highest standards of sustainable development. The Company’s shares are traded on the TSX and NYSE under the symbol “AGI”.
FOR FURTHER INFORMATION, PLEASE CONTACT:
| Scott K. Parsons | |
| Senior Vice-President, Corporate Development & Investor Relations | |
| (416) 368-9932 x 5439 | |
| Khalid Elhaj | |
| Vice President, Business Development & Investor Relations | |
| (416) 368-9932 x 5427 |
The TSX and NYSE have not reviewed and do not accept responsibility for the adequacy or accuracy of this release.
Cautionary Note Regarding Forward-Looking Statements
This press release contains or incorporates by reference “forward-looking statements” and “forward-looking information” as defined under applicable Canadian and U.S. securities legislation. All statements, other than statements of historical fact, which address events, results, outcomes or developments that the Company expects to occur are, or may be deemed, to be, forward-looking statements and are based on expectations, estimates and projections as at the date of this press release. Forward-looking statements are generally, but not always, identified by the use of forward-looking terminology such as "expect", “assume”, "believe", "anticipate", "likely", "intend", "objective", "estimate", "budget", “potential”, "prospective", "opportunity", "forecast", “target”, "goal", "aim", “on track”, "on pace", “outlook”, “continue”, “ongoing”, "onwards", “plan”, "scheduled", or variations of such words and phrases and similar expressions or statements that certain actions, events or results “may”, “could”, “would”, “might” or “will” be taken, occur or be achieved or the negative connotation of such terms.
Such statements in this press release may include (without limitation) information, assumptions, expectations and guidance as to strategy, plans, and future financial and operating performance, such as those regarding: free cash flow; mine-site free cash flow; costs (including total cash costs, AISC, mine-site AISC, capital expenditures, growth and sustaining capital, capitalized exploration, exploration spending); budgets; tax rates and the payment of taxes; IRR; NPV; total liquidity; returns to stakeholders; opportunities for share repurchases under the Company's Normal Course Issuer Bid; repurchase of legacy Argonaut hedges; impacts of inflation and increasing labour and contractor costs; mine plans; mine life; Mineral Reserve life; Mineral Reserves and Resources; gold and other metal price assumptions; foreign exchange rates; sector outlook; size, value and profitability of operations and the Company's balanced approach to capital allocation; project economics; project risks; mining methodologies; underground development rates; mining, stacking, milling and processing rates; total mill feed and throughput rates; recovery rates; anticipated gold production, production rates, timing of production, further production potential and growth; gold grades; exploration potential, budgets, focuses, programs, targets, and projected results; investment in and funding of growth initiatives and projects; operational impacts on the natural environment; the Company's approach to reduction of its environmental footprint, greenhouse gas emissions, and related investments in new initiatives; community relations, engagement activities, and initiatives; corporate governance; plans with respect to health and safety; the IGD Expansion Study; project milestones and timing and effects of completion of the IGD Expansion and the Phase 3+ Expansion Project; Magino mill expansion and intended effects on costs and processing; paste plant expansion; infrastructure upgrades; power projects; rehabilitation work and optimizing the mining sequence and implementing additional ground support measures at Young-Davidson; in the Mulatos District, the Puerto Del Aire project, development plan, anticipated timing of first production, and the Cerro Pelon and the Halcon target; developments at the Lynn Lake project, project milestones and production projections and timing; exploration potential at the Qiqavik Gold project; and any other statements that express management's expectations or estimates of future performance, operational, geological or financial results.
Alamos cautions that forward-looking statements are necessarily based upon several factors and assumptions that, while considered reasonable by the Company at the time of making such statements, are inherently subject to significant business, economic, technical, legal, political and competitive uncertainties and contingencies. Known and unknown factors could cause actual results to differ materially from those projected in the forward-looking statements and undue reliance should not be placed on such statements and information.
Risk factors that may affect Alamos’ ability to achieve the expectations set forth in the forward-looking statements in this document include, but are not limited to: the actual results of current exploration activities; changes to current estimates of Mineral Reserves and Resources; changes to production estimates (which assume accuracy of projected ore grade, mining rates, recovery timing and recovery rate estimates which may be impacted by unscheduled maintenance, weather issues, labour and contractor availability and other operating or technical difficulties in connection with mining or development activities, including geotechnical challenges); conclusions of economic and geological evaluations; the costs and timing of exploration, construction and development of new deposits; changes in project parameters as plans continue to be refined; operations may be exposed to illnesses, diseases, epidemics and pandemics which may impact, among other things, the broader market and the trading price of the Company's shares; the duration of any regulatory responses to any illness, disease, epidemic or pandemic; government and the Company’s attempts to reduce the spread of any illness, disease, epidemic or pandemic which may affect many aspects of the Company's operations including the ability to transport personnel to and from site, contractor and supply availability and the ability to sell or deliver gold doré bars; provincial, state and federal orders or mandates (including with respect to mining operations generally or auxiliary businesses or services required for the Company’s operations) in Canada, Mexico and other jurisdictions in which the Company does or may conduct business; political and economic conditions and developments in the jurisdictions in which the Company operates and in the world generally; fluctuations in the price of gold or certain other commodities such as, diesel fuel, natural gas, and electricity; changes in foreign exchange rates (particularly CAD, MXN and USD); the impact of inflation and any tariffs, trade barriers and/or regulatory costs; changes in the Company's credit rating; any decision to declare a quarterly dividend; employee and community relations; litigation, administrative or regulatory proceedings and any resulting court, administrative, regulatory or arbitral decision(s) or order(s); disruptions affecting operations; power outages; availability of and increased costs associated with mining inputs and labour; delays in implementing growth and improvement initiatives; delays with the Phase 3+ Shaft Expansion or the IGD Expansion; delays in or obstructions to construction of the 115kV powerline for the Island Gold District; delays with the expansion of the Magino mill, paste plant construction project, construction of the Lynn Lake Project, construction of the PDA project, and/or the development or updating of mine plans; changes with respect to the intended method of accessing, mining the deposit, and processing any ore at PDA; risks associated with the start-up of new mines; the risk that the Company’s mines may not perform as planned; uncertainty with the Company’s ability to secure additional capital to execute its business plans; the speculative nature of mineral exploration and development, including the risks of obtaining and maintaining necessary licenses and permits, including the necessary licenses, permits, authorizations and/or approvals from the appropriate regulatory authorities for the Company’s development stage and operating assets; labour and contractor availability (and being able to secure the same on favourable terms); contests over title to properties; expropriation or nationalization of property; inherent risks and hazards associated with mining and mineral processing including industrial hazards and industrial accidents; environmental hazards including, without limitation, fires, floods, storm-related damage, seismic activity and unusual or unexpected formations, pressures and cave-ins; changes in national and local government legislation, controls or regulations in Canada, Mexico, the United States and other jurisdictions in which the Company does or may carry on business in the future; increased costs and risks related to the potential impact of climate change; failure to comply with environmental and health and safety laws and regulations; disruptions in the maintenance or provision of required infrastructure and information technology systems; risk of loss due to sabotage, protests and other civil disturbances; the impact of global liquidity and credit availability and the values of assets and liabilities based on projected future cash flows; risks arising from holding derivative instruments; and business opportunities that may be pursued by the Company.
Additional risk factors and details with respect to risk factors that may affect the Company’s ability to achieve the expectations set forth in the forward-looking statements contained in this press release are set out in the Company's latest 40-F/Annual Information Form under the heading “Risk Factors”, which is available on the SEDAR+ website at www.sedarplus.ca or on EDGAR at www.sec.gov. The foregoing should be reviewed in conjunction with the information, risk factors and assumptions found in this press release.
The Company disclaims any intention or obligation to update or revise any forward-looking statements whether as a result of new information, future events or otherwise, except as required by applicable law.
Cautionary Note to United States Investors
Measured, Indicated and Inferred Resources: All resource and reserve estimates included in this press release or documents referenced in this press release have been prepared in accordance with Canadian National Instrument 43-101 - Standards of Disclosure for Mineral Projects ("NI 43-101") and the Canadian Institute of Mining, Metallurgy and Petroleum ("CIM") - CIM Definition Standards on Mineral Resources and Mineral Reserves, adopted by the CIM Council, as amended ("CIM Standards"). NI 43-101 is a rule developed by the Canadian Securities Administrators, which established standards for all public disclosure an issuer makes of scientific and technical information concerning mineral projects. Mining disclosure in the United States was previously required to comply with SEC Industry Guide 7 (“SEC Industry Guide 7”) under the United States Securities Exchange Act of 1934, as amended. The Securities and Exchange Commission (the “SEC”) has adopted final rules, to replace SEC Industry Guide 7 with new mining disclosure rules under sub-part 1300 of Regulation S-K of the U.S. Securities Act (“Regulation S-K 1300”) which became mandatory for U.S. reporting companies beginning with the first fiscal year commencing on or after January 1, 2021. Under Regulation S-K 1300, the SEC now recognizes estimates of “Measured Mineral Resources”, “Indicated Mineral Resources” and “Inferred Mineral Resources”. In addition, the SEC has amended its definitions of “Proven Mineral Reserves” and “Probable Mineral Reserves” to be substantially similar to international standards.
Investors are cautioned that while the above terms are “substantially similar” to CIM Definitions, there are differences in the definitions under Regulation S-K 1300 and the CIM Standards. Accordingly, there is no assurance any mineral reserves or mineral resources that the Company may report as “proven mineral reserves”, “probable mineral reserves”, “measured mineral resources”, “indicated mineral resources” and “inferred mineral resources” under NI 43-101 would be the same had the Company prepared the mineral reserve or mineral resource estimates under the standards adopted under Regulation S-K 1300. U.S. investors are also cautioned that while the SEC recognizes “measured mineral resources”, “indicated mineral resources” and “inferred mineral resources” under Regulation S-K 1300, investors should not assume that any part or all of the mineralization in these categories will ever be converted into a higher category of mineral resources or into mineral reserves. Mineralization described using these terms has a greater degree of uncertainty as to its existence and feasibility than mineralization that has been characterized as reserves. Accordingly, investors are cautioned not to assume that any measured mineral resources, indicated mineral resources, or inferred mineral resources that the Company reports are or will be economically or legally mineable.
International Financial Reporting Standards: The consolidated financial statements of the Company have been prepared by management in accordance with IFRS, as issued by the IASB (note 2 and 3 to the consolidated financial statements for the years ended December 31, 2025). These accounting principles differ in certain material respects from accounting principles generally accepted in the United States of America. The Company’s reporting currency is the United States dollar unless otherwise noted
Non-GAAP Measures and Additional GAAP Measures
The Company has included certain non-GAAP financial measures to supplement its condensed interim consolidated financial statements for the three and six months ended June 30, 2026 and 2025, which are presented in accordance with IFRS, including the following:
- adjusted net earnings and adjusted earnings per share;
- cash flow from operating activities before changes in working capital and taxes paid;
- Company-wide free cash flow;
- total mine-site free cash flow;
- mine-site free cash flow;
- total cash costs per ounce of gold sold;
- AISC per ounce of gold sold;
- Mine-site AISC per ounce of gold sold;
- sustaining and non-sustaining capital expenditures; and
- adjusted earnings before interest, taxes, depreciation, and amortization ("Adjusted EBITDA")
The Company believes that these measures, together with measures determined in accordance with IFRS, provide investors with an improved ability to evaluate the underlying performance of the Company. Non-GAAP financial measures do not have any standardized meaning prescribed under IFRS, and therefore they may not be comparable to similar measures employed by other companies. The data is intended to provide additional information and should not be considered in isolation or as a substitute for measures of performance prepared in accordance with IFRS. Management's determination of the components of non-GAAP and additional measures are evaluated on a periodic basis influenced by new items and transactions, a review of investor uses and new regulations as applicable. Any changes to the measures are duly noted and retrospectively applied as applicable.
Adjusted Net Earnings and Adjusted Earnings per Share
“Adjusted net earnings” and “adjusted earnings per share” are non-GAAP financial measures with no standard meaning under IFRS which exclude the following from net earnings:
- Foreign exchange gains or losses
- Items included in other loss
- Impairment expense/reversal of impairment
- Net gain or loss on commodity derivatives
- Certain non-recurring items
- Foreign exchange gain or loss recorded in deferred tax expense
- The income and mining tax impact of items included in other loss
The Company uses adjusted net earnings for its own internal purposes. Management’s internal budgets and forecasts and public guidance do not reflect the items which have been excluded from the determination of adjusted net earnings. Consequently, the presentation of adjusted net earnings enables shareholders to better understand the underlying operating performance of the core mining business through the eyes of management. Management periodically evaluates the components of adjusted net earnings based on an internal assessment of performance measures that are useful for evaluating the operating performance of our business and a review of the non-GAAP measures used by mining industry analysts and other mining companies.
Adjusted net earnings is intended to provide additional information only and does not have any standardized meaning under IFRS and may not be comparable to similar measures presented by other companies. It should not be considered in isolation or as a substitute for measures of performance prepared in accordance with IFRS. The measure is not necessarily indicative of operating profit or cash flows from operations as determined under IFRS. The following table reconciles this non-GAAP measure to the most directly comparable IFRS measure.
| (in millions) | ||||
| Three Months Ended June 30, | Six Months Ended June 30, | |||
| 2026 | 2025 | 2026 | 2025 | |
| Net earnings | $270.4 | $159.4 | $461.8 | $174.6 |
| Adjustments: | ||||
| Foreign exchange (gain) loss | (7.8) | 6.6 | (3.4) | 6.2 |
| Inventory net realizable value adjustment, net of taxes | 7.0 | — | 7.0 | — |
| Net (gain) loss on commodity derivatives, net of tax | (27.4) | 17.1 | (7.2) | 63.4 |
| Other loss | 1.6 | 2.1 | 3.0 | 3.2 |
| Unrealized foreign exchange loss (gain) recorded in deferred tax expense | 4.2 | (40.9) | 19.1 | (43.0) |
| Other income and mining tax adjustments | (0.4) | (0.2) | (0.7) | (0.5) |
| Adjusted net earnings | $247.6 | $144.1 | $479.6 | $203.9 |
| Adjusted earnings per share - basic | $0.59 | $0.34 | $1.14 | $0.48 |
Cash Flow from Operating Activities before Changes in Working Capital and Cash Taxes
“Cash flow from operating activities before changes in working capital and cash taxes” is a non-GAAP performance measure that could provide an indication of the Company’s ability to generate cash flows from operations, and is calculated by adding back the change in working capital and cash taxes to cash flow from operating activities. “Cash flow from operating activities before changes in working capital and cash taxes” is a non-GAAP financial measure with no standard meaning under IFRS. The following table reconciles this non-GAAP measure to the most directly comparable IFRS measure.
| (in millions) | ||||
| Three Months Ended June 30, | Six Months Ended June 30, | |||
| 2026 | 2025 | 2026 | 2025 | |
| Cash flow from operating activities | $231.8 | $199.5 | $474.3 | $279.1 |
| Add: Changes in working capital and taxes paid | 55.1 | 33.4 | 150.6 | 85.2 |
| Cash flow from operating activities before changes in working capital and taxes paid | $286.9 | $232.9 | $624.9 | $364.3 |
Company-wide Free Cash Flow
“Company-wide free cash flow" is a non-GAAP performance measure calculated from cash flow from operating activities, less mineral property, plant and equipment expenditures and non-recurring costs. The Company believes this to be a useful indicator of our ability to operate without reliance on additional borrowing or usage of existing cash company-wide. Company-wide free cash flow is intended to provide additional information only and does not have any standardized meaning under IFRS and may not be comparable to similar measures of performance presented by other mining companies. Company-wide free cash flow should not be considered in isolation or as a substitute for measures of performance prepared in accordance with IFRS.
| (in millions) | ||||
| Three Months Ended June 30, | Six Months Ended June 30, | |||
| 2026 | 2025 | 2026 | 2025 | |
| Cash flow from operating activities | $231.8 | $199.5 | $474.3 | $279.1 |
| Less: mineral property, plant and equipment expenditures | (180.6) | (114.9) | (364.1) | (214.6) |
| Add: early settlement of legacy Argonaut hedges(1) | 92.3 | — | 135.0 | — |
| Company-wide free cash flow | $143.5 | $84.6 | $245.2 | $64.5 |
| (1) | Represents the early settlement of 35,000 ounces and 50,000 ounces, respectively, during the three and six months period ended June 30, 2026, of the remaining legacy Argonaut hedges scheduled to mature in the second half of 2026. |
Mine-site Free Cash Flow
"Mine-site free cash flow" is a non-GAAP financial performance measure calculated as cash flow from operating mine-sites, less mine-site mineral property, plant and equipment expenditures. The Company believes this to be a useful indicator of our ability to operate without reliance on additional borrowing or usage of existing cash. Mine-site free cash flow is intended to provide additional information only and does not have any standardized meaning under IFRS and may not be comparable to similar measures of performance presented by other mining companies. Mine-site free cash flow should not be considered in isolation or as a substitute for measures of performance prepared in accordance with IFRS.
| Consolidated Mine-Site Free Cash Flow | Three Months Ended June 30, | Six Months Ended June 30, | ||
| 2026 | 2025 | 2026 | 2025 | |
| (in millions) | ||||
| Cash flow from operating activities | $231.8 | $199.5 | $474.3 | $279.1 |
| Add: operating cash flow used by non-mine site activity(1) | 136.9 | 62.2 | 247.1 | 132.1 |
| Cash flow from operating mine-sites | $368.7 | $261.7 | $721.4 | $411.2 |
| Mineral property, plant and equipment expenditures | $180.6 | $114.9 | $364.1 | $214.6 |
| Less: capital expenditures from development projects and corporate | (40.4) | (19.4) | (61.5) | (28.3) |
| Capital expenditure and capital advances from mine-sites | $140.2 | $95.5 | $302.6 | $186.3 |
| Total mine-site free cash flow | $228.5 | $166.2 | $418.8 | $224.9 |
| Island Gold District Mine-Site Free Cash Flow | Three Months Ended June 30, | Six Months Ended June 30, | ||
| 2026 | 2025 | 2026 | 2025 | |
| (in millions) | ||||
| Cash flow from operating activities(1) | $195.2 | $122.7 | $372.4 | $209.6 |
| Mineral property, plant and equipment expenditures | (95.3) | (70.4) | (214.5) | (138.4) |
| Mine-site free cash flow | $99.9 | $52.3 | $157.9 | $71.2 |
| Young-Davidson Mine-Site Free Cash Flow | Three Months Ended June 30, | Six Months Ended June 30, | ||
| 2026 | 2025 | 2026 | 2025 | |
| (in millions) | ||||
| Cash flow from operating activities(1) | $87.6 | $80.1 | $185.0 | $138.1 |
| Mineral property, plant and equipment expenditures | (20.2) | (21.4) | (46.1) | (40.2) |
| Mine-site free cash flow | $67.4 | $58.7 | $138.9 | $97.9 |
| Mulatos District Mine-Site Free Cash Flow | Three Months Ended June 30, | Six Months Ended June 30, | ||
| 2026 | 2025 | 2026 | 2025 | |
| (in millions) | ||||
| Cash flow from operating activities | $85.9 | $58.9 | $164.0 | $63.5 |
| Mineral property, plant and equipment expenditures | (24.7) | (3.7) | (42.0) | (7.7) |
| Mine-site free cash flow | $61.2 | $55.2 | $122.0 | $55.8 |
| (1) | Cash from operating activities for the Canadian operations excludes the impact of the 6,128 ounces and 12,255 ounces delivered into the gold prepayment arrangement for the three and six months ended June 30, 2026, respectively (three and six months ended June 30, 2025 - 12,346 ounces and 24,692 ounces, respectively). The non-cash adjustment to reflect the settlement of the gold prepayment arrangement is included in Company-wide free cash flow. |
Total Cash Costs per ounce
Total cash costs per ounce is a non-GAAP term typically used by gold mining companies to evaluate the costs of producing gold and to assess the ability of a mining company to generate cash flow from operating activities. Total cash costs per ounce includes mining and processing costs plus applicable royalties, and net of costs allocated to by-product and net realizable value adjustments. Total cash costs per ounce is exclusive of exploration costs. As well, the Company excludes mark-to-market adjustments for the revaluation of previously issued share-based compensation, therefore, total cash costs will incorporate the cost of long term incentives associated with the grant date fair value for instruments issued.
Total cash costs per ounce is intended to provide additional information only and does not have any standardized meaning under IFRS and may not be comparable to similar measures presented by other mining companies. It should not be considered in isolation or as a substitute for measures of performance prepared in accordance with IFRS. The measure is not necessarily indicative of cash flow from operating activities under IFRS or operating costs presented under IFRS.
All-in Sustaining Costs per ounce and Mine-site All-in Sustaining Costs
The Company adopted an “all-in sustaining costs per ounce” non-GAAP performance measure in accordance with the World Gold Council. The Company believes the measure more fully defines the total costs associated with producing gold; however, this performance measure has no standardized meaning. Accordingly, there may be some variation in the method of computation of “all-in sustaining costs per ounce” as determined by the Company compared with other mining companies. In this context, “all-in sustaining costs per ounce” for the consolidated Company reflects total mining and processing costs, corporate and administrative costs, share-based compensation, sustaining exploration costs, sustaining capital, sustaining finance leases and other operating costs. The Company excludes mark-to-market adjustments for the revaluation of previously issued share-based compensation, therefore all-in sustaining costs will incorporate the cost of long term incentives associated with the grant date fair value for instruments issued.
For the purposes of calculating mine-site all-in sustaining costs at individual mine sites the Company allocates a portion of share based compensation to the mine sites, but does not include an allocation of corporate and administrative expenses to the mine sites, as detailed in the reconciliations below.
Sustaining capital expenditures are expenditures that do not increase annual gold ounce production at a mine site and excludes all expenditures at the Company’s development projects as well as certain expenditures at the Company’s operating sites that are deemed expansionary in nature. Non-sustaining capital expenditures or growth capital are expenditures primarily incurred at development projects and costs related to major projects at existing operations, where these projects will materially benefit the mine site. Capitalized exploration expenditures are expenditures that meet the IFRS definition for capitalization and are incurred to further expand the known Mineral Reserves and Resources at existing operations or development projects. For each mine-site reconciliation, corporate and administrative costs, and non-site specific costs are not included in the all-in sustaining cost per ounce calculation.
All-in sustaining costs per gold ounce is intended to provide additional information only and does not have any standardized meaning under IFRS and may not be comparable to similar measures presented by other mining companies. It should not be considered in isolation or as a substitute for measures of performance prepared in accordance with IFRS. The measure is not necessarily indicative of cash flow from operating activities under IFRS or operating costs presented under IFRS.
Total Cash Costs and All-in Sustaining Costs per Ounce Reconciliation Tables
The following tables reconciles these non-GAAP measures to the most directly comparable IFRS measures on a Company-wide and individual mine-site basis.
| Total Cash Costs and AISC Reconciliation - Company-wide | ||||
| Three Months Ended June 30, | Six Months Ended June 30, | |||
| 2026 | 2025 | 2026 | 2025 | |
| (in millions, except ounces and per ounce figures) | ||||
| Mining and processing | $164.8 | $140.4 | $319.3 | $279.4 |
| Share-based compensation mark-to-market allocated to sites (included in mining and processing)(2) | 3.9 | — | 0.7 | (4.1) |
| Costs allocated to silver by-product | (5.0) | (2.9) | (13.1) | (6.4) |
| Royalties | 6.8 | 7.6 | 13.6 | 12.4 |
| Total cash costs | $170.5 | $145.1 | $320.5 | $281.3 |
| Gold ounces sold | 130,834 | 135,027 | 252,757 | 252,610 |
| Total cash costs per ounce | $1,303 | $1,075 | $1,268 | $1,114 |
| Total cash costs | $170.5 | $145.1 | $320.5 | $281.3 |
| Corporate and administrative(1) | 10.2 | 10.0 | 22.1 | 20.0 |
| Sustaining capital expenditures(3) | 35.6 | 33.5 | 80.8 | 60.3 |
| Sustaining finance leases | 3.4 | 4.0 | 7.2 | 8.3 |
| Interest on sustaining finance leases | 0.4 | 1.3 | 0.8 | 1.3 |
| Share-based compensation (recovery) expense | (13.3) | 2.5 | 13.7 | 30.4 |
| Share-based compensation mark-to-market allocated to corporate(2) | 16.4 | 0.9 | 2.1 | (11.9) |
| Sustaining exploration | 0.6 | 0.5 | 1.3 | 1.1 |
| Accretion of decommissioning liabilities | 2.3 | 2.2 | 4.7 | 4.6 |
| Total all-in sustaining costs | $226.1 | $200.0 | $453.2 | $395.4 |
| Gold ounces sold | 130,834 | 135,027 | 252,757 | 252,610 |
| Total all-in sustaining costs per ounce | $1,728 | $1,481 | $1,793 | $1,565 |
| (1) | Corporate and administrative expenses exclude expenses incurred at development properties. |
| (2) | Share-based compensation included in total cash costs and AISC excludes the impact of mark-to-market adjustments for changes in the Company’s share price in the periods allocated to sites (included in mining and processing costs) and corporate head office (included in share-based compensation expense). The prior year period comparatives have been restated to exclude the impact. See Note 10 (d) of the condensed interim consolidated financial statements for the three and six months ended June 30, 2026 and 2025 for further details. |
| (3) | Sustaining capital expenditures are defined as those expenditures which do not increase annual gold ounce production at a mine site and exclude all expenditures at growth projects and certain expenditures at operating sites which are deemed expansionary in nature. Total sustaining capital expenditures for the periods are as follow: |
| Three Months Ended June 30, | Six Months Ended June 30, | |||
| 2026 | 2025 | 2026 | 2025 | |
| (in millions) | ||||
| Mineral property, plant and equipment expenditures | $180.6 | $114.9 | $364.1 | $214.6 |
| Less: non-sustaining capital expenditures at: | ||||
| Island Gold District | (72.5) | (50.3) | (163.8) | (102.8) |
| Young-Davidson | (8.0) | (8.5) | (17.3) | (16.6) |
| Mulatos District | (24.1) | (3.2) | (40.7) | (6.6) |
| Corporate and other | (40.4) | (19.4) | (61.5) | (28.3) |
| Sustaining capital expenditures | $35.6 | $33.5 | $80.8 | $60.3 |
| Island Gold District Total Cash Costs and Mine-site AISC Reconciliation | ||||
| Three Months Ended June 30, | Six Months Ended June 30, | |||
| 2026 | 2025 | 2026 | 2025 | |
| (in millions, except ounces and per ounce figures) | ||||
| Mining and processing | $82.1 | $60.9 | $149.2 | $115.5 |
| Share-based compensation mark-to-market allocated to sites (included in mining and processing)(1) | 1.3 | — | 0.2 | (1.5) |
| Costs allocated to silver by-product | (0.6) | (0.5) | (1.4) | (0.9) |
| Royalties | 2.9 | 4.1 | 5.6 | 6.9 |
| Total cash costs | $85.7 | $64.5 | $153.6 | $120.0 |
| Gold ounces sold | 65,726 | 63,958 | 122,835 | 117,346 |
| Mine-site total cash costs per ounce | $1,304 | $1,008 | $1,250 | $1,023 |
| Total cash costs | $85.7 | $64.5 | $153.6 | $120.0 |
| Sustaining capital expenditures | 22.8 | 20.1 | 50.7 | 35.6 |
| Sustaining finance leases | 3.4 | 4.0 | 7.2 | 8.3 |
| Interest on sustaining finance leases | 0.4 | 1.3 | 0.8 | 1.3 |
| Accretion of decommissioning liabilities | 0.4 | 0.3 | 0.9 | 0.7 |
| Total all-in sustaining costs | $112.7 | $90.2 | $213.2 | $165.9 |
| Gold ounces sold | 65,726 | 63,958 | 122,835 | 117,346 |
| Mine-site all-in sustaining costs per ounce | $1,715 | $1,410 | $1,736 | $1,414 |
| Young-Davidson Total Cash Costs and Mine-site AISC Reconciliation | ||||
| Three Months Ended June 30, | Six Months Ended June 30, | |||
| 2026 | 2025 | 2026 | 2025 | |
| (in millions, except ounces and per ounce figures) | ||||
| Mining and processing | $48.2 | $45.8 | $99.9 | $92.8 |
| Share-based compensation mark-to-market allocated to sites (included in mining and processing)(1) | 1.5 | — | 0.3 | (1.4) |
| Costs allocated to silver by-product | (1.5) | (0.6) | (3.4) | (1.3) |
| Royalties | 2.4 | 1.9 | 4.8 | 3.5 |
| Total cash costs | $50.6 | $47.1 | $101.6 | $93.6 |
| Gold ounces sold | 32,860 | 38,214 | 63,901 | 73,689 |
| Mine-site total cash costs per ounce | $1,540 | $1,233 | $1,590 | $1,270 |
| Total cash costs | $50.6 | $47.1 | $101.6 | $93.6 |
| Sustaining capital expenditures | 12.2 | 12.9 | 28.8 | 23.6 |
| Accretion of decommissioning liabilities | 0.2 | 0.2 | 0.3 | 0.3 |
| Total all-in sustaining costs | $63.0 | $60.2 | $130.7 | $117.5 |
| Gold ounces sold | 32,860 | 38,214 | 63,901 | 73,689 |
| Mine-site all-in sustaining costs per ounce | $1,917 | $1,575 | $2,045 | $1,595 |
| Mulatos District Total Cash Costs and Mine-site AISC Reconciliation | ||||
| Three Months Ended June 30, | Six Months Ended June 30, | |||
| 2026 | 2025 | 2026 | 2025 | |
| (in millions, except ounces and per ounce figures) | ||||
| Mining and processing | $34.5 | $33.7 | $70.2 | $71.1 |
| Share-based compensation mark-to-market allocated to sites (included in mining and processing)(1) | 1.1 | — | 0.2 | (1.2) |
| Costs allocated to silver by-product | (2.9) | (1.9) | (8.3) | (4.3) |
| Royalties | 1.5 | 1.6 | 3.2 | 2.0 |
| Total cash costs | $34.2 | $33.4 | $65.3 | $67.6 |
| Gold ounces sold | 32,248 | 32,855 | 66,021 | 61,575 |
| Mine-site total cash costs per ounce | $1,061 | $1,017 | $989 | $1,098 |
| Total cash costs | $34.2 | $33.4 | $65.3 | $67.6 |
| Sustaining capital expenditures | 0.6 | 0.5 | 1.3 | 1.1 |
| Accretion of decommissioning liabilities | 1.7 | 1.7 | 3.5 | 3.6 |
| Total all-in sustaining costs | $36.5 | $35.6 | $70.1 | $72.3 |
| Gold ounces sold | 32,248 | 32,855 | 66,021 | 61,575 |
| Mine-site all-in sustaining costs per ounce | $1,132 | $1,084 | $1,062 | $1,174 |
| (1) | Share-based compensation included in mine-site total cash costs and mine-site AISC excludes the impact of mark-to-market adjustments for changes in the Company’s share price in the periods allocated to sites included in mining and processing costs. |
Adjusted EBITDA
Adjusted EBITDA represents net earnings before interest, taxes, depreciation, and amortization and removes the effects of certain items that the Company believes are not reflective of the Company's underlying performance for the reporting period. The measure also removes the impact of non-cash items such as impairment loss charges or reversals, and net gain or loss on derivative financial instruments. Adjusted EBITDA is an indicator of the Company’s ability to generate liquidity by producing operating cash flow to fund working capital needs, service debt obligations, and fund capital expenditures.
Adjusted EBITDA does not have any standardized meaning under IFRS and may not be comparable to similar measures presented by other mining companies. It should not be considered in isolation or as a substitute for measures of performance prepared in accordance with IFRS. The following table reconciles this non-GAAP measure to the most directly comparable IFRS measure.
| (in millions) | ||||
| Three Months Ended June 30, | Six Months Ended June 30, | |||
| 2026 | 2025 | 2026 | 2025 | |
| Net earnings | $270.4 | $159.4 | $461.8 | $174.6 |
| Adjustments: | ||||
| Inventory net realizable value adjustment | 10.8 | — | 10.8 | — |
| Finance (income) expense | (6.2) | 0.1 | (12.1) | — |
| Amortization | 49.5 | 52.7 | 93.7 | 104.1 |
| Net (gain) loss on commodity derivatives | (40.3) | 25.8 | (10.6) | 94.2 |
| Deferred income tax expense (recovery) | 68.9 | (10.6) | 108.0 | (13.4) |
| Current income tax expense | 70.7 | 32.8 | 155.4 | 46.1 |
| Adjusted EBITDA | $423.8 | $260.2 | $807.0 | $405.6 |
Additional GAAP Measures
Additional GAAP measures are presented on the Company’s condensed interim consolidated financial statements and are not meant to be a substitute for other subtotals or totals presented in accordance with IFRS, but rather should be evaluated in conjunction with such IFRS measures. The following additional GAAP measures are used and are intended to provide an indication of the Company’s mine and operating performance:
- Earnings from operations - represents the amount of earnings before net finance expense/income, foreign exchange loss/gain, other loss, net loss/gain on commodity derivatives and income tax expense
Unaudited Interim Consolidated Statements of Financial Position, Comprehensive
Income, and Cash Flow
ALAMOS GOLD INC.
Condensed Interim Consolidated Statements of Financial Position
(Unaudited - stated in millions of United States dollars)
| June 30, 2026 | December 31, 2025 | ||
| ASSETS | |||
| Current Assets | |||
| Cash and cash equivalents | $636.9 | $623.1 | |
| Equity securities | 39.8 | 58.9 | |
| Deferred payment consideration | 160.7 | 157.1 | |
| Amounts receivable | 54.0 | 45.0 | |
| Inventories | 219.4 | 225.4 | |
| Other current assets | 36.7 | 26.0 | |
| Total Current Assets | 1,147.5 | 1,135.5 | |
| Non-Current Assets | |||
| Mineral property, plant and equipment | 5,252.2 | 4,957.5 | |
| Deferred income taxes | 43.8 | 34.0 | |
| Inventories | 112.4 | 84.9 | |
| Deferred payment consideration | 145.4 | 142.0 | |
| Other non-current assets | 11.6 | 30.7 | |
| Total Assets | $6,712.9 | $6,384.6 | |
| LIABILITIES | |||
| Current Liabilities | |||
| Accounts payable and accrued liabilities | $338.5 | $316.1 | |
| Derivative liabilities | 118.2 | 128.0 | |
| Deferred revenue | — | 50.0 | |
| Income taxes payable | 75.1 | 53.6 | |
| Current portion of lease liabilities | 9.4 | 11.8 | |
| Current portion of decommissioning liabilities | 14.0 | 8.1 | |
| Total Current Liabilities | 555.2 | 567.6 | |
| Non-Current Liabilities | |||
| Deferred income taxes | 987.3 | 873.3 | |
| Derivative liabilities | — | 129.1 | |
| Debt and financing obligations | 200.0 | 200.0 | |
| Lease liabilities | 6.9 | 11.2 | |
| Decommissioning liabilities | 154.5 | 153.4 | |
| Other non-current liabilities | 4.1 | 4.2 | |
| Total Liabilities | 1,908.0 | 1,938.8 | |
| EQUITY | |||
| Share capital | $4,129.3 | $4,140.6 | |
| Contributed surplus | 85.6 | 87.7 | |
| Accumulated other comprehensive (loss) income | (19.8) | 0.3 | |
| Retained earnings | 609.8 | 217.2 | |
| Total Equity | 4,804.9 | 4,445.8 | |
| Total Liabilities and Equity | $6,712.9 | $6,384.6 |
ALAMOS GOLD INC.
Condensed Interim Consolidated Statements of Comprehensive Income
(Unaudited - stated in millions of United States dollars, except share and per share amounts)
| Three Months Ended June 30, | Six Months Ended June 30, | ||||||
| 2026 | 2025 | 2026 | 2025 | ||||
| OPERATING REVENUES | $594.1 | $438.2 | $1,190.8 | $771.2 | |||
| COST OF SALES | |||||||
| Mining and processing | 164.8 | 140.4 | 319.3 | 279.4 | |||
| Inventory net realizable value adjustment | 10.8 | — | 10.8 | — | |||
| Royalties | 6.8 | 7.6 | 13.6 | 12.4 | |||
| Amortization | 49.5 | 52.7 | 93.7 | 104.1 | |||
| 231.9 | 200.7 | 437.4 | 395.9 | ||||
| EXPENSES | |||||||
| Exploration | 8.0 | 8.8 | 15.5 | 14.0 | |||
| Corporate and administrative | 10.2 | 10.0 | 22.1 | 20.0 | |||
| Share-based compensation (recovery) expense | (13.3) | 2.5 | 13.7 | 30.4 | |||
| 236.8 | 222.0 | 488.7 | 460.3 | ||||
| EARNINGS FROM OPERATIONS | 357.3 | 216.2 | 702.1 | 310.9 | |||
| OTHER EXPENSES | |||||||
| Net gain (loss) on commodity derivatives | 40.3 | (25.8) | 10.6 | (94.2) | |||
| Finance income (expense) | 6.2 | (0.1) | 12.1 | — | |||
| Foreign exchange gain (loss) | 7.8 | (6.6) | 3.4 | (6.2) | |||
| Other loss | (1.6) | (2.1) | (3.0) | (3.2) | |||
| EARNINGS BEFORE INCOME TAXES | $410.0 | $181.6 | $725.2 | $207.3 | |||
| INCOME TAXES | |||||||
| Current income tax expense | (70.7) | (32.8) | (155.4) | (46.1) | |||
| Deferred income tax (expense) recovery | (68.9) | 10.6 | (108.0) | 13.4 | |||
| NET EARNINGS | $270.4 | $159.4 | $461.8 | $174.6 | |||
| Items that may be subsequently reclassified to net earnings: | |||||||
| Net change in fair value of currency hedging instruments, net of taxes | (1.8) | 7.9 | (3.8) | 10.4 | |||
| Net change in fair value of fuel hedging instruments, net of taxes | (0.4) | — | 0.6 | — | |||
| Items that will not be reclassified to net earnings: | |||||||
| Unrealized (loss) gain on equity securities, net of taxes | (5.8) | 4.1 | (16.5) | 8.9 | |||
| Total other comprehensive (loss) gain | ($8.0) | $12.0 | ($19.7) | $19.3 | |||
| COMPREHENSIVE INCOME | $262.4 | $171.4 | $442.1 | $193.9 | |||
| EARNINGS PER SHARE | |||||||
| – basic | $0.64 | $0.38 | $1.10 | $0.42 | |||
| – diluted | $0.64 | $0.38 | $1.10 | $0.41 | |||
ALAMOS GOLD INC.
Condensed Interim Consolidated Statements of Cash Flows
(Unaudited stated in millions of United States dollars)
| Three Months Ended June 30, | Six Months Ended June 30, | ||||||
| 2026 | 2025 | 2026 | 2025 | ||||
| CASH PROVIDED BY (USED IN): | |||||||
| OPERATING ACTIVITIES | |||||||
| Net earnings | $270.4 | $159.4 | $461.8 | $174.6 | |||
| Adjustments for items not involving cash: | |||||||
| Amortization | 49.5 | 52.7 | 93.7 | 104.1 | |||
| Inventory net realizable value adjustment | 10.8 | — | 10.8 | — | |||
| Foreign exchange (gain) loss | (7.8) | 6.6 | (3.4) | 6.2 | |||
| Current income tax expense | 70.7 | 32.8 | 155.4 | 46.1 | |||
| Deferred income tax expense (recovery) | 68.9 | (10.6) | 108.0 | (13.4) | |||
| Share-based compensation | (16.8) | 3.2 | 13.9 | 35.5 | |||
| Finance (income) loss | (6.2) | 0.1 | (12.1) | — | |||
| Net (gain) loss on commodity derivatives | (40.3) | 25.8 | (10.6) | 94.2 | |||
| Deferred revenue recognized | (25.5) | (31.1) | (51.0) | (62.3) | |||
| Settlement of Argonaut legacy gold hedges | (92.3) | — | (135.0) | — | |||
| Other items | 5.5 | (6.0) | (6.6) | (20.7) | |||
| Changes in working capital and taxes paid | (55.1) | (33.4) | (150.6) | (85.2) | |||
| 231.8 | 199.5 | 474.3 | 279.1 | ||||
| INVESTING ACTIVITIES | |||||||
| Mineral property, plant and equipment | (180.6) | (114.9) | (364.1) | (214.6) | |||
| Interest capitalized to mineral property, plant and equipment | (3.1) | (6.9) | (6.2) | (8.9) | |||
| Repurchase of royalty on Young-Davidson | — | (2.0) | — | (2.0) | |||
| Proceeds from disposition of equity securities | 0.6 | 1.8 | 0.6 | 1.8 | |||
| Investment in equity securities | (0.6) | (0.2) | (0.6) | (0.2) | |||
| (183.7) | (122.2) | (370.3) | (223.9) | ||||
| FINANCING ACTIVITIES | |||||||
| Dividends paid | (16.3) | (9.6) | (32.4) | (19.3) | |||
| Repurchase and cancellation of common shares | (50.0) | (10.0) | (50.0) | (10.0) | |||
| Credit facility transaction costs, standby fees and interest | (0.4) | (0.3) | (0.8) | (1.9) | |||
| Proceeds from the exercise of options and warrants | — | 1.6 | 0.6 | 1.8 | |||
| Lease payments | (3.4) | (4.0) | (7.2) | (8.3) | |||
| (70.1) | (22.3) | (89.8) | (37.7) | ||||
| Effect of exchange rates on cash and cash equivalents | (0.6) | 0.4 | (0.4) | 0.2 | |||
| Net (decrease) increase in cash and cash equivalents | (22.6) | 55.4 | 13.8 | 17.7 | |||
| Cash and cash equivalents - beginning of period | 659.5 | 289.5 | 623.1 | 327.2 | |||
| CASH AND CASH EQUIVALENTS - END OF PERIOD | $636.9 | $344.9 | $636.9 | $344.9 | |||
A photo accompanying this announcement is available at
https://www.globenewswire.com/NewsRoom/AttachmentNg/a53090b7-f3ab-4911-a36e-76f8c8a1f81f
https://www.globenewswire.com/NewsRoom/AttachmentNg/8aa8a6b5-038b-4f25-b15f-0c3a5d47a070
https://www.globenewswire.com/NewsRoom/AttachmentNg/dda4e979-0133-47d2-8608-b37f4740a55b
https://www.globenewswire.com/NewsRoom/AttachmentNg/687b7276-1570-487f-9fb7-470aaa73b98d
https://www.globenewswire.com/NewsRoom/AttachmentNg/7a950e21-cf9b-4829-be40-e6f460ce61bd
https://www.globenewswire.com/NewsRoom/AttachmentNg/d1611b48-a373-4a32-808b-dd7942870c3f
https://www.globenewswire.com/NewsRoom/AttachmentNg/7e86c900-4f54-46c9-8538-cf5142b92b54