It wasn’t the result that speculators were likely anticipating. Although International Business Machines (IBM) delivered the goods for the first quarter, investors rushed for the exits. In terms of raw numbers, the subsequent selloff in IBM stock appears strange. The legacy tech giant posted 9.5% year-over-year growth to $15.92 billion while delivering adjusted earnings per share of $1.91, beating out analysts’ consensus targets.
However, shareholders were looking for a bit more juice, particularly from the company’s Software segment. In addition, management decided to maintain full-year guidance, likely in a bid to be prudent amid uncertainties related to the Iran war. Subsequently, IBM stock responded negatively to the somewhat pensive attitude, with shares down almost 9% in the trailing five sessions.
It’s worth pointing out that the smart money isn’t just treating the soft areas of the financial disclosure as a temporary hiccup. If you look at the volatility skew for the June 18 options chain, you’ll note that implied volatility (IV) scales up significantly as the strike price drops below Tuesday’s closing price of $233.04.
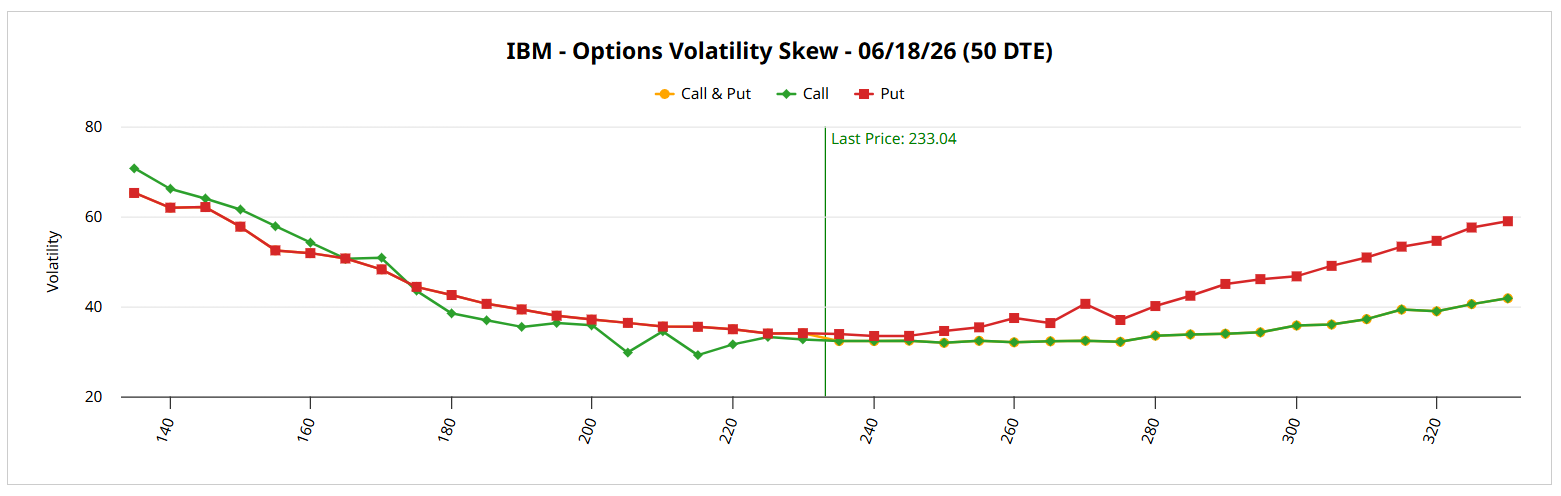
In a purely deductive system, a 10% move up and a 10% move down should have the same IV. However, the fact that the downside right now is more expensive means that the market has a structural bias toward fearing a crash more than it anticipates a melt-up.
In other words, at this moment, professional traders are paying more for accident insurance. However, we have to be clear that this doesn’t necessarily mean an accident is more likely. Instead, we’re observing a shift in cost rather than causality.
To put it simply, if you are bearish (on the debit side) on IBM stock, you would be paying a higher premium than you ordinarily would. However, if you are bullish, you would basically be buying a volatility discount. Specifically, by buying units of volatility at a discount compared to what a bearish trader is paying for the exact same distance move to the downside, you’re arbitraging the market’s fear.
Using the Inductive Method to ‘Justify’ the IBM Stock Trade
While volatility skew is informative, it functionally operates outside the ontology of probabilistic systems. Again, the fact that traders are currently paying more for accident insurance doesn’t necessarily correlate with a higher or lower probability of that accident occurring. It’s just that if the accident does occur and you’re not protected, the cost is likely to be steeper than normal.
For a debit trade, we need some framework for probabilities and that’s where induction comes in. Another term for pattern recognition, inductive methodologies rely on the uniformity of nature, that the future will resemble the past. If ‘Signal A’ is observed to produce an upswing 70% of the time, as a speculator, you’re tempted by the idea.
Of course, inductive models always run the risk of encountering the black swan. If you see a thousand white swans, that doesn’t necessarily mean that all swans are white. Once a black swan appears, the inductive assumption fails. However, because all forecasts of the unknown future in a non-deterministic system are necessarily inductive, this potential failure point is universal across stock models.
Another issue common among inductive methodologies is the variable definition of inputs, which is where discretization comes in. It’s difficult to assign endpoints in fundamental analysis; for example, what exactly does ‘good’ revenue mean? However, the frequency of weekly positive and negative candlesticks is a quantitative fact.
From here, I apply a Markovian logic, which basically asserts that the probability of the future state (of a non-deterministic system) materializing depends only on the current state. In my forecasting model, I consider a state to be a 10-week period of discretized weekly candlesticks. Therefore, in order to find what the probability is of the next state (10-week period), I need to reference the current state.
Running these datapoints through an advanced algorithm, we can gain a better understanding of how IBM stock responds according to specific conditions.
A Speculative Trade That Stands Out
Using a dataset that goes back to January 2019, a near-term trader buying IBM stock would be expected to enjoy an upward bias. Specifically, out of 363 rolling 10-week sequences, 202 of them popped higher than the starting price. This gives us an exceedance ratio of 55.6%.
Basically, if you were to buy IBM stock simultaneously across 100 parallel universes, you would expect to come out a winner roughly 56 times. However, the returns would likely be modest. Assuming a starting price of $233.04, the forward 10-week distribution would be expected to land between $232 and $238, with probability density peaking around $235.20.
Still, we’re not necessarily interested in buying IBM stock at random. Instead, we’re focused on the tendencies following the current state. In the last 10 weeks, IBM printed only four up weeks, leading to an overall downward slope. Under this specific profile, the forward distribution would be expected to shift positively between $220 and $270, with probability density estimated to peak at around $250.
With that information, it’s hard not to be excited about the 245/250 bull call spread expiring June 18. Here, the trader is aiming for IBM stock to rise through the $250 strike at expiration. If it does, the maximum payout comes out to nearly 178%.
On the date of publication, Josh Enomoto did not have (either directly or indirectly) positions in any of the securities mentioned in this article. All information and data in this article is solely for informational purposes. For more information please view the Barchart Disclosure Policy here.
More news from Barchart
- Intel Corp Has Unusual Long-Term Call Options Activity - Investors Bullish on Intel Stock?
- This IBM Stock Bull Spread Allows You to Take Advantage of the Market’s Fear
- ANET Earnings Play: Using Puts to Get Paid While You Wait
- Unusual Call Option Activity in CVS Ahead of Its Earnings Shows Investors are Bullish