
Intel Corporation (INTC) surpassed third-quarter profit and revenue forecasts, prompting a stock value surge. The tech titan recorded an adjusted EPS of 41 cents, notably higher than the projected 22 cents, while reporting revenue amounting to $14.16 billion, outshining analysts’ estimates of $13.53 billion.
Despite this, INTC’s revenue saw an 8% decline from the previous year’s $15.33 billion, marking the seventh consecutive quarter with dwindling sales. The corporation forecasts its revenue will see growth in the current quarter; however, it faces a competitive landscape and market uncertainties as customers shift their investments toward AI chips.
Intel’s Data Center and AI division, which offers server chips, saw sales decline 10% to $3.8 billion. This decrease is largely due to intensified competition and a shrinking overall market for server processors.
Meanwhile, Intel is implementing cost-reduction strategies set to cut costs by about $3 billion this year. Despite expressing optimism about this quarter, investing in INTC stock currently may not be opportune. To understand why, let’s delve into an analysis of INTC’s pivotal metrics.
Intel Corporation Financial Performance: Fluctuations, Declining Trends and Growth Rates (2020-2023)
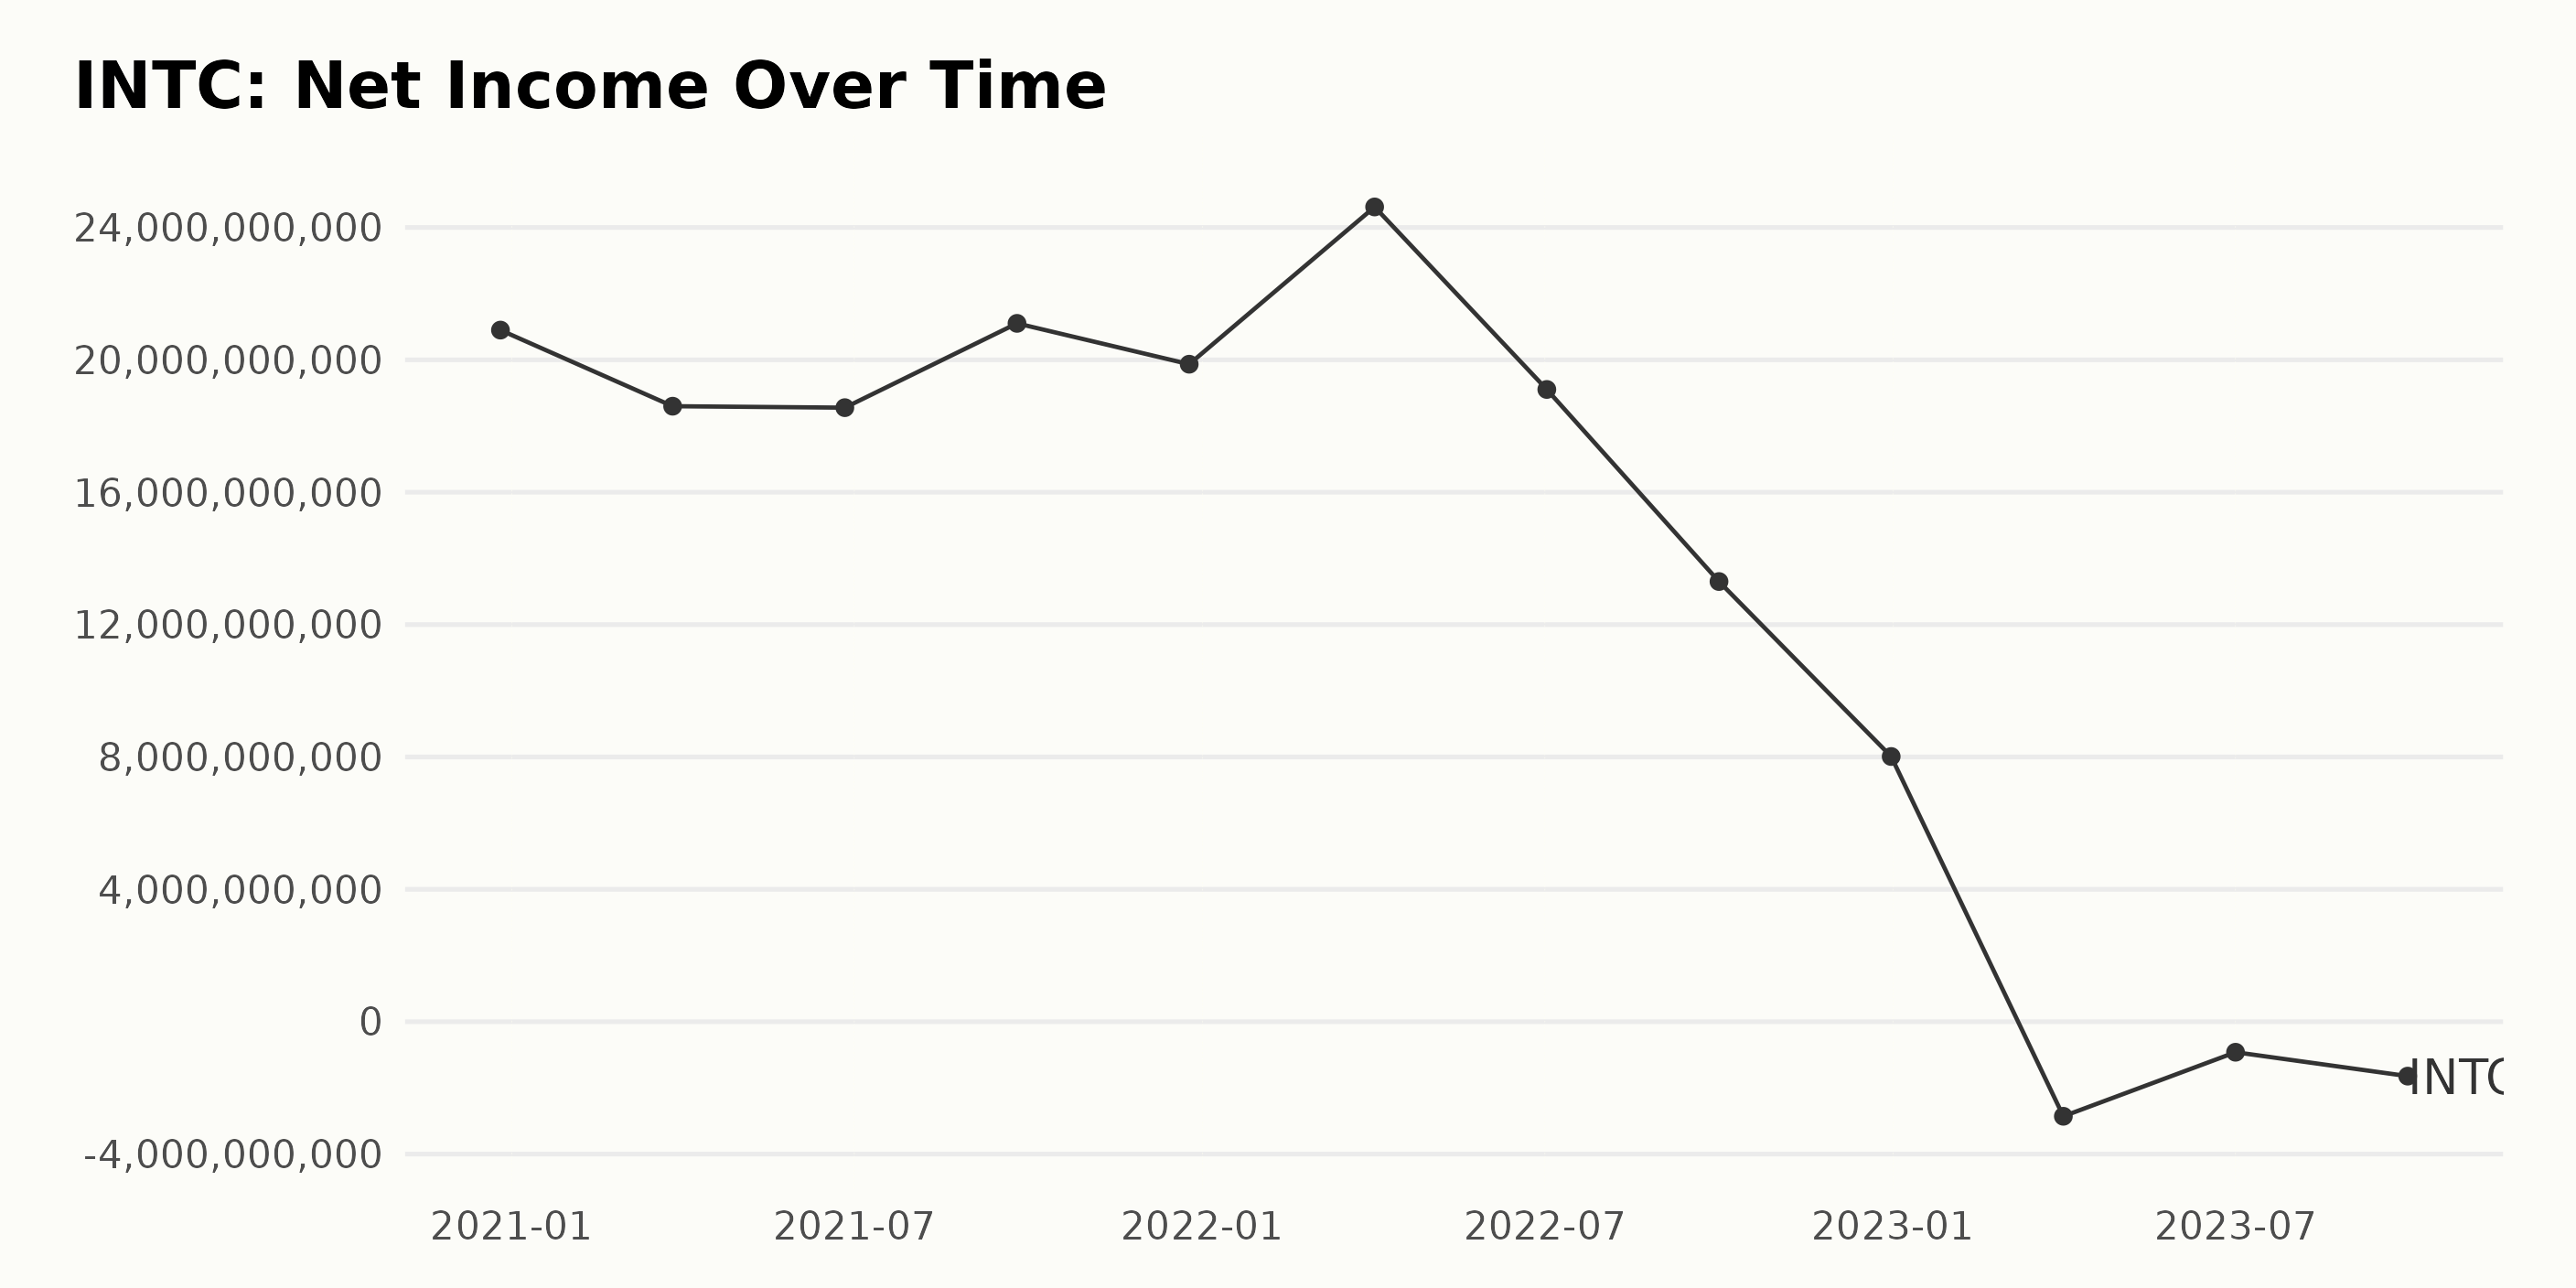
Here’s a summarized trend and fluctuation of INTC’s trailing-12-month net income from the provided data series:
- On December 26, 2020, INTC reported a Net Income of $20.90 billion.
- In the first quarter of 2021, specifically on March 27, there was a decline to $18.60 billion. This declined slightly further in the second, ending on June 26, 2021, at $18.55 billion.
- On September 25, 2021, the net income rebounded to $21.10 billion, however, this again dropped to $19.87 billion by the end of the year (December 25, 2021).
- For the greater part of 2022, relative instability was observed. Starting at a peak of $24.62 billion on April 02, it then fell progressively to $19.11 billion on July 02, dipped further to $13.30 billion on October 01, until finally closing the year at an all-time low of $8.01 billion on December 31.
- The downward trend then continued into 2023, when INTC reported a net income deficit for the first time: -$2.86 billion on April 01, -$0.92 billion on July 01, and -$1.64 billion by the end of the third quarter on September 30.
The overall performance over this period shows immense fluctuations, with a general downward trend from 2022 onwards. Comparing the first value ($20.90 billion) with the most recent value (-$1.64 billion) shows a significant negative growth rate, indicating a worrying performance for INTC in terms of their net income.
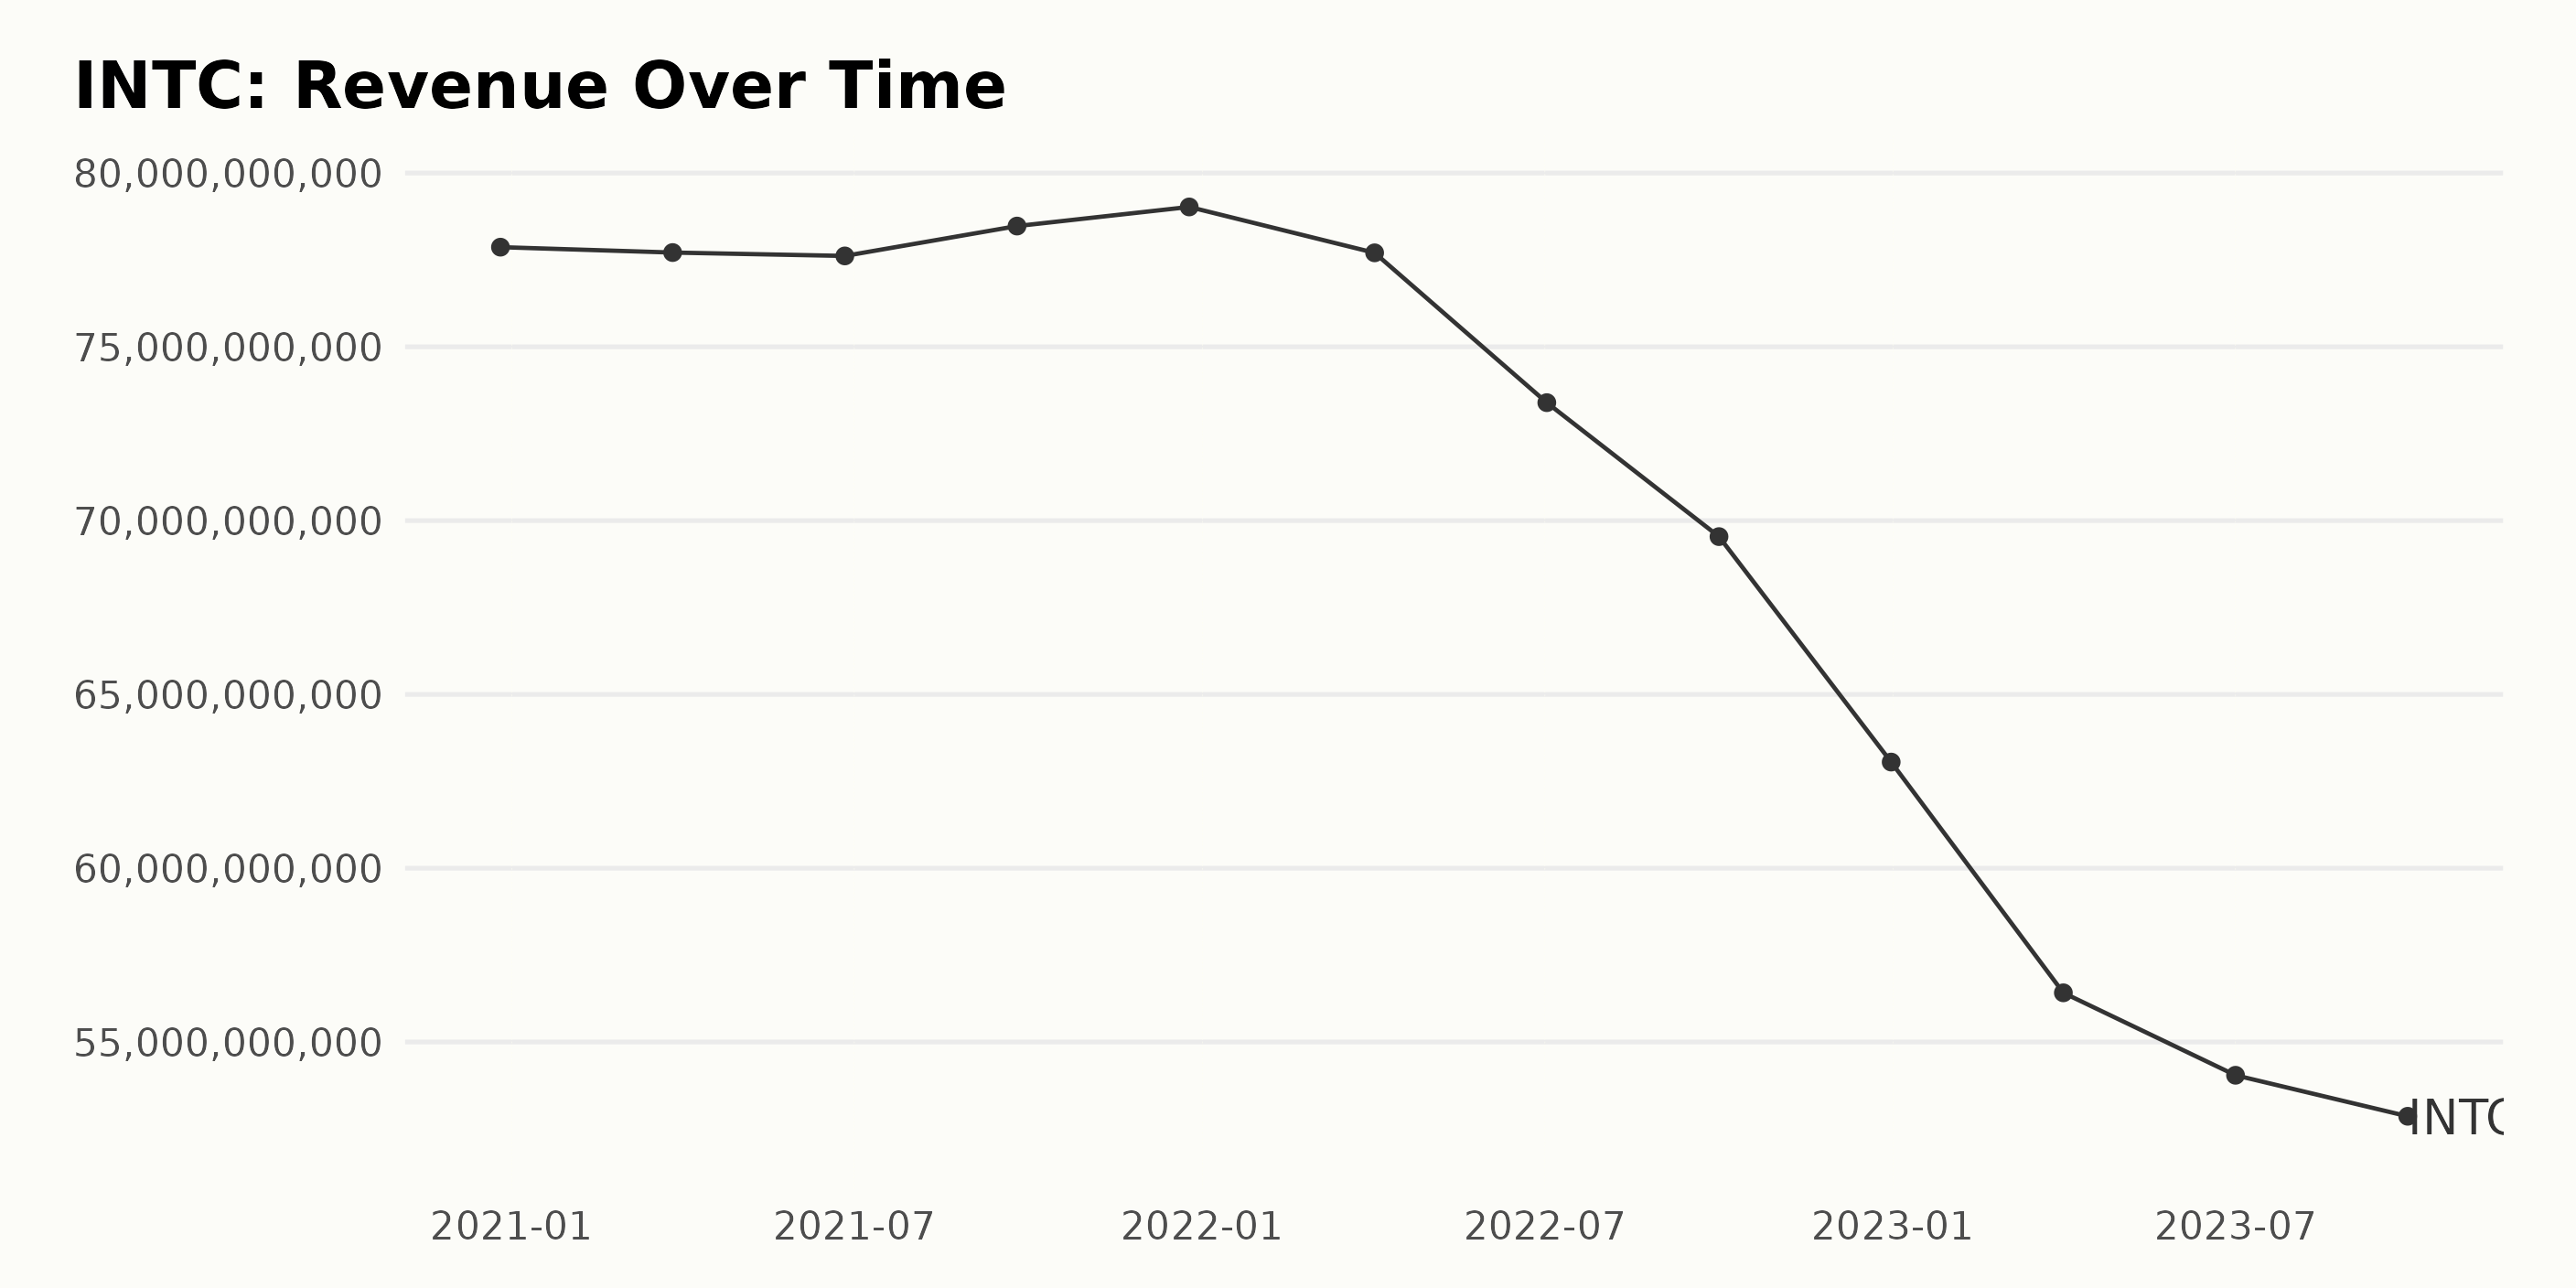
The trailing-12-month revenue trend of INTC indicates significant fluctuations over the time period in discussion, specifically from December 26, 2020, to September 30, 2023. Here is a summary:
- On December 26, 2020, the Revenue was $77.87 billion.
- Throughout 2021, there was a marginal decrease followed by a slight increase. This started with $77.71 billion in March, dropping to $77.61 billion in June, resurging to $78.47 billion in September, and culminating at $79.02 billion on December 25.
- However, 2022 saw a downward trend with successive reductions: from $77.70 billion in April, $73.39 billion in July, and $69.54 billion in October, down to $63.05 billion as of December 31, 2022.
- The downfall continued in 2023, where Revenue further shrank to $56.41 billion in April $54.04 billion in July, closing at $52.86 billion on September 30.
In brief, while 2021 witnessed some stability in the revenue stream, 2022 and 2023 experienced a clear declining trend. From the initial Revenue figure of $77.87 billion in 2020 to the last observed figure of $52.86 billion in 2023, there has been a decrease of approximately 32%. This accounts for the overall negative growth rate during this period.
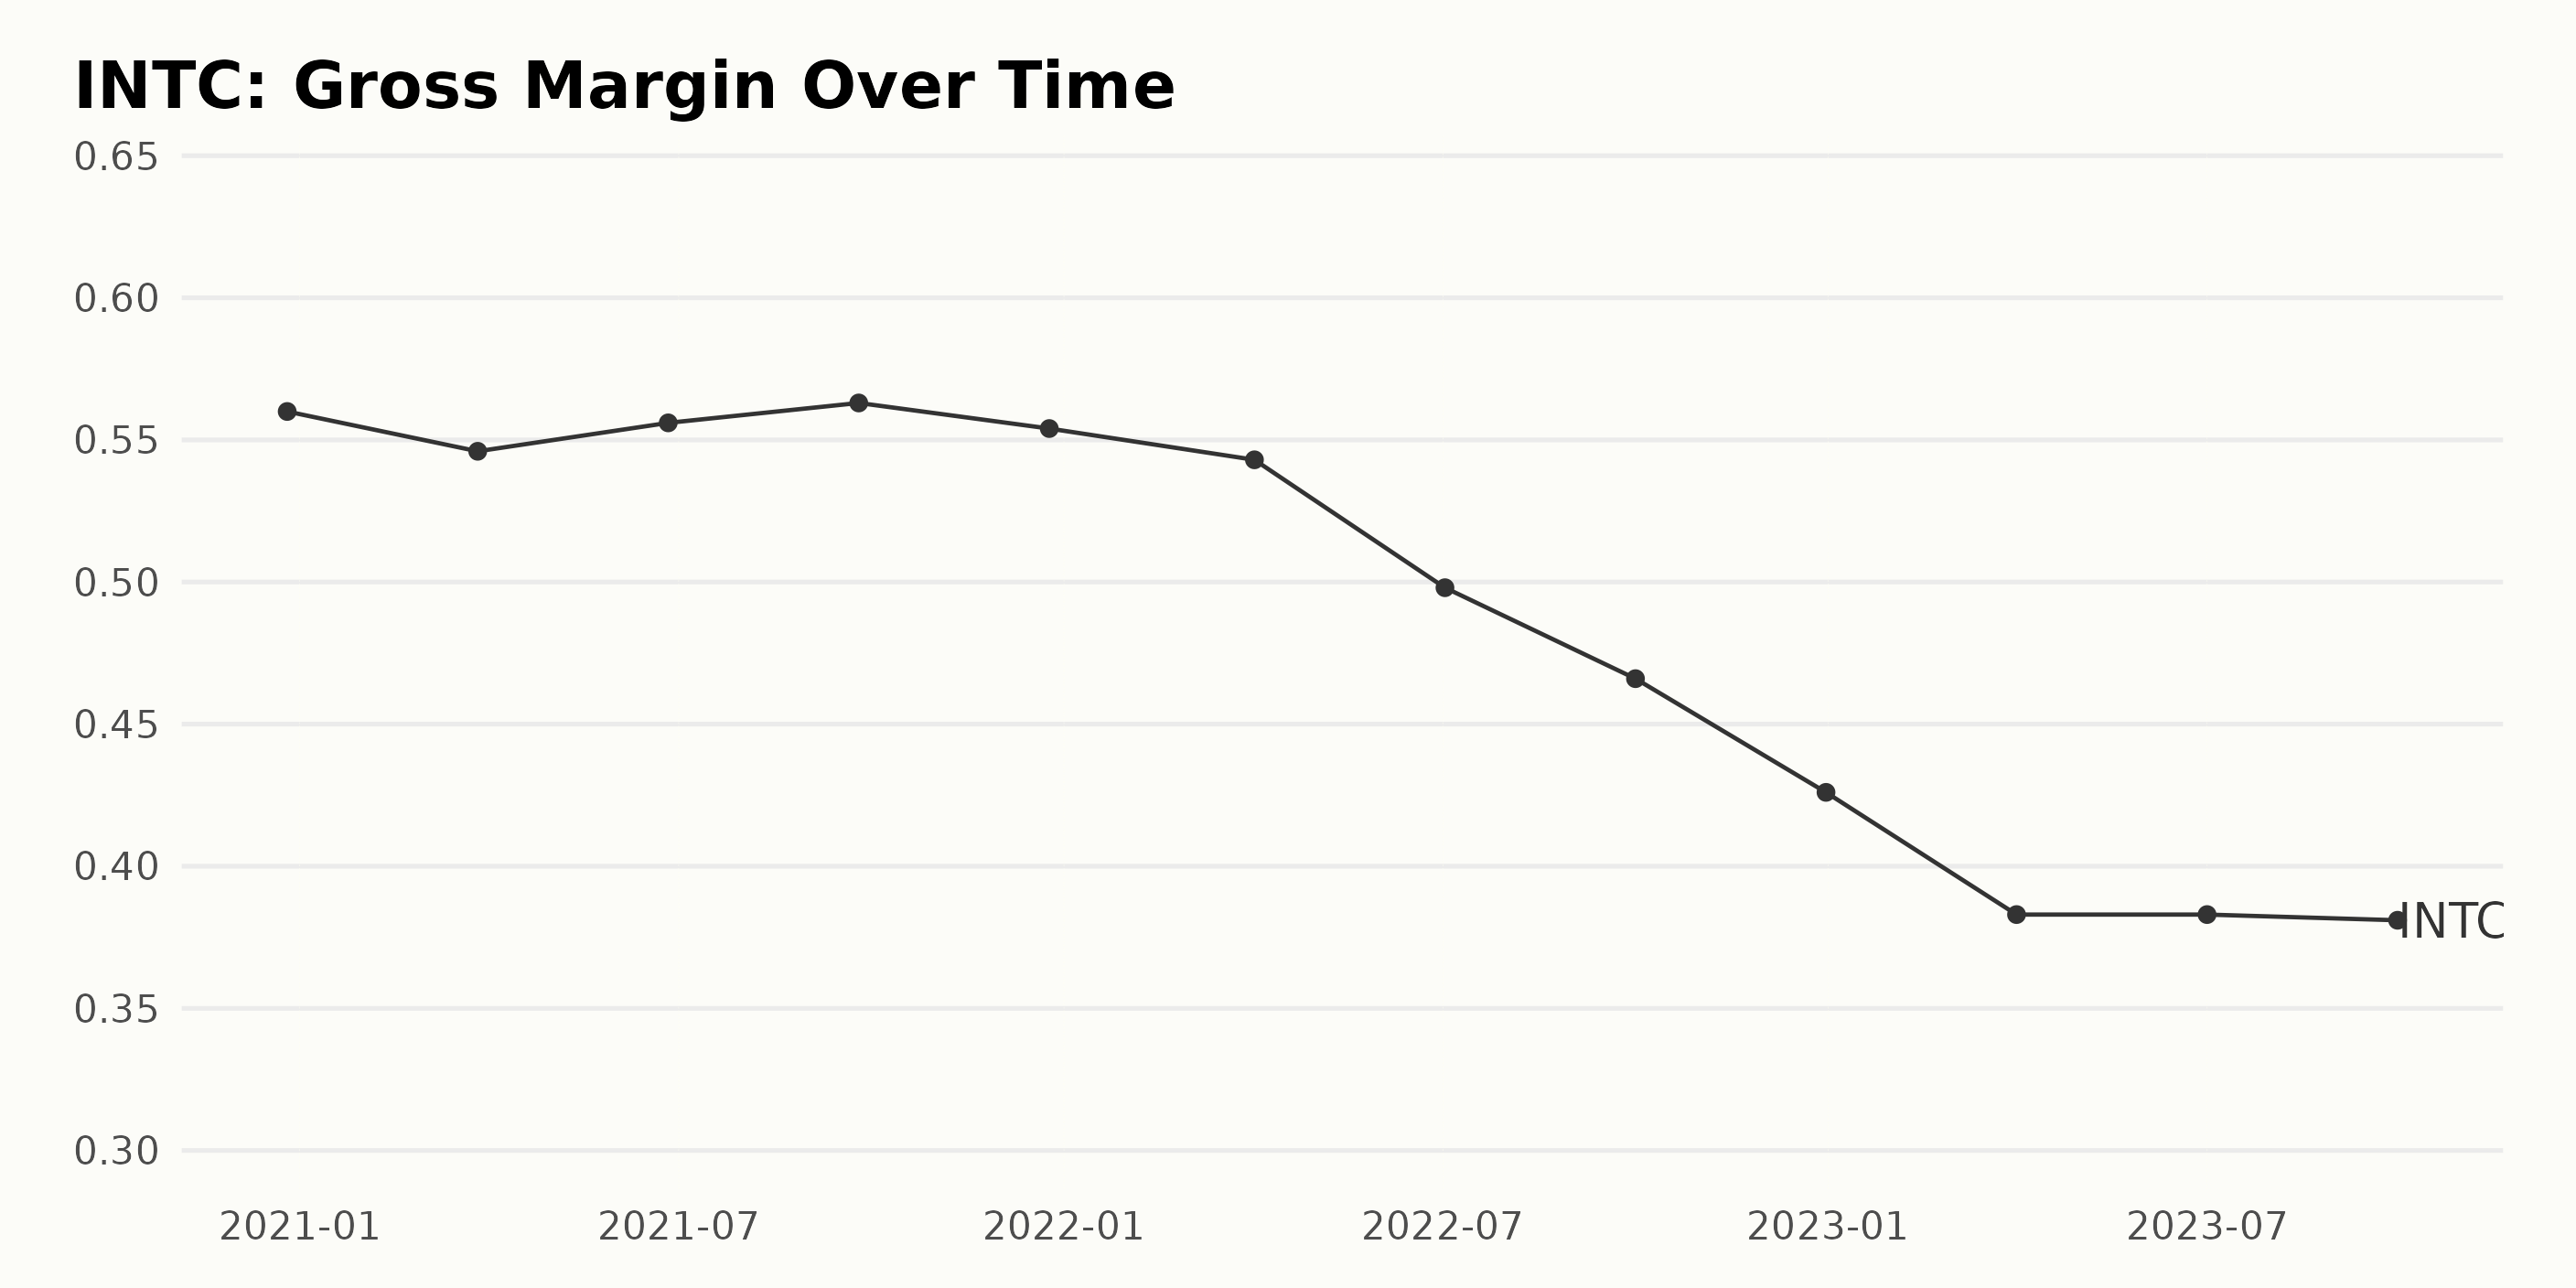
INTC’s Gross Margin data suggests a notable decreasing trend over the period from December 2020 to September 2023. Here are some significant points:
- Starting at 56% on December 26, 2020, the Gross Margin witnessed a slight up-and-down movement, reaching 54.4% by December 25, 2021.
- In 2022, there was a drastic decrease in the Gross Margin from 54.3% in April to 42.6% by the end of December.
- Throughout 2023, the Gross Margin stabilized somewhat but declined slightly, ending at 38.1% on September 30, 2023, marking the lowest point in the series.
Between December 26, 2020, and September 30, 2023, Intel’s Gross Margin decreased by 17.9%. This could highlight a fall in profitability and a worsening of operating efficiency in the company over this period. The trend has been more pronounced in the last part of the reported series, suggesting a need for strategic considerations to improve margins.
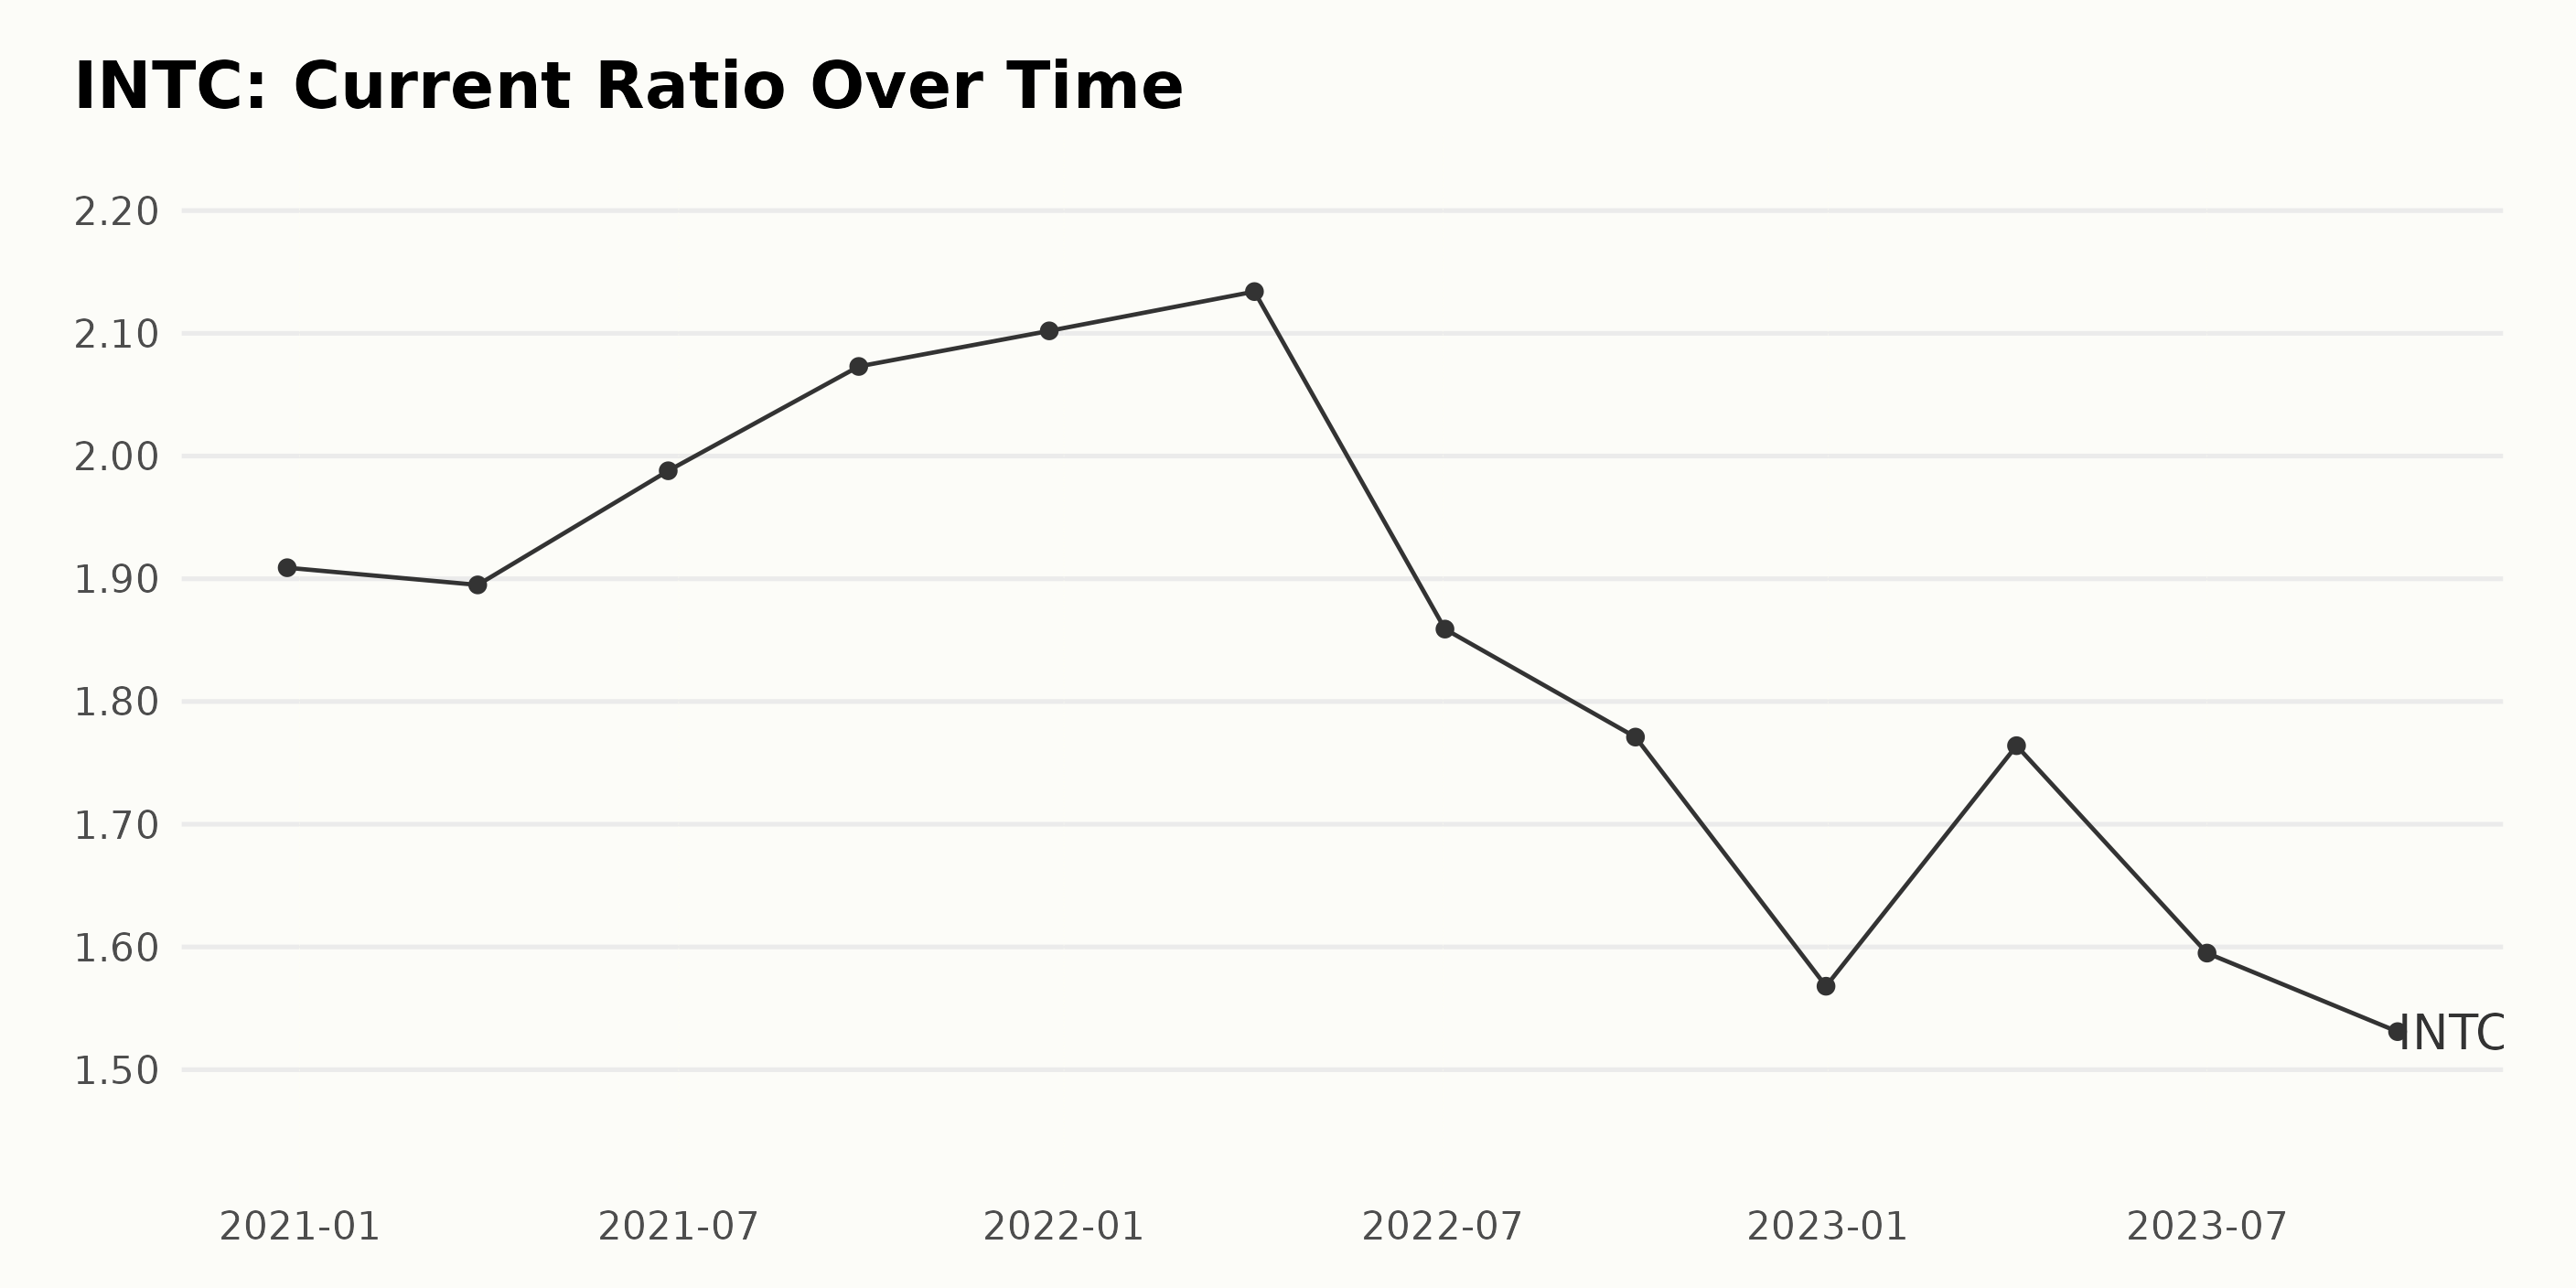
The Current Ratio of INTC shows a mixed trend with fluctuations from December 2020 to September 2023 based on the data series provided.
- On December 26, 2020, INTC’s Current Ratio was 1.91.
- There was a slight decrease to 1.89 as of March 27, 2021
- A subsequent increase was seen by June 26, 2021, with the ratio soaring to 1.99.
- The upward trend continued, reaching 2.07 on September 25, 2021, and gradually increased further, achieving the highest value of 2.13 as of April 2, 2022.
- However, after April 2022, the Current Ratio exhibited a declining trend with significant fluctuations, dropping to 1.77 on October 1, 2022, and then further dropped to its lowest recorded value of 1.57 on December 31, 2022.
- There was a slight recovery to 1.76 as of April 1, 2023, but it again fell back to 1.53 by the end of September 2023.
Comparing the most recent data with the initial data, INTC experienced a decrease in its Current Ratio from 1.91 in December 2020 to 1.53 in September 2023. This indicates a negative growth rate of approximately -20%. The consistent dip, especially in the more recent periods, suggests potential strains on the company’s liquidity position.
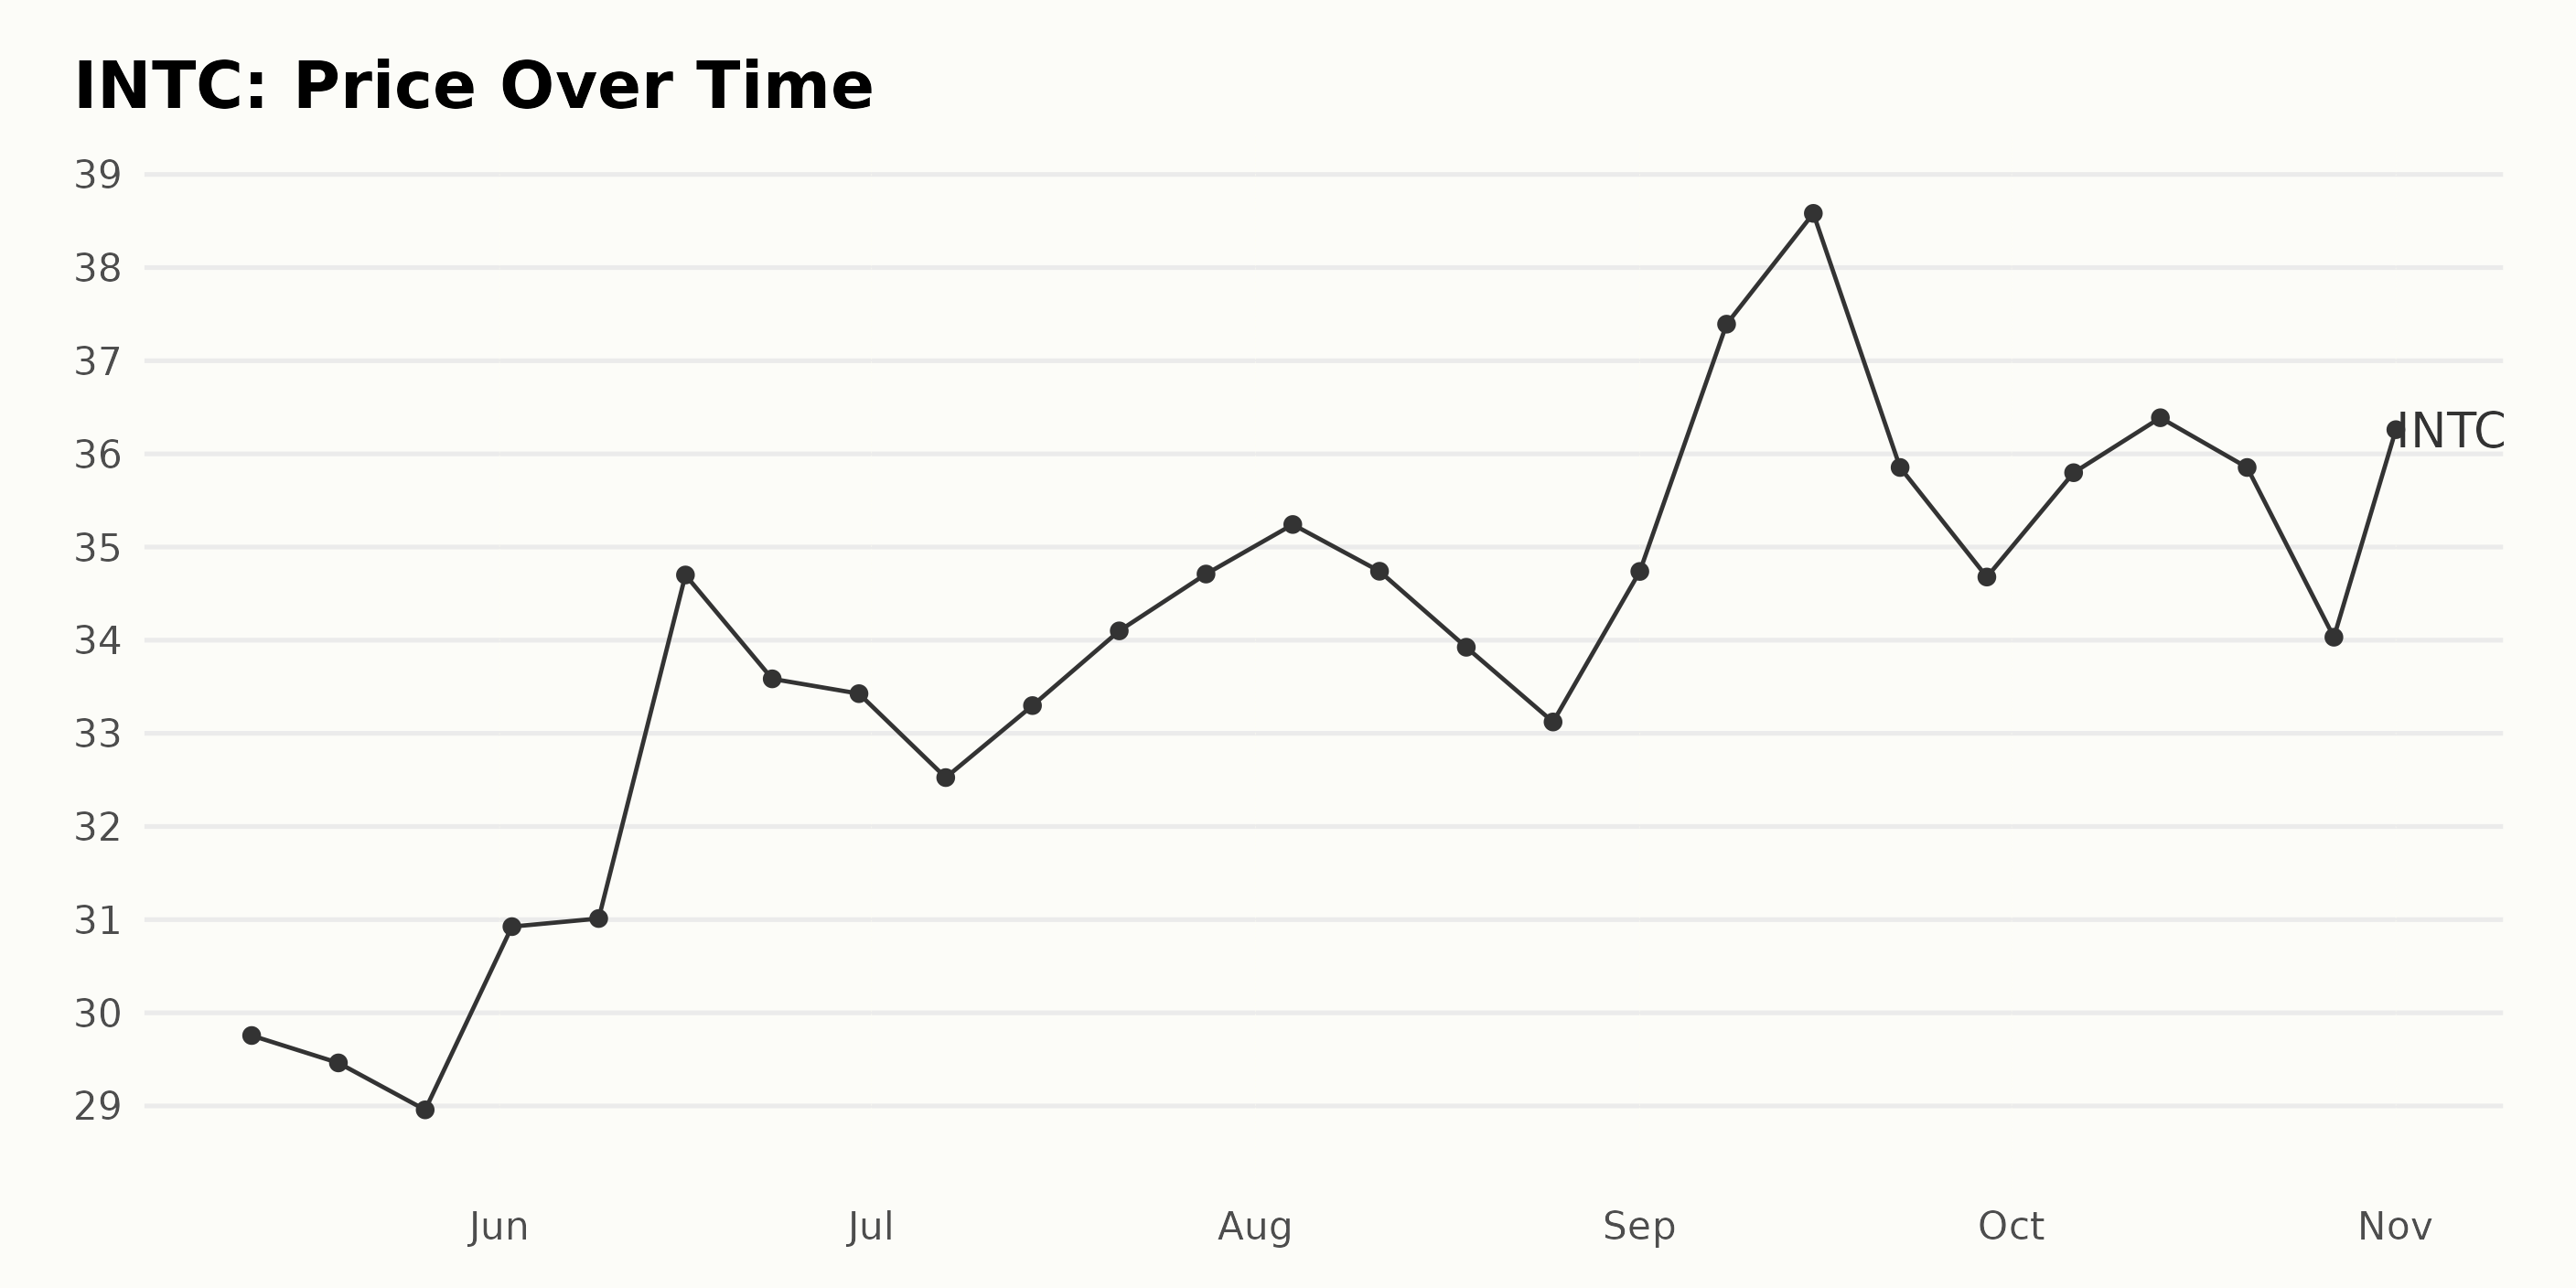
Intel’s Share Price Journey from May to November 2023: An Upward Trend Amid Volatility
The data provided outlines the share price for INTC from May to November 2023. The data presents a general upward trend, though with some fluctuation and a slight decrease near the end of the period.
- On May 12, 2023, the share price was $29.76.
- A minor decline is observed throughout May with the price dropping to $28.96 by May 26, 2023.
- Beginning in June, a clear ascending trend manifests. The share price marked an impressive growth spurt, reaching $30.93 on June 2, 2023, and progressing gradually to reach a peak of $34.70 on June 16, 2023.
- The share price experienced a slight dip towards the end of June ($33.43 on June 30), and then hovering around this mark through the first half of July.
- From mid-July through early August, the share prices climbed again, peaking at $35.24 on August 4, 2023.
- A period of volatility followed, with the price decreasing to $33.12 by August 25 and then escalating again to reach $37.39 by September 8, 2023 - the highest point within the data range.
- In September, share prices dipped again and lowered to $34.68 by the end of the month.
- October brought another wave of rise and fall, with prices starting at $35.80, peaking at $36.39, and then dipping again to end the month at $34.03.
- As of November 1, 2023, the share price rebounded to $36.26.
Overall, a generally increasing trend characterized the performance of INTC’s shares from May to November 2023, with some periods of volatility and minor dips. It is important to note, though, that the end price in November is higher than the initial price in May, suggesting a positive growth rate over this period despite the fluctuations. Here is a chart of INTC’s price over the past 180 days.
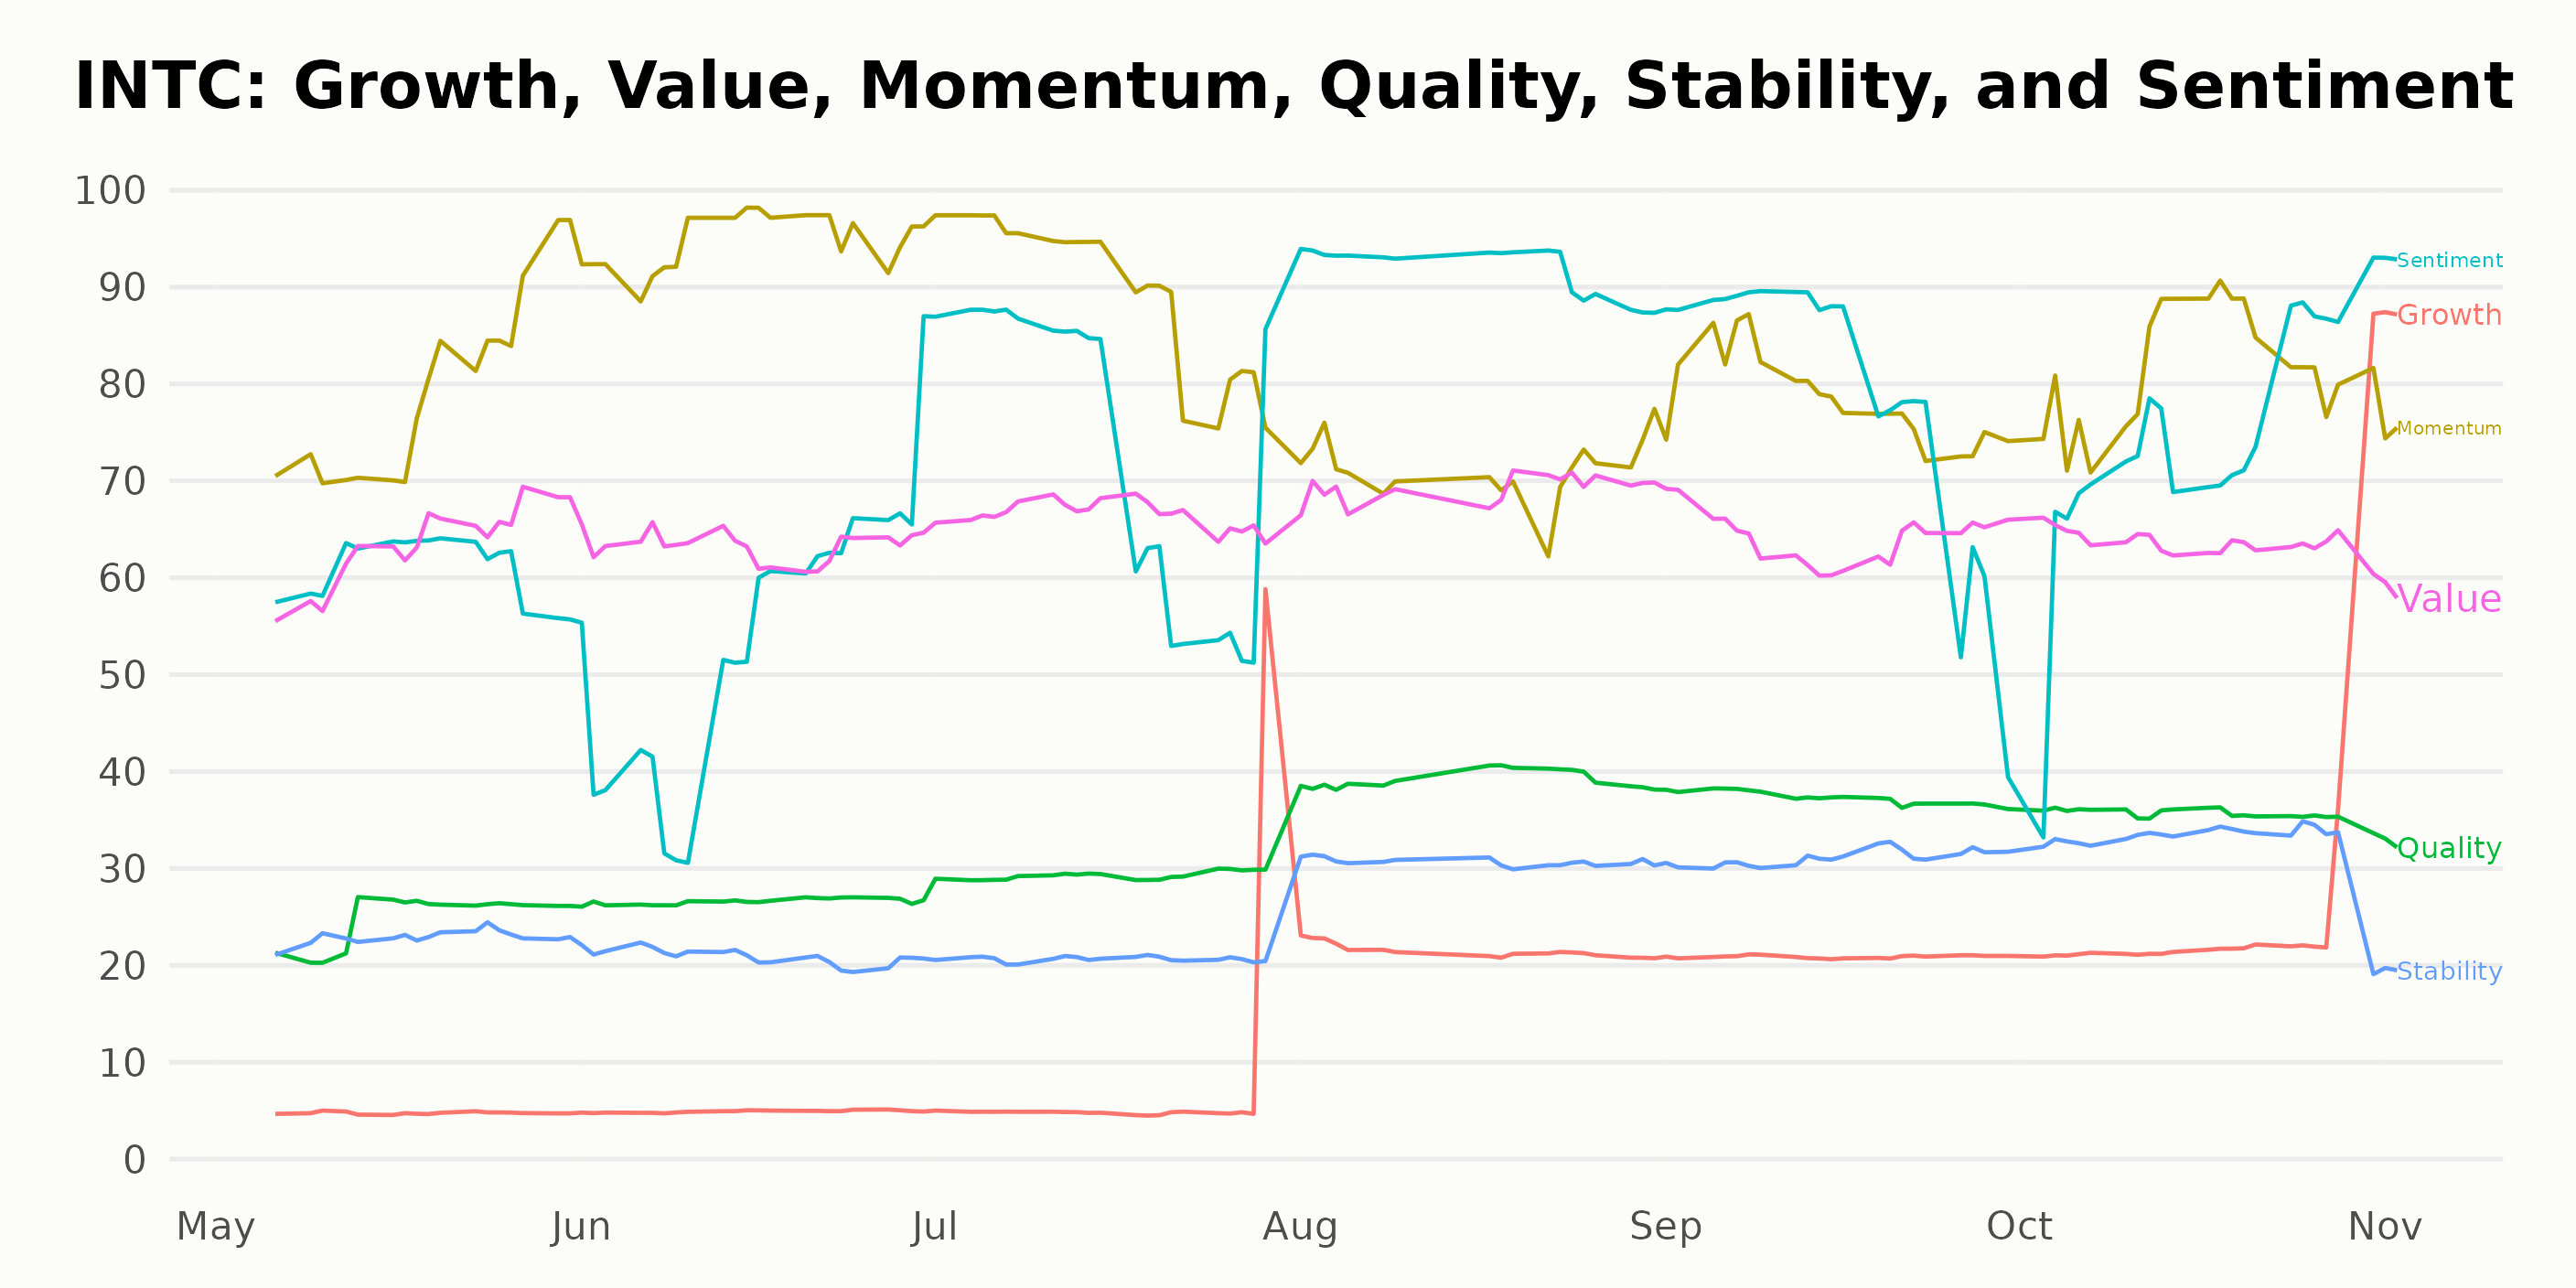
Intel Corporation’s Noteworthy POWR Ratings: Momentum, Sentiment, and Value Analysis
INTC has an overall C rating, translating to a Neutral in our POWR Ratings system. It is ranked #37 out of the 91 stocks in the Semiconductor & Wireless Chip category.
In the analysis of the POWR Ratings for INTC along the six dimensions of Growth, Momentum, Quality, Sentiment, Stability, and Value; three dimensions are especially noteworthy for holding the highest ratings. These prominent dimensions are momentum, sentiment, and value.
- Momentum: Momentum showed impressive scores throughout the period of data provided. It hit a peak in June 2023, with a remarkable rating of 95. Overall, momentum ratings have generally remained high, with values ranging from a low of 71 in August 2023 to a high of 95.
- Sentiment: Sentiment also represented strong ratings, peaking at 93 in November 2023. The trend for sentiment appeared to be inclined over the timeframe, commencing at 61 in May 2023 and gradually escalating to attain the highest point towards the end of the year.
- Value: The third noteworthy dimension is value, starting at 64 in May 2023 and showing minor fluctuations up until November 2023 where it decreased to 59. Despite some variability, value had maintained good ratings in comparison to other dimensions.
These findings could offer critical insights into the asset performance dynamics of Intel Corporation (INTC) according to the particular measurement categories within the POWR Ratings framework.
How does Intel Corporation (INTC) Stack Up Against its Peers?
Other stocks in the Semiconductor & Wireless Chip sector that may be worth considering are ChipMOS TECHNOLOGIES INC. (IMOS), Infineon Technologies AG (IFNNY), and Renesas Electronics Corporation (RNECF) -- they have better POWR Ratings.
What To Do Next?
43 year investment veteran, Steve Reitmeister, has just released his 2024 market outlook along with trading plan and top 11 picks for the year ahead.
INTC shares were trading at $37.49 per share on Thursday afternoon, up $0.20 (+0.54%). Year-to-date, INTC has gained 44.68%, versus a 13.68% rise in the benchmark S&P 500 index during the same period.
About the Author: Subhasree Kar

Subhasree’s keen interest in financial instruments led her to pursue a career as an investment analyst. After earning a Master’s degree in Economics, she gained knowledge of equity research and portfolio management at Finlatics.
The post Intel Corporation (INTC) Post-Earnings Analysis: Is It Time to Buy the Stock? appeared first on StockNews.com