

Tractor Supply Company (NASDAQ: TSCO), the largest rural lifestyle retailer in the United States, today announced financial results for its fourth quarter and fiscal year ended December 26, 2020.
This press release features multimedia. View the full release here: https://www.businesswire.com/news/home/20210128005200/en/
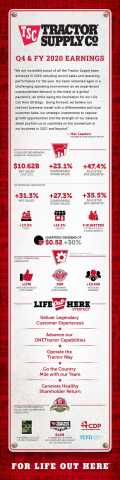
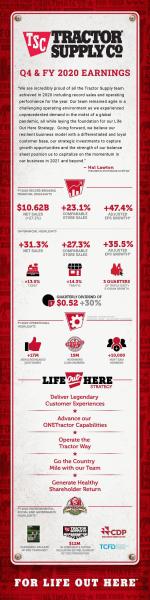
Tractor Supply issues infographic with highlights from the Company's Fourth Quarter and Fiscal Year 2020 Financial Results. (Photo: Business Wire)
- Company Achieves Record Sales and Earnings for Fiscal 2020
- Fourth Quarter Net Sales Increased 31.3%; Fourth Quarter Comparable Store Sales Increased 27.3%
- Fiscal Year Net Sales Increased 27.2%; Fiscal Year Comparable Store Sales Increased 23.1%
- Company Recorded Non-Cash Pre-Tax Impairment Charges of $74.1 million, or $0.49 per diluted share after-tax, related to the Petsense Business
- Fourth Quarter Diluted Earnings per Share (“EPS”) of $1.15 and Adjusted Diluted EPS of $1.641
- Fiscal Year 2020 Diluted EPS of $6.38 and Adjusted Diluted EPS of $6.871
- Company Provides Fiscal 2021 Diluted EPS Outlook of $6.50 to $6.90
- Board of Directors Increases Quarterly Dividend by 30% to $0.52 per share
1 See “Use and Reconciliation of Non-GAAP Financial Measures” below.
“We are incredibly proud of all the Tractor Supply team achieved in 2020 including record sales and operating performance for the year. My thanks and appreciation go out to the team for their support of each other, our customers and our longstanding commitment to the rural lifestyle. Our team remained agile in a challenging operating environment as we experienced unprecedented demand and welcomed a record number of new and reengaged customers to Tractor Supply,” said Hal Lawton, Tractor Supply’s President and Chief Executive Officer. “The team has done an exemplary job operating the business at elevated rates in the midst of a global pandemic, all while laying the foundation for our Life Out Here Strategy. Going forward, we believe our resilient business model with a differentiated and loyal customer base, our strategic investments to capture growth opportunities and the strength of our balance sheet position us to capitalize on the momentum in our business in 2021 and beyond.”
Lawton continued, “The 30% increase in our quarterly dividend by the Board of Directors and our recently resumed share repurchase program reflect our strong earnings performance and robust cash flows in 2020 and confidence in our business, as well as our ongoing commitment to total shareholder return.”
Fourth Quarter 2020 Highlights
Net sales increased 31.3% to $2.88 billion in the fourth quarter of 2020 from $2.19 billion in the fourth quarter of 2019. Comparable store sales increased 27.3% versus an increase of 0.1% in the prior year’s fourth quarter. The COVID-19 pandemic continued to have a significant, positive impact on consumer demand in the fourth quarter of 2020 across all of the Company’s major product categories as customers focused on the care of their homes, land and animals. Comparable store sales for the fourth quarter 2020 were driven by comparable average transaction count and ticket growth of 14.3% and 13.0%, respectively. The comparable store sales results also reflect a strong demand for everyday merchandise, including consumable, usable and edible products, and robust growth for seasonal categories. All geographic regions of the Company had robust comparable store sales growth. In addition, the Company’s e-commerce sales experienced triple-digit percentage growth for the third consecutive quarter.
Gross profit increased 34.2% to $995.5 million from $741.8 million in the fourth quarter of 2019, and gross margin rate increased 75 basis points to 34.6% from 33.8% in the prior year’s fourth quarter. The increase in gross margin was primarily attributable to a lower depth and frequency of sales promotions and less clearance activity, partially offset by higher transportation costs as a percent of net sales.
Selling, general and administrative (SG&A) expenses, including depreciation and amortization and asset impairment, increased 47.1% to $811.1 million from $551.4 million in the fourth quarter of 2019. As a percent of net sales, SG&A expenses increased 302 basis points to 28.2% from 25.2% in the prior year’s fourth quarter. The fourth quarter of 2020 results include non-cash impairment charges for the Petsense business of $74.1 million due primarily to a strategic reassessment of the business and a decision to reduce the number of new store openings planned over the long term and, to a lesser extent, the impairment of long-lived assets at underperforming locations. On an adjusted basis excluding the impact of the discrete impairment charges, SG&A expenses increased 33.7% to $737.0 million, or 46 basis points to 25.6% as a percent of net sales for the fourth quarter of 2020. The increase in adjusted SG&A as a percent of net sales was primarily attributable to incremental costs related to the COVID-19 pandemic, increased incentive compensation due to record sales and profit performance in the quarter with the majority allocated to the store teams, and investments in strategic initiatives. Additional costs incurred due to the COVID-19 pandemic include appreciation bonuses to Team Members in the Company’s stores and distribution centers as well as additional labor hours and supply costs dedicated to cleaning and sanitation to enhance the health and safety of Team Members and customers.
The effective income tax rate was 23.0% compared to a rate of 22.3% in the prior year’s fourth quarter.
Net income was $135.9 million, or $1.15 per diluted share, compared to net income of $144.2 million, or $1.21 per diluted share, in the fourth quarter of 2019. On an adjusted basis, net income was $193.2 million, or $1.64 per diluted share, in the fourth quarter of 2020.
The Company opened 19 new Tractor Supply stores and three new Petsense stores and closed four Petsense stores in the fourth quarter of 2020.
Fiscal 2020 Results
Net sales increased 27.2% to $10.62 billion in fiscal 2020 from $8.35 billion in fiscal 2019. Comparable store sales increased 23.1% versus a 2.7% increase in fiscal 2019. Gross profit increased 31.0% to $3.76 billion from $2.87 billion, and gross margin increased by 104 basis points to 35.4% from 34.4%.
SG&A expenses, including depreciation and amortization and asset impairment, increased 29.9% to $2.76 billion, and as a percent of net sales, SG&A expenses increased to 26.0% compared to 25.5% in fiscal 2019. On an adjusted basis excluding the impact of the discrete impairment charges, SG&A expenses increased 26.4% to $2.69 billion, or 25.3% as a percent of net sales in fiscal 2020.
The effective income tax rate was 22.6% compared to a rate of 22.3% in fiscal 2019.
For fiscal 2020, net income was $749.0 million, or $6.38 per diluted share, compared to $562.4 million, or $4.66 per diluted share, in fiscal 2019. On an adjusted basis, net income was $806.2 million, or $6.87 per diluted share, for fiscal 2020.
The Company repurchased approximately 3.4 million shares of its common stock for $343.0 million and paid quarterly cash dividends totaling $174.6 million, returning $517.6 million of capital to shareholders in fiscal 2020.
During fiscal 2020, the Company opened 80 new Tractor Supply stores and nine new Petsense stores and closed one Tractor Supply store and seven Petsense stores.
Fiscal 2021 Outlook
The impact that the COVID-19 pandemic will have on the broader economy and the Company’s fiscal 2021 results remains uncertain. Given the nature of the COVID-19 pandemic on the macro economy and the consumer, the Company is planning for fiscal 2021 based on a range of potential outcomes. The Company is providing the following initial guidance for the results of operations expected for fiscal 2021:
Net Sales | $10.7 billion - $11.0 billion | ||
Comparable Store Sales | (2.0%) - +1.0% | ||
Operating Margin Rate | 9.3% to 9.6% | ||
Net Income | $750 million - $800 million | ||
Earnings per Diluted Share | $6.50 - $6.90 | ||
Capital Expenditures | $450 million - $550 million | ||
The Company’s diluted EPS guidance assumes an estimated effective income tax rate of 22.5% to 22.8%.
Share repurchases for fiscal 2021 are expected to reduce diluted weighted average shares outstanding by one to two percent. Anticipated capital expenditures include new store growth of approximately 80 new Tractor Supply and 10 new Petsense store openings.
The Company continues to have a strong liquidity position with current cash and cash equivalents of approximately $1.34 billion and no amounts drawn on its $500 million revolving credit facility as of December 26, 2020.
Quarterly Dividend
Tractor Supply’s Board of Directors declared a quarterly cash dividend per share of the Company’s common stock of $0.52, which is a 30% increase over the prior quarterly dividend.
The dividend will be paid on March 9, 2021, to stockholders of record of the Company’s common stock as of the close of business on February 22, 2021.
Conference Call and Presentation Information
Tractor Supply Company will hold a conference call today, Thursday, January 28, 2021 at 9:00 a.m. CT / 10:00 a.m. ET, hosted by Hal Lawton, Chief Executive Officer, and Kurt Barton, Chief Financial Officer. The call will be broadcast over the Internet on the Company’s website live at IR.TractorSupply.com. The Company has also made available an Investor Presentation on the investor relations section of the Company's website.
Please allow extra time prior to the call to visit the site and download the streaming media software required to listen to the Internet broadcast. A replay of the webcast will also be available at IR.TractorSupply.com shortly after the conference call concludes.
About Tractor Supply Company
Tractor Supply Company (NASDAQ: TSCO), the largest rural lifestyle retailer in the United States, has been passionate about serving its unique niche, as a one-stop shop for recreational farmers, ranchers and all those who enjoy living the rural lifestyle, for more than 80 years. Tractor Supply offers an extensive mix of products necessary to care for home, land, pets and animals with a focus on product localization, exclusive brands and legendary customer service that addresses the needs of the Out Here lifestyle. With more than 42,000 Team Members, the Company leverages its physical store assets with digital capabilities to offer customers the convenience of purchasing products they need anytime, anywhere and any way they choose at the everyday low prices they deserve. At December 26, 2020, the Company operated 1,923 Tractor Supply stores in 49 states and an e-commerce website at www.TractorSupply.com.
Tractor Supply Company also owns and operates Petsense, a small-box pet specialty supply retailer focused on meeting the needs of pet owners, primarily in small and mid-size communities, and offering a variety of pet products and services. At December 26, 2020, the Company operated 182 Petsense stores in 25 states. For more information on Petsense, visit www.Petsense.com.
Forward Looking Statements
As with any business, all phases of the Company’s operations are subject to influences outside its control. This press release contains certain forward-looking statements, including statements regarding sales and earnings growth, long-term financial growth rate targets, estimated results of operations, including, but not limited to, operating margins, net income and comparable store sales, and capital expenditures. Other factors affecting future results include the timing of normalized macroeconomic conditions from the impacts of the COVID-19 pandemic, the Company’s ability to predict the timing of normalized macroeconomic conditions, the timing and amount of share repurchases, marketing, merchandising and strategic initiatives and new store and distribution center openings and expenses in future periods, including incremental costs associated with COVID-19. All forward-looking statements are subject to the safe harbor provisions of the Private Securities Litigation Reform Act of 1995 and are subject to the finalization of the Company’s quarterly financial and accounting procedures, and may be affected by certain risks and uncertainties, any one, or a combination, of which could materially affect the results of the Company’s operations. These factors include, without limitation, national, regional and local economic conditions affecting consumer spending, including the effects of COVID-19, the effects that “shelter in place” or other similar mandated or suggested social distancing protocols could have on the business, the costs of doing business as a retailer during the COVID-19 pandemic, the effectiveness of the Company’s responses to COVID-19 and customer response with respect to those actions, the effects of COVID-19 on our suppliers, business partners and supply chain, the timing and acceptance of new products, the timing and mix of goods sold, weather conditions, the seasonal nature of the business, transportation costs, including but not limited to, carrier rates and fuel costs, purchase price volatility (including inflationary and deflationary pressures), the ability to increase sales at existing stores, the ability to manage growth and identify suitable locations, failure of an acquisition to produce anticipated results, the ability to successfully manage expenses, particularly in light of COVID-19, including but not limited to, increases in wages, and execute key gross margin enhancing initiatives, the availability of favorable credit sources, capital market conditions in general, the ability to open new stores in the manner, timing and number currently contemplated, the impact of new stores on the business, competition, including competition from online retailers, effective merchandising initiatives and marketing emphasis, the ability to retain vendors, reliance on foreign suppliers, the ability to attract, train and retain qualified employees, product liability and other claims, changes in federal, state or local regulations, potential judgments, fines, legal fees and other costs, breach of information systems or theft of employee or customer data, ongoing and potential future legal or regulatory proceedings, management of the Company’s information systems, failure to develop and implement new technologies, the failure of customer-facing technology systems, business disruption including from the implementation of supply chain technologies, effective tax rate changes, including expected effects of the Tax Cuts and Jobs Act, and results of examination by taxing authorities, the imposition of tariffs on imported products or the disallowance of tax deductions on imported products, the ability to maintain an effective system of internal control over financial reporting, and changes in accounting standards, assumptions and estimates. Forward-looking statements made by or on behalf of the Company are based on knowledge of its business and the environment in which it operates, but because of the factors listed above, actual results could differ materially from those reflected by any forward-looking statements. Consequently, all of the forward-looking statements made are qualified by these cautionary statements and those contained in the Company’s Annual Report on Form 10-K and other filings with the Securities and Exchange Commission. There can be no assurance that the results or developments anticipated by the Company will be realized or, even if substantially realized, that they will have the expected consequences to or effects on the Company or its business and operations. Readers are cautioned not to place undue reliance on these forward-looking statements, which speak only as of the date hereof. The Company does not undertake any obligation to release publicly any revisions to these forward-looking statements to reflect events or circumstances after the date hereof or to reflect the occurrence of unanticipated events.
(Financial tables to follow)
Condensed Consolidated Statements of Income (Unaudited) (in thousands, except per share amounts) | |||||||||||||||||||||||||||
FOURTH QUARTER ENDED | YEAR ENDED | ||||||||||||||||||||||||||
December 26,
| December 28,
| December 26,
| December 28,
| ||||||||||||||||||||||||
% of | % of | % of | % of | ||||||||||||||||||||||||
Net | Net | Net | Net | ||||||||||||||||||||||||
Sales | Sales | Sales | Sales | ||||||||||||||||||||||||
Net sales | $ | 2,878,265 | 100.00 | % | $ | 2,191,785 | 100.00 | % | $ | 10,620,352 | 100.00 | % | $ | 8,351,931 | 100.00 | % | |||||||||||
Cost of merchandise sold | 1,882,735 | 65.41 | 1,449,984 | 66.16 | 6,858,803 | 64.58 | 5,480,161 | 65.62 | |||||||||||||||||||
Gross profit | 995,530 | 34.59 | 741,801 | 33.84 | 3,761,549 | 35.42 | 2,871,770 | 34.38 | |||||||||||||||||||
Selling, general and administrative expenses | 683,600 | 23.75 | 499,969 | 22.81 | 2,478,524 | 23.34 | 1,932,572 | 23.14 | |||||||||||||||||||
Depreciation and amortization | 58,490 | 2.03 | 51,394 | 2.34 | 217,124 | 2.04 | 195,978 | 2.34 | |||||||||||||||||||
Impairment of goodwill and other intangible assets | 68,973 | 2.40 | — | — | 68,973 | 0.65 | — | — | |||||||||||||||||||
Operating income | 184,467 | 6.41 | 190,438 | 8.69 | 996,928 | 9.39 | 743,220 | 8.90 | |||||||||||||||||||
Interest expense, net | 8,086 | 0.28 | 4,837 | 0.22 | 28,781 | 0.27 | 19,843 | 0.24 | |||||||||||||||||||
Income before income taxes | 176,381 | 6.13 | 185,601 | 8.47 | 968,147 | 9.12 | 723,377 | 8.66 | |||||||||||||||||||
Income tax expense | 40,488 | 1.41 | 41,422 | 1.89 | 219,189 | 2.07 | 161,023 | 1.93 | |||||||||||||||||||
Net income | $ | 135,893 | 4.72 | % | $ | 144,179 | 6.58 | % | $ | 748,958 | 7.05 | % | $ | 562,354 | 6.73 | % | |||||||||||
Net income per share: | |||||||||||||||||||||||||||
Basic | $ | 1.17 | $ | 1.22 | $ | 6.44 | $ | 4.70 | |||||||||||||||||||
Diluted | $ | 1.15 | $ | 1.21 | $ | 6.38 | $ | 4.66 | |||||||||||||||||||
Weighted average shares outstanding: | |||||||||||||||||||||||||||
Basic | 116,492 | 118,370 | 116,370 | 119,727 | |||||||||||||||||||||||
Diluted | 117,757 | 119,255 | 117,436 | 120,743 | |||||||||||||||||||||||
Dividends declared per common share outstanding | $ | 0.40 | $ | 0.35 | $ | 1.50 | $ | 1.36 | |||||||||||||||||||
Condensed Consolidated Statements of Comprehensive Income (Unaudited) (in thousands) | |||||||||||||||
FOURTH QUARTER ENDED | YEAR ENDED | ||||||||||||||
December 26,
| December 28,
| December 26,
| December 28,
| ||||||||||||
Net income | $ | 135,893 | $ | 144,179 | $ | 748,958 | $ | 562,354 | |||||||
Other comprehensive income/(loss): | |||||||||||||||
Change in fair value of interest rate swaps, net of taxes | 2,624 | 126 | (3,442) | (4,332) | |||||||||||
Total other comprehensive income/(loss) | 2,624 | 126 | (3,442) | (4,332) | |||||||||||
Total comprehensive income | $ | 138,517 | $ | 144,305 | $ | 745,516 | $ | 558,022 | |||||||
Condensed Consolidated Balance Sheets (Unaudited) (in thousands) | |||||||
December 26,
| December 28,
| ||||||
ASSETS | |||||||
Current assets: | |||||||
Cash and cash equivalents | $ | 1,341,756 | $ | 84,241 | |||
Inventories | 1,783,270 | 1,602,781 | |||||
Prepaid expenses and other current assets | 133,659 | 100,865 | |||||
Total current assets | 3,258,685 | 1,787,887 | |||||
Property and equipment, net | 1,248,960 | 1,163,956 | |||||
Operating lease right-of-use assets | 2,423,881 | 2,188,802 | |||||
Goodwill and other intangible assets | 55,520 | 124,492 | |||||
Deferred income taxes | 31,586 | — | |||||
Other assets | 30,484 | 24,131 | |||||
Total assets | $ | 7,049,116 | $ | 5,289,268 | |||
LIABILITIES AND STOCKHOLDERS’ EQUITY | |||||||
Current liabilities: | |||||||
Accounts payable | $ | 976,096 | $ | 643,036 | |||
Accrued employee compensation | 119,701 | 39,755 | |||||
Other accrued expenses | 324,813 | 247,690 | |||||
Current portion of long-term debt | — | 30,000 | |||||
Current portion of finance lease liabilities | 4,554 | 4,036 | |||||
Current portion of operating lease liabilities | 298,696 | 277,099 | |||||
Income taxes payable | 19,938 | 5,984 | |||||
Total current liabilities | 1,743,798 | 1,247,600 | |||||
Long-term debt | 984,324 | 366,480 | |||||
Finance lease liabilities, less current portion | 33,096 | 30,389 | |||||
Operating lease liabilities, less current portion | 2,220,904 | 2,001,162 | |||||
Deferred income taxes | — | 153 | |||||
Other long-term liabilities | 143,154 | 76,361 | |||||
Total liabilities | 5,125,276 | 3,722,145 | |||||
Stockholders’ equity: | |||||||
Common stock | 1,401 | 1,389 | |||||
Additional paid-in capital | 1,095,500 | 966,698 | |||||
Treasury stock | (3,356,953) | (3,013,996) | |||||
Accumulated other comprehensive (loss)/income | (3,243) | 199 | |||||
Retained earnings | 4,187,135 | 3,612,833 | |||||
Total stockholders’ equity | 1,923,840 | 1,567,123 | |||||
Total liabilities and stockholders’ equity | $ | 7,049,116 | $ | 5,289,268 | |||
Condensed Consolidated Statements of Cash Flows (Unaudited) (in thousands) | |||||||
YEAR ENDED | |||||||
December 26, 2020 | December 28, 2019 | ||||||
Cash flows from operating activities: | |||||||
Net income | $ | 748,958 | $ | 562,354 | |||
Adjustments to reconcile net income to net cash provided by operating activities: | |||||||
Depreciation and amortization | 217,124 | 195,978 | |||||
Impairment of goodwill and other intangible assets | 68,973 | — | |||||
Impairment of other long-lived assets | 5,078 | — | |||||
Gain on disposition of property and equipment | (1,157) | (297) | |||||
Share-based compensation expense | 37,273 | 31,136 | |||||
Deferred income taxes | (31,739) | 6,760 | |||||
Change in assets and liabilities: | |||||||
Inventories | (180,489) | (13,239) | |||||
Prepaid expenses and other current assets | (32,794) | 13,582 | |||||
Accounts payable | 333,060 | 23,055 | |||||
Accrued employee compensation | 79,946 | (14,291) | |||||
Other accrued expenses | 72,405 | 10,351 | |||||
Income taxes | 13,954 | 8,327 | |||||
Other | 63,923 | (12,000) | |||||
Net cash provided by operating activities | 1,394,515 | 811,716 | |||||
Cash flows from investing activities: | |||||||
Capital expenditures | (294,002) | (217,450) | |||||
Proceeds from sale of property and equipment | 1,792 | 2,489 | |||||
Net cash used in investing activities | (292,210) | (214,961) | |||||
Cash flows from financing activities: | |||||||
Borrowings under debt facilities | 2,009,000 | 1,002,000 | |||||
Repayments under debt facilities | (1,406,500) | (1,013,250) | |||||
Debt discounts and issuance costs | (17,048) | — | |||||
Principal payments under finance lease liabilities | (4,170) | (3,708) | |||||
Repurchase of shares to satisfy tax obligations | (7,799) | (3,818) | |||||
Repurchase of common stock | (342,957) | (533,319) | |||||
Net proceeds from issuance of common stock | 99,340 | 115,981 | |||||
Cash dividends paid to stockholders | (174,656) | (162,699) | |||||
Net cash provided by/(used in) financing activities | 155,210 | (598,813) | |||||
Net change in cash and cash equivalents | 1,257,515 | (2,058) | |||||
Cash and cash equivalents at beginning of period | 84,241 | 86,299 | |||||
Cash and cash equivalents at end of period | $ | 1,341,756 | $ | 84,241 | |||
Supplemental disclosures of cash flow information: | |||||||
Cash paid during the period for: | |||||||
Interest | $ | 24,540 | $ | 19,146 | |||
Income taxes | 235,319 | 144,377 | |||||
Supplemental disclosures of non-cash activities: | |||||||
Non-cash accruals for construction in progress | $ | 12,642 | $ | 7,924 | |||
Increase of operating lease assets and liabilities from new or modified leases | 524,141 | 365,233 | |||||
Increase of finance lease assets and liabilities from new or modified leases | 7,395 | 5,217 | |||||
Operating lease assets and liabilities recognized upon adoption of ASC 842 | — | 2,084,880 | |||||
Selected Financial and Operating Information (Unaudited) | ||||||||||||
FOURTH QUARTER ENDED | YEAR ENDED | |||||||||||
December 26,
| December 28,
| December 26,
| December 28,
| |||||||||
Sales Information: | ||||||||||||
Comparable store sales increase | 27.3 | % | 0.1 | % | 23.1 | % | 2.7 | % | ||||
New store sales (% of total sales) | 3.2 | % | 2.6 | % | 3.3 | % | 2.8 | % | ||||
Average transaction value | $53.07 | $47.85 | $51.90 | $46.89 | ||||||||
Comparable store average transaction value increase (a) | 13.0 | % | 1.8 | % | 12.2 | % | 2.4 | % | ||||
Comparable store average transaction count increase/(decrease) | 14.3 | % | (1.7) | % | 10.9 | % | 0.3 | % | ||||
Total selling square footage (000’s) | 32,139 | 30,854 | 32,139 | 30,854 | ||||||||
Exclusive brands (% of total sales) | 29.7 | % | 30.8 | % | 29.2 | % | 31.0 | % | ||||
Imports (% of total sales) | 14.4 | % | 14.4 | % | 11.5 | % | 12.0 | % | ||||
Store Count Information: | ||||||||||||
Tractor Supply | ||||||||||||
Beginning of period | 1,904 | 1,814 | 1,844 | 1,765 | ||||||||
New stores opened | 19 | 30 | 80 | 80 | ||||||||
Stores closed | — | — | (1) | (1) | ||||||||
End of period | 1,923 | 1,844 | 1,923 | 1,844 | ||||||||
Petsense | ||||||||||||
Beginning of period | 183 | 176 | 180 | 175 | ||||||||
New stores opened | 3 | 5 | 9 | 8 | ||||||||
Stores closed | (4) | (1) | (7) | (3) | ||||||||
End of period | 182 | 180 | 182 | 180 | ||||||||
Consolidated end of period | 2,105 | 2,024 | 2,105 | 2,024 | ||||||||
Pre-opening costs (000’s) | $1,021 | $2,832 | $8,602 | $8,090 | ||||||||
Balance Sheet Information: | ||||||||||||
Average inventory per store (000’s) (b) | $793.7 | $751.3 | $793.7 | $751.3 | ||||||||
Inventory turns (annualized) | 4.09 | 3.42 | 3.92 | 3.23 | ||||||||
Share repurchase program: | ||||||||||||
Cost (000’s) | $79,738 | $43,342 | $342,957 | $533,319 | ||||||||
Average purchase price per share | $135.91 | $94.63 | $99.72 | $99.05 | ||||||||
Capital Expenditures (in millions): | ||||||||||||
Information technology | $60.4 | $22.8 | $133.0 | $89.3 | ||||||||
Existing stores | 43.1 | 22.0 | 73.7 | 45.5 | ||||||||
New and relocated stores and stores not yet opened | 15.0 | 20.7 | 58.8 | 59.3 | ||||||||
Distribution center capacity and improvements | 11.8 | 5.4 | 23.4 | 19.7 | ||||||||
Corporate and other | 2.4 | 2.3 | 5.1 | 3.7 | ||||||||
Total | $132.7 | $73.2 | $294.0 | $217.5 | ||||||||
(a) Comparable store average transaction value increase includes the impact of transaction value growth achieved on the current period growth in transaction count. (b) Assumes average inventory cost, excluding inventory in transit. | ||||||||||||
Use of Non-GAAP Financial Measures
Tractor Supply reports its financial results in accordance with accounting principles generally accepted in the United States of America (U.S. GAAP). Tractor Supply also uses certain non-GAAP measures that fall within the meaning of Securities and Exchange Commission Regulation G and Regulation S-K Item 10(e), which may provide users of the financial information with additional meaningful comparison to prior reported results. Non-GAAP measures do not have standardized definitions and are not defined by U.S. GAAP. Therefore, Tractor Supply’s non-GAAP measures are unlikely to be comparable to similar measures presented by other companies. The presentation of these non-GAAP measures should not be considered in isolation from, as a substitute for, or as superior to the financial information presented in accordance with U.S. GAAP. We believe this information is useful in providing period-to-period comparisons of the results of our continuing operations.
Reconciliation of Non-GAAP Financial Measures (Unaudited) (in thousands, except per share amounts) | ||||||||||||||||||||
FOURTH QUARTER ENDED | ||||||||||||||||||||
December 26,
| Impairment (a) | December 26,
| ||||||||||||||||||
(As Reported) | (Adjustment) | (As Adjusted) | ||||||||||||||||||
% of | % of | % of | ||||||||||||||||||
Net | Net | Net | ||||||||||||||||||
Sales | Sales | Sales | ||||||||||||||||||
SG&A (including depreciation and amortization and asset impairment) | $ | 811,063 | 28.18 | % | $ | (74,051) | (2.57) | % | $ | 737,012 | 25.61 | % | ||||||||
Operating income | $ | 184,467 | 6.41 | % | $ | 74,051 | 2.57 | % | $ | 258,518 | 8.98 | % | ||||||||
Income before income taxes | $ | 176,381 | 6.13 | % | $ | 74,051 | 2.57 | % | $ | 250,432 | 8.70 | % | ||||||||
Income tax expense/(benefit) | $ | 40,488 | 1.41 | % | $ | (16,765) | (0.58) | % | $ | 23,723 | 0.82 | % | ||||||||
Net income | $ | 135,893 | 4.72 | % | $ | 57,286 | 1.99 | % | $ | 193,179 | 6.71 | % | ||||||||
Diluted net income per share | $ | 1.15 | $ | 0.49 | $ | 1.64 | ||||||||||||||
YEAR ENDED | ||||||||||||||||||||
December 26,
| Impairment (a) | December 26,
| ||||||||||||||||||
(As Reported) | (Adjustment) | (As Adjusted) | ||||||||||||||||||
% of | % of | % of | ||||||||||||||||||
Net | Net | Net | ||||||||||||||||||
Sales | Sales | Sales | ||||||||||||||||||
SG&A (including depreciation and amortization and asset impairment) | $ | 2,764,621 | 26.03 | % | $ | (74,051) | (0.70) | % | $ | 2,690,570 | 25.33 | % | ||||||||
Operating income | $ | 996,928 | 9.39 | % | $ | 74,051 | 0.70 | % | $ | 1,070,979 | 10.09 | % | ||||||||
Income before income taxes | $ | 968,147 | 9.12 | % | $ | 74,051 | 0.70 | % | $ | 1,042,198 | 9.82 | % | ||||||||
Income tax expense/(benefit) | $ | 219,189 | 2.07 | % | $ | (16,765) | (0.16) | % | $ | 202,424 | 1.91 | % | ||||||||
Net income | $ | 748,958 | 7.05 | % | $ | 57,286 | 0.54 | % | $ | 806,244 | 7.59 | % | ||||||||
Diluted net income per share | $ | 6.38 | $ | 0.49 | $ | 6.87 | ||||||||||||||
(a) Comprised of $68.97 million of impairment of goodwill and other intangible assets along with $5.08 million of impairment of other long-lived assets related to the Petsense reporting unit | ||||||||||||||||||||
View source version on businesswire.com: https://www.businesswire.com/news/home/20210128005200/en/
Contacts:
Contacts:
Mary Winn Pilkington (615) 440-4212
