
Nice jump up here to 2005 highs. First unambiguous positive indicator I’ve seen in quite a while.
United States ISM Non Manufacturing PMIJuly 5 (Trading Economics)
The ISM Non-manufacturing PMI index registered 60.3 percent in July, 4.3 percentage points higher than the June reading of 56 percent. It is the highest reading since August of 2005 as 15 out of 17 services industries reported growth. Non Manufacturing PMI in the United States averaged 54.15 percent from 1997 until 2015, reaching an all time high of 62 percent in August of 1997 and a record low of 37.60 percent in November of 2008. Non Manufacturing PMI in the United States is reported by the Institute for Supply Management.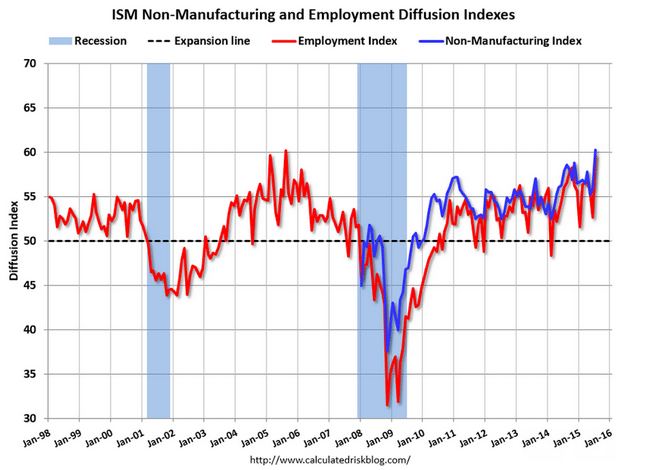
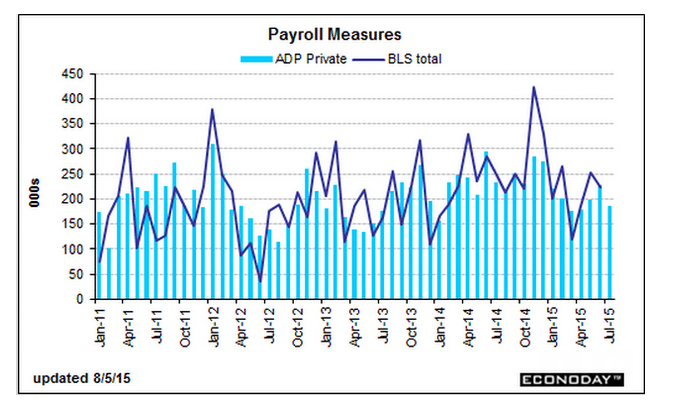
Another payroll chart:
Another trade chart: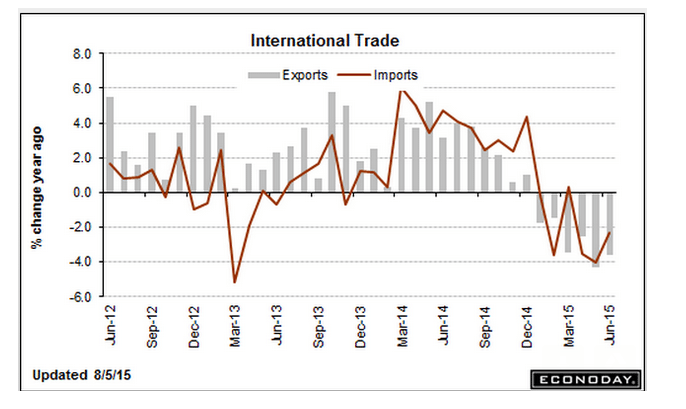
The post ISM, Employment, Trade appeared first on The Center of the Universe.
